Baryon anti-Baryon Photoproduction Cross Sections off the Proton
Abstract:
The GlueX experiment at Jefferson Lab has observed $p\bar{p}$ and, for the first time, $\Lambda\bar{\Lambda}$ and $p\bar{\Lambda}$ photoproduction from a proton target at photon energies up to 11.6 GeV. The angular distributions are forward peaked for all produced pairs, consistent with Regge-like $t$-channel exchange. Asymmetric wide-angle anti-baryon distributions show the presence of additional processes. In a phenomenological model, we find consistency with a double $t$-channel exchange process where anti-baryons are created only at the middle vertex. The model matches all observed distributions with a small number of free parameters. In the hyperon channels, we observe a clear distinction between photoproduction of the $\Lambda\bar{\Lambda}$ and $p\bar{\Lambda}$ systems but general similarity to the $p\bar{p}$ system. We report both total cross sections and cross sections differential with respect to momentum transfer and the invariant masses of the created particle pairs. No narrow resonant structures were found in these reaction channels. The suppression of $s\bar{s}$ quark pairs relative to $d\bar{d}$ quark pairs is similar to what has been seen in other reactions.Journal: Phys. Rev. C113 (2026) 4, 045207
arXiv: arXiv:2510.26890
HEPdata: link
Phys. Rev. C113 (2026) 4, 045207: downloads png pdf |
Figure 1:
Possible production mechanisms for $\gamma p \rightarrow {p\bar{p}} p$ in (a, b); $\gamma p \rightarrow {\Lambda\bar{\Lambda}} p$ in (c, d); $\gamma p \rightarrow {p\bar{\Lambda}} \Lambda$ in (e, f). These involve either single Regge-like exchange (Panels a, c, e) or double Regge-like exchange (Panels b, d, f). Note the different exchange particles available in the non-strange (a, c) and strange (e) single-exchange cases. |
Phys. Rev. C113 (2026) 4, 045207: downloads png pdf |
Figure 2a:
Missing-mass squared for kinematic fits to the $\gamma p \rightarrow p\bar{p} p$ reaction. The initial skimmed data (blue) are compared with signal Monte Carlo (red) with (a) minimal cuts applied, and (b) final cuts applied, except for the selection on the missing-mass squared itself (marked by black solid lines). |
Phys. Rev. C113 (2026) 4, 045207: downloads png pdf |
Figure 2b:
Missing-mass squared for kinematic fits to the $\gamma p \rightarrow p\bar{p} p$ reaction. The initial skimmed data (blue) are compared with signal Monte Carlo (red) with (a) minimal cuts applied, and (b) final cuts applied, except for the selection on the missing-mass squared itself (marked by black solid lines). |
Phys. Rev. C113 (2026) 4, 045207: downloads png pdf |
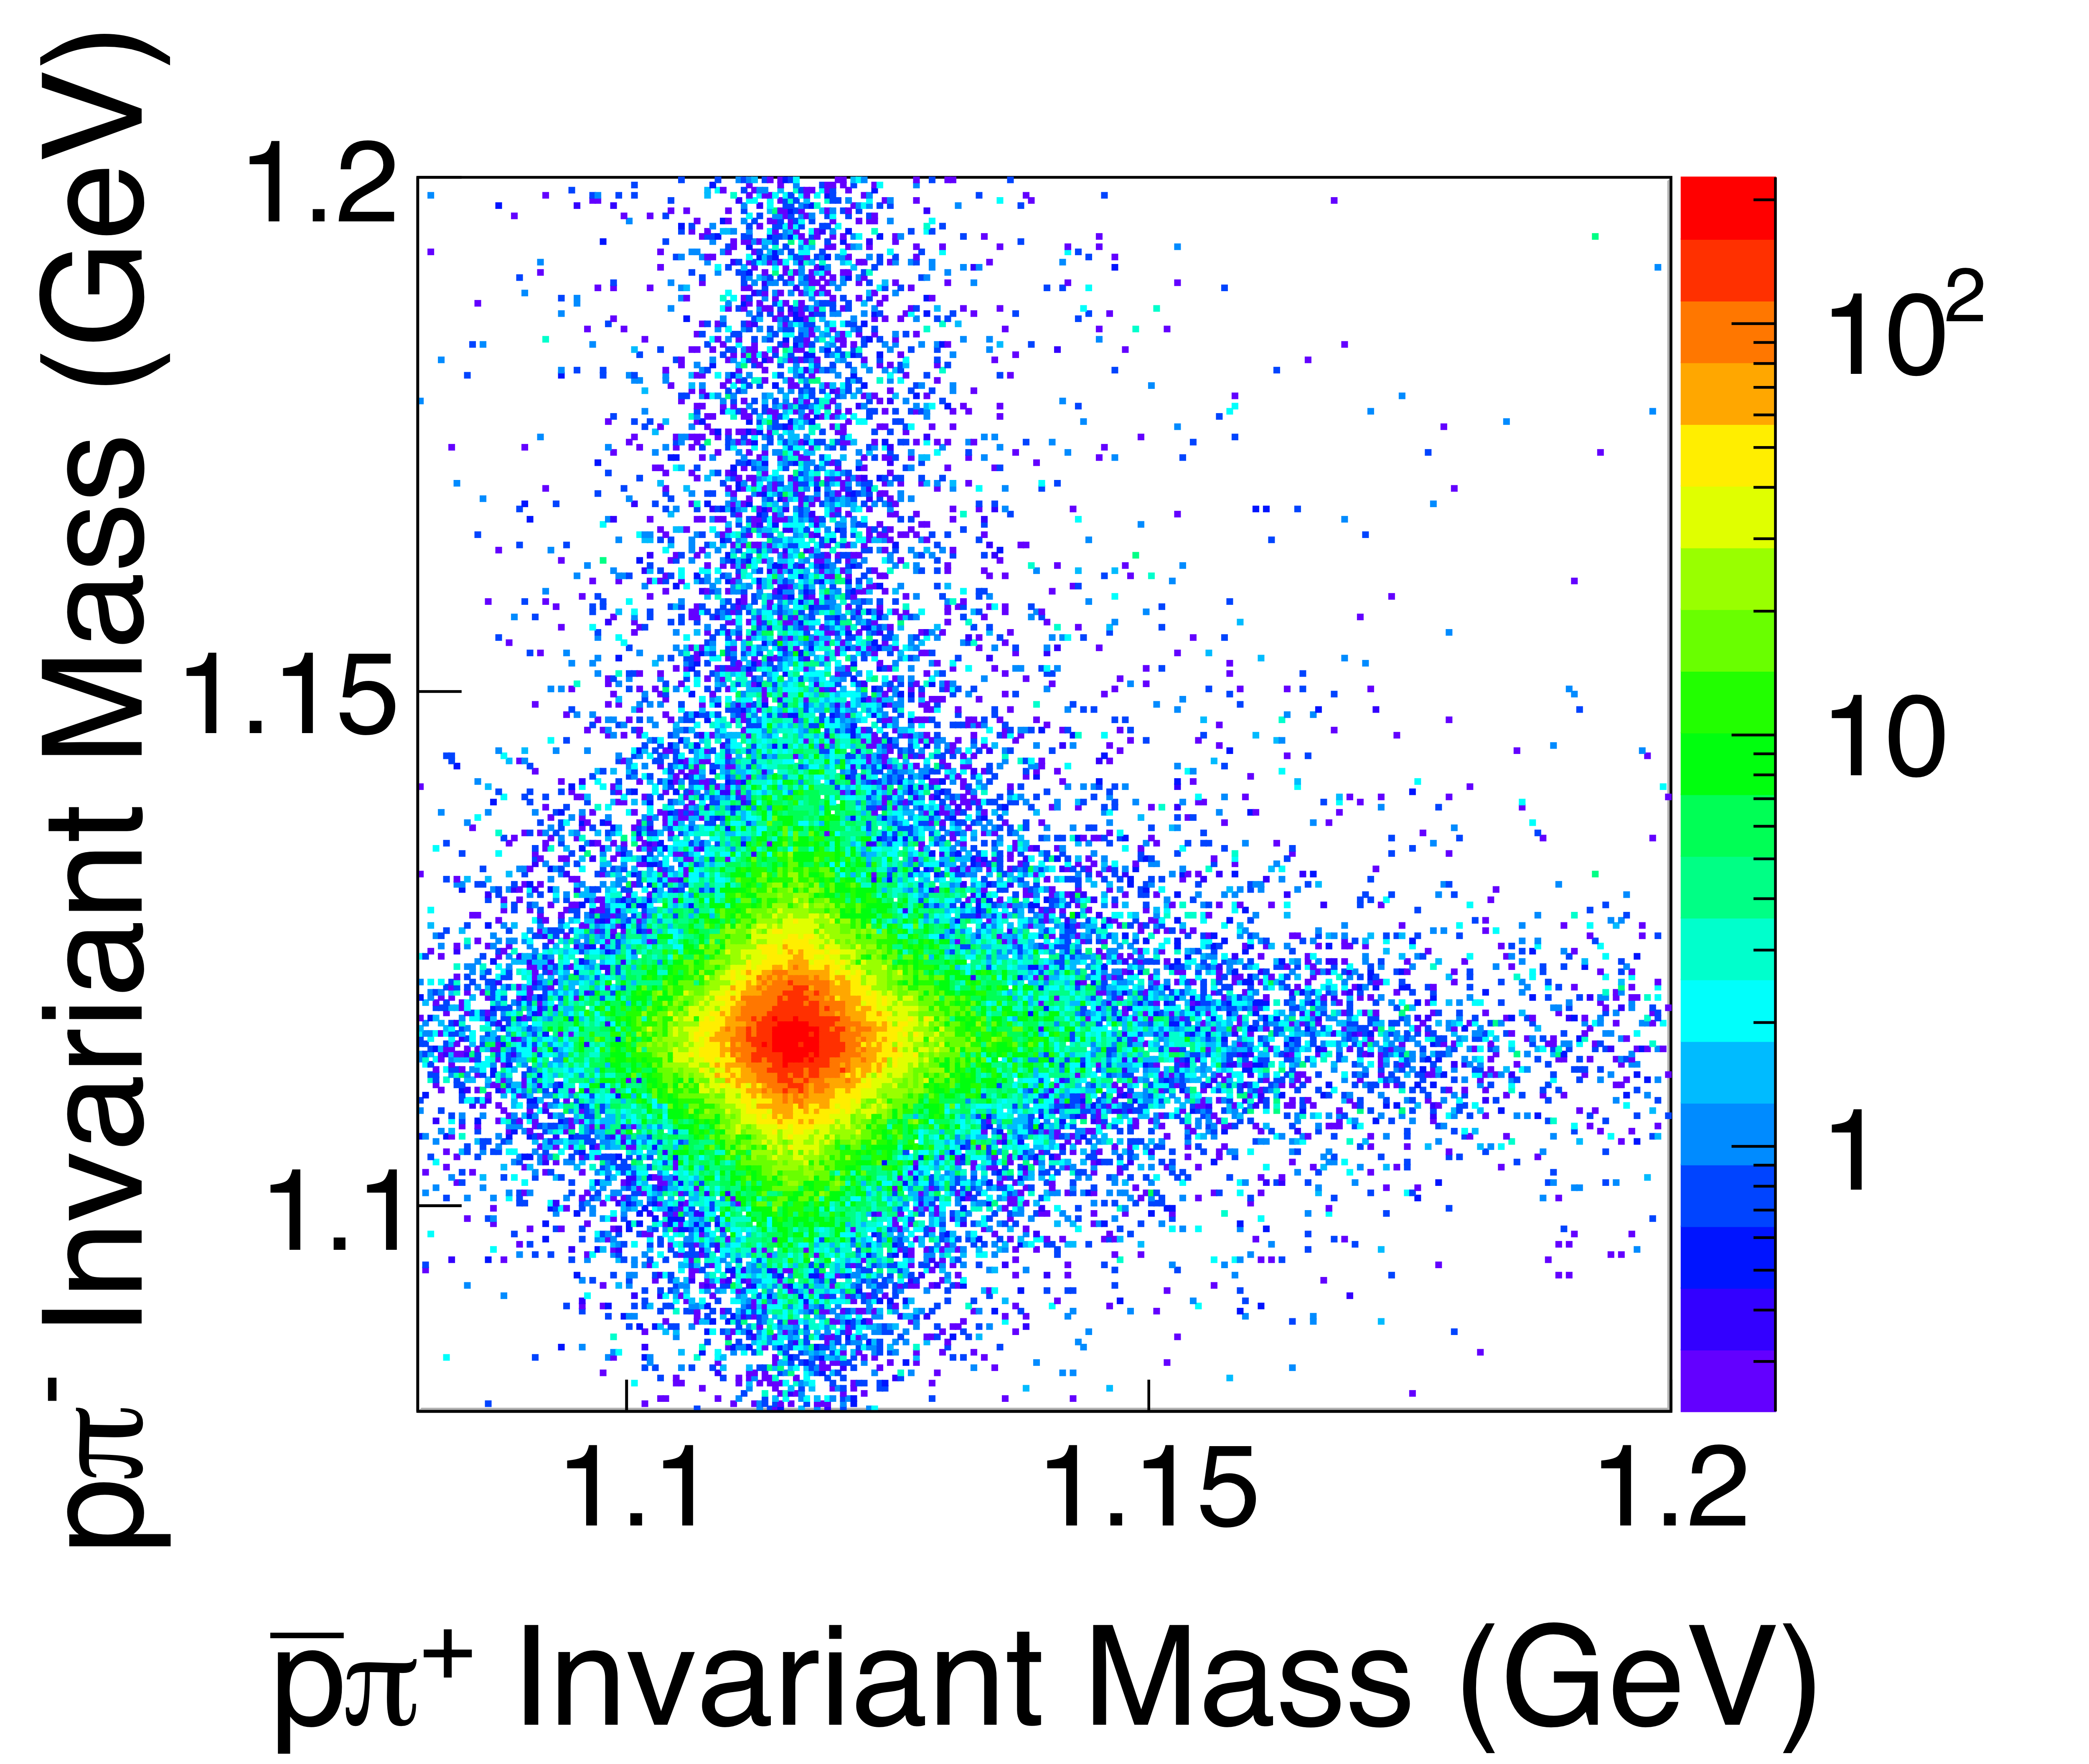
Figure 3a:
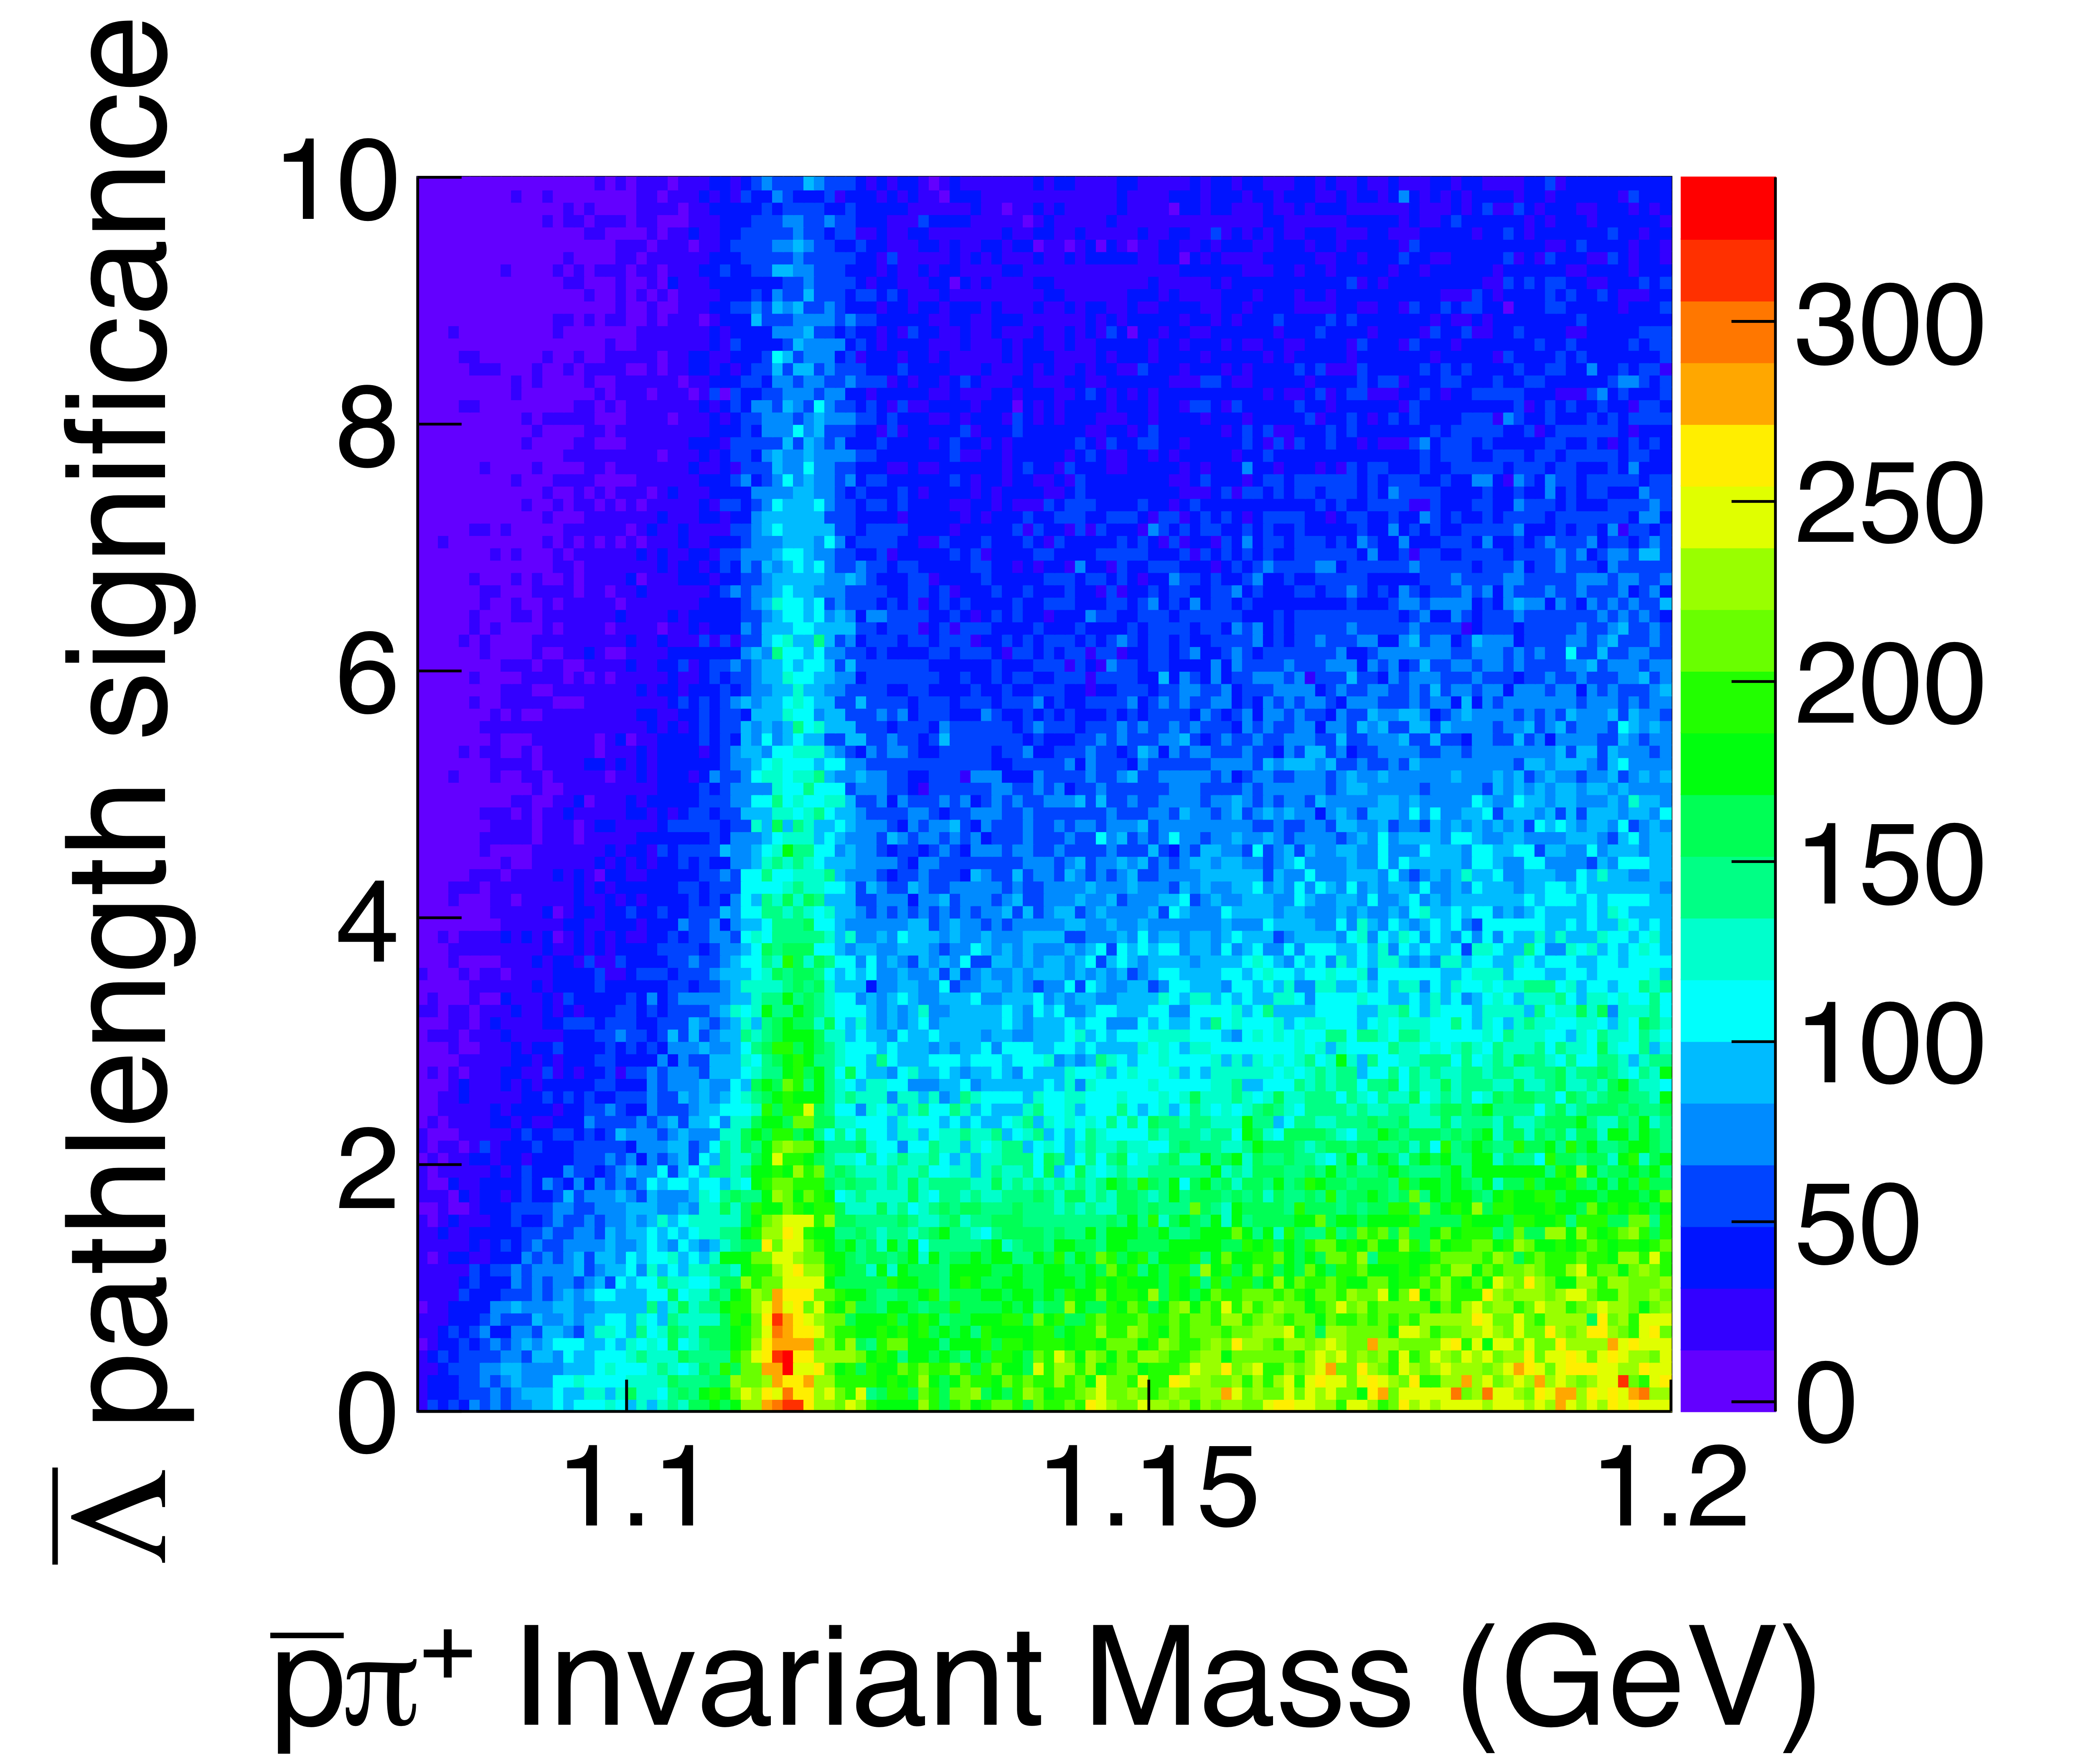
The correlation between the hyperon decay path-length significance ($PLS$) and the invariant mass distributions for (a) $\Lambda$ and (b) $\bar{\Lambda}$ particles. The masses were unconstrained in the $\gamma p \rightarrow \Lambda\bar{\Lambda} p$ kinematic fits. |
Phys. Rev. C113 (2026) 4, 045207: downloads png pdf |
Figure 3b:
The correlation between the hyperon decay path-length significance ($PLS$) and the invariant mass distributions for (a) $\Lambda$ and (b) $\bar{\Lambda}$ particles. The masses were unconstrained in the $\gamma p \rightarrow \Lambda\bar{\Lambda} p$ kinematic fits. |
Phys. Rev. C113 (2026) 4, 045207: downloads png pdf |
Figure 4a:
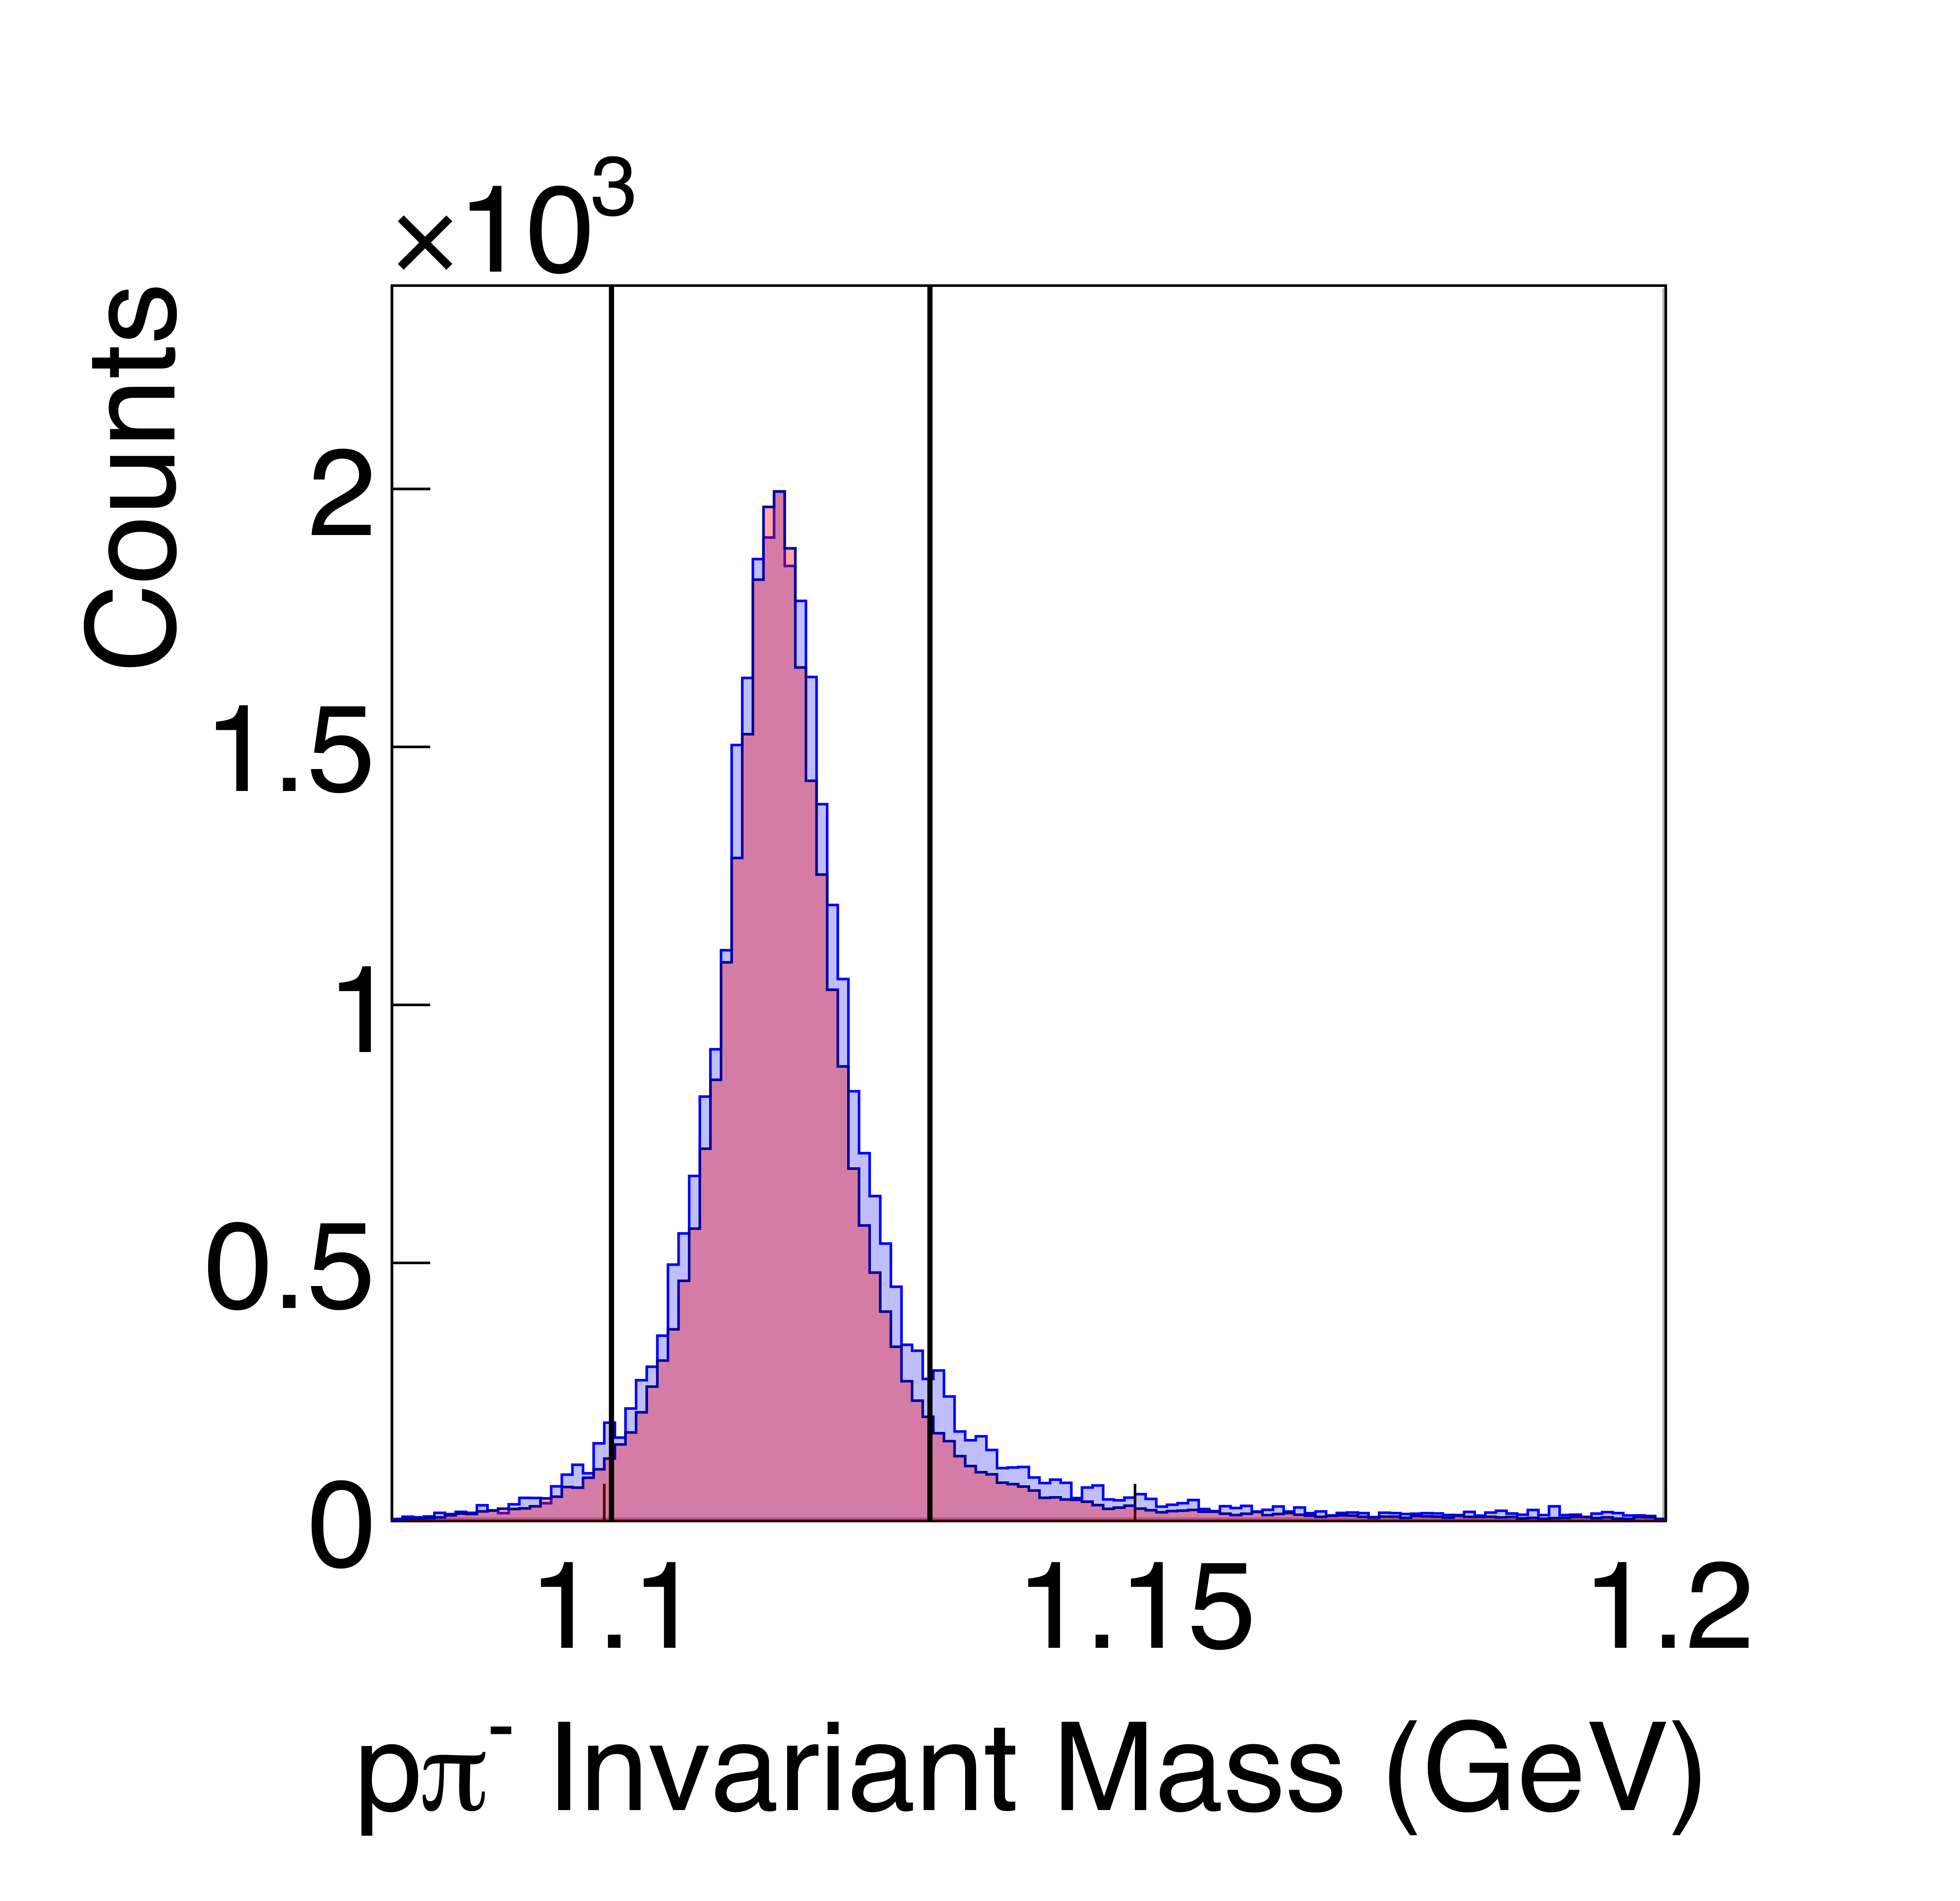
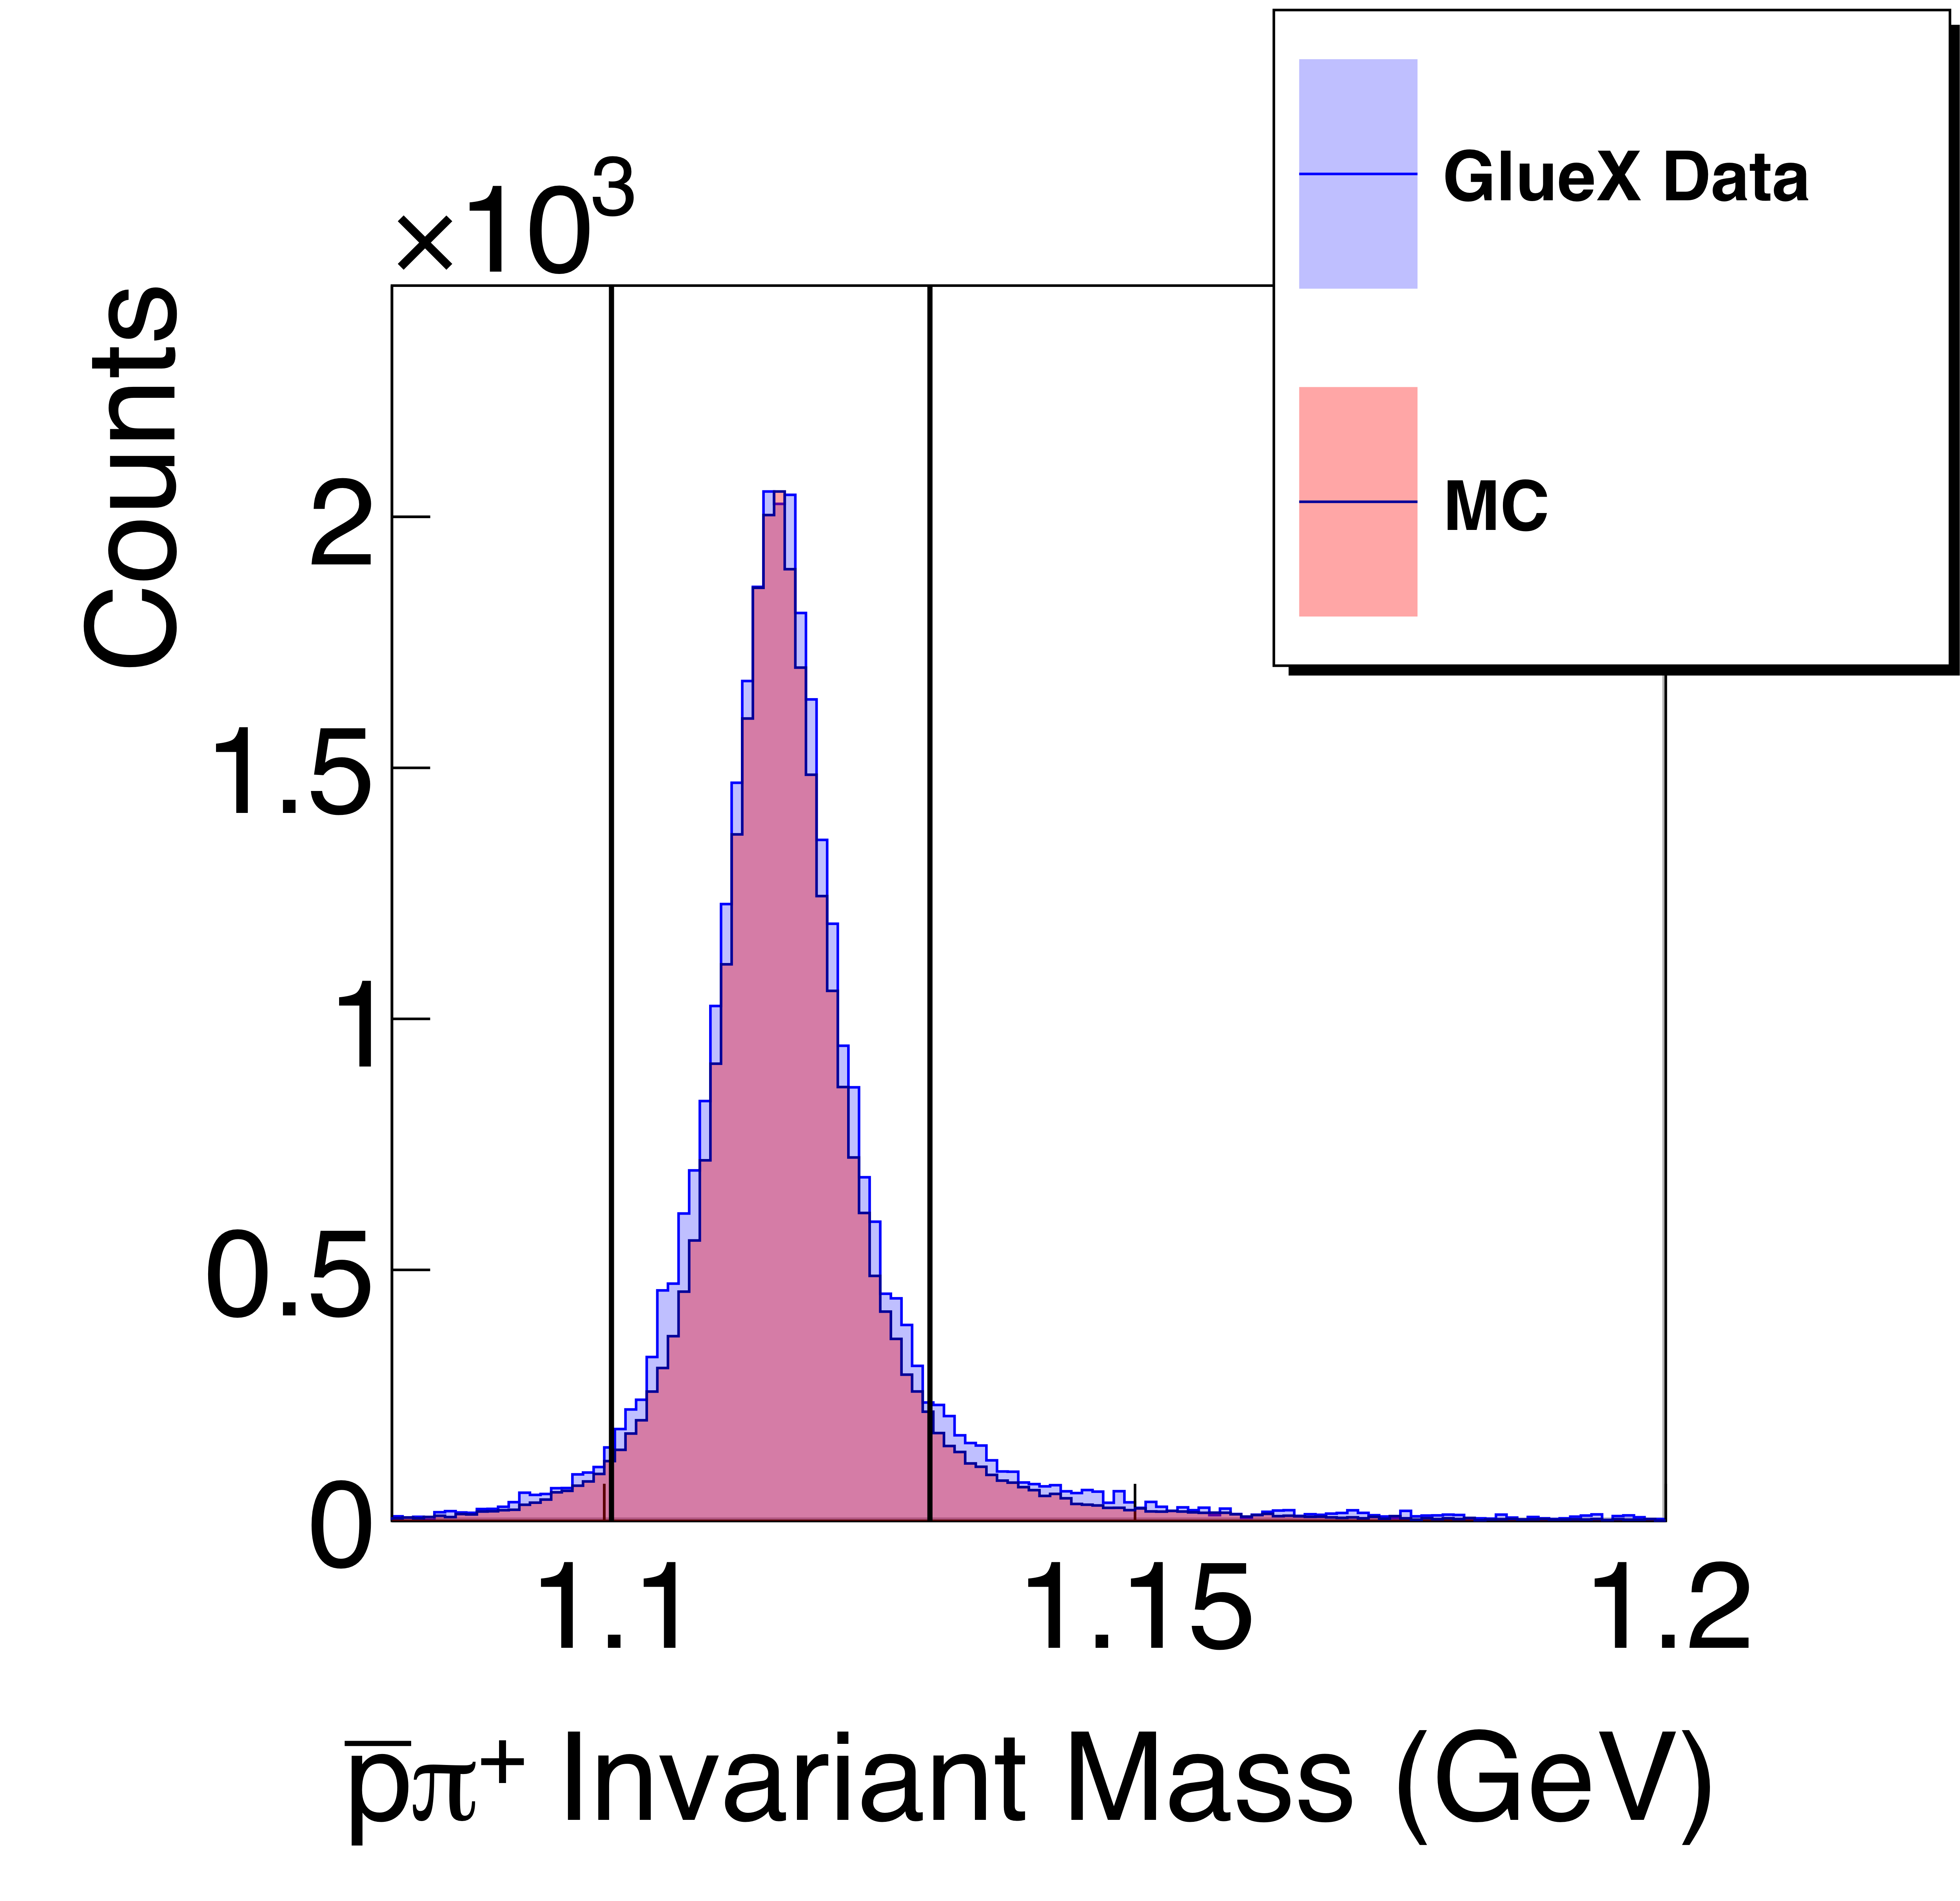
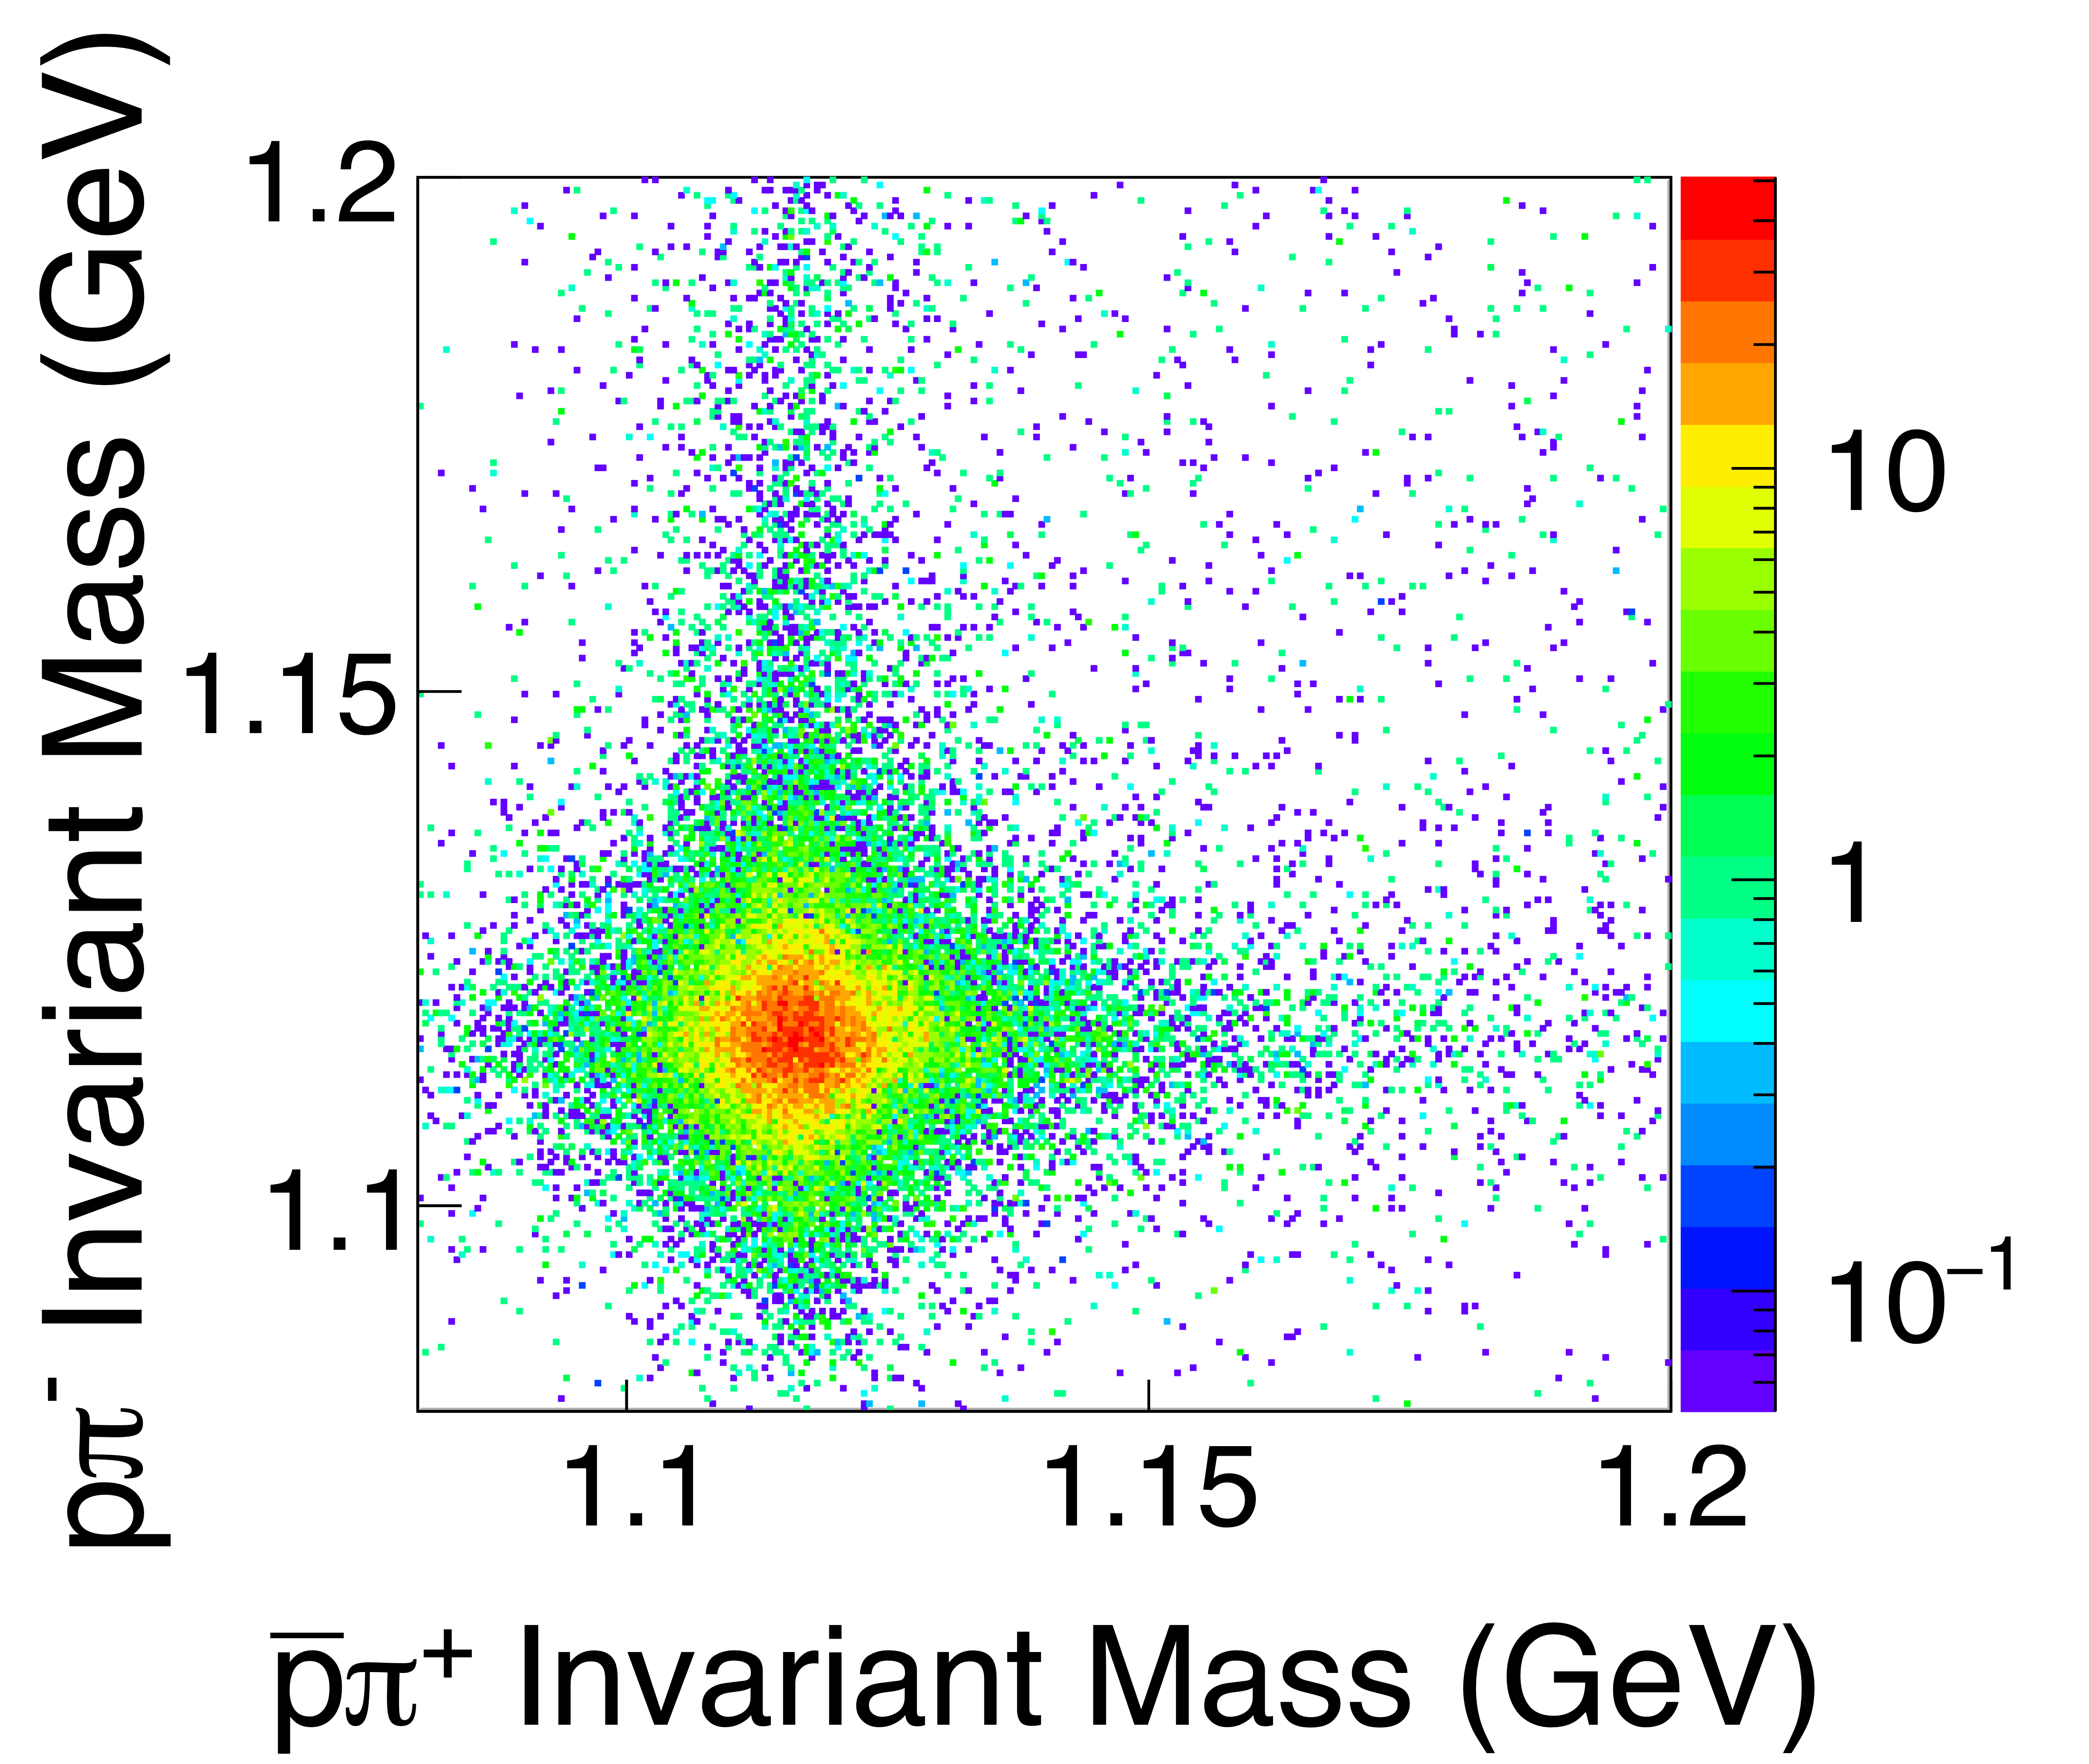
Top row, data (blue) is compared to signal Monte Carlo simulation (red). (a) Invariant mass of the reconstructed $\Lambda$, (b) Invariant mass of the reconstructed $\bar{\Lambda}$, (c) the correlation of two hyperon masses from data, (d) the correlation of two hyperon masses from MC simulation. The distributions are shown after all selections except for the selection on the invariant mass itself (denoted by the black solid lines). |
Phys. Rev. C113 (2026) 4, 045207: downloads png pdf |
Figure 4b:
Top row, data (blue) is compared to signal Monte Carlo simulation (red). (a) Invariant mass of the reconstructed $\Lambda$, (b) Invariant mass of the reconstructed $\bar{\Lambda}$, (c) the correlation of two hyperon masses from data, (d) the correlation of two hyperon masses from MC simulation. The distributions are shown after all selections except for the selection on the invariant mass itself (denoted by the black solid lines). |
Phys. Rev. C113 (2026) 4, 045207: downloads png pdf |
Figure 4c:
Top row, data (blue) is compared to signal Monte Carlo simulation (red). (a) Invariant mass of the reconstructed $\Lambda$, (b) Invariant mass of the reconstructed $\bar{\Lambda}$, (c) the correlation of two hyperon masses from data, (d) the correlation of two hyperon masses from MC simulation. The distributions are shown after all selections except for the selection on the invariant mass itself (denoted by the black solid lines). |
Phys. Rev. C113 (2026) 4, 045207: downloads png pdf |
Figure 4d:
Top row, data (blue) is compared to signal Monte Carlo simulation (red). (a) Invariant mass of the reconstructed $\Lambda$, (b) Invariant mass of the reconstructed $\bar{\Lambda}$, (c) the correlation of two hyperon masses from data, (d) the correlation of two hyperon masses from MC simulation. The distributions are shown after all selections except for the selection on the invariant mass itself (denoted by the black solid lines). |
Phys. Rev. C113 (2026) 4, 045207: downloads png pdf |
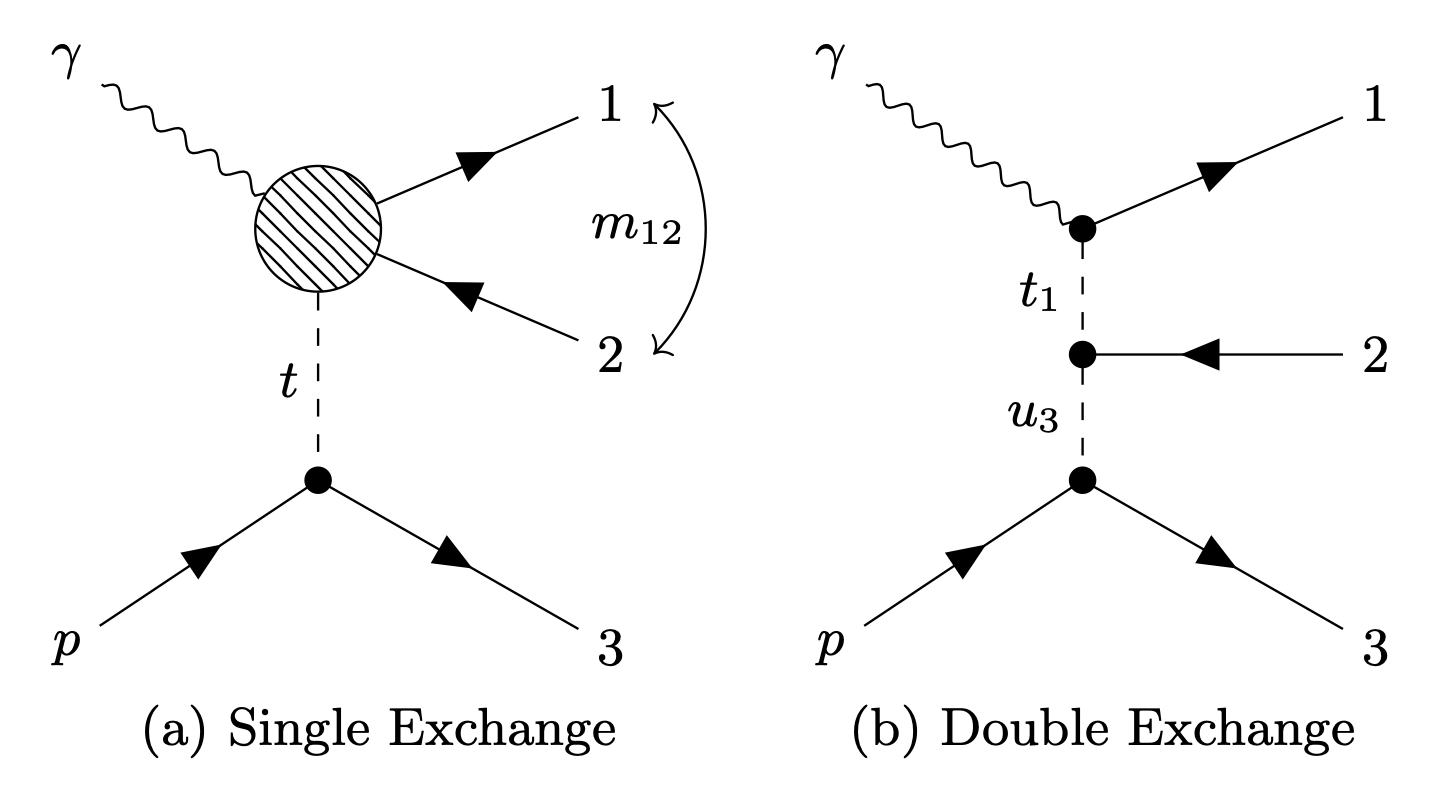
Figure 5:
Diagrams of the (a) single t-channel exchange and (b) double t-channel exchange model formulated for the reaction $\gamma + p \rightarrow 1 + 2 + 3$. Particle 2 is the anti-baryon in each case. |
Phys. Rev. C113 (2026) 4, 045207: downloads png pdf |
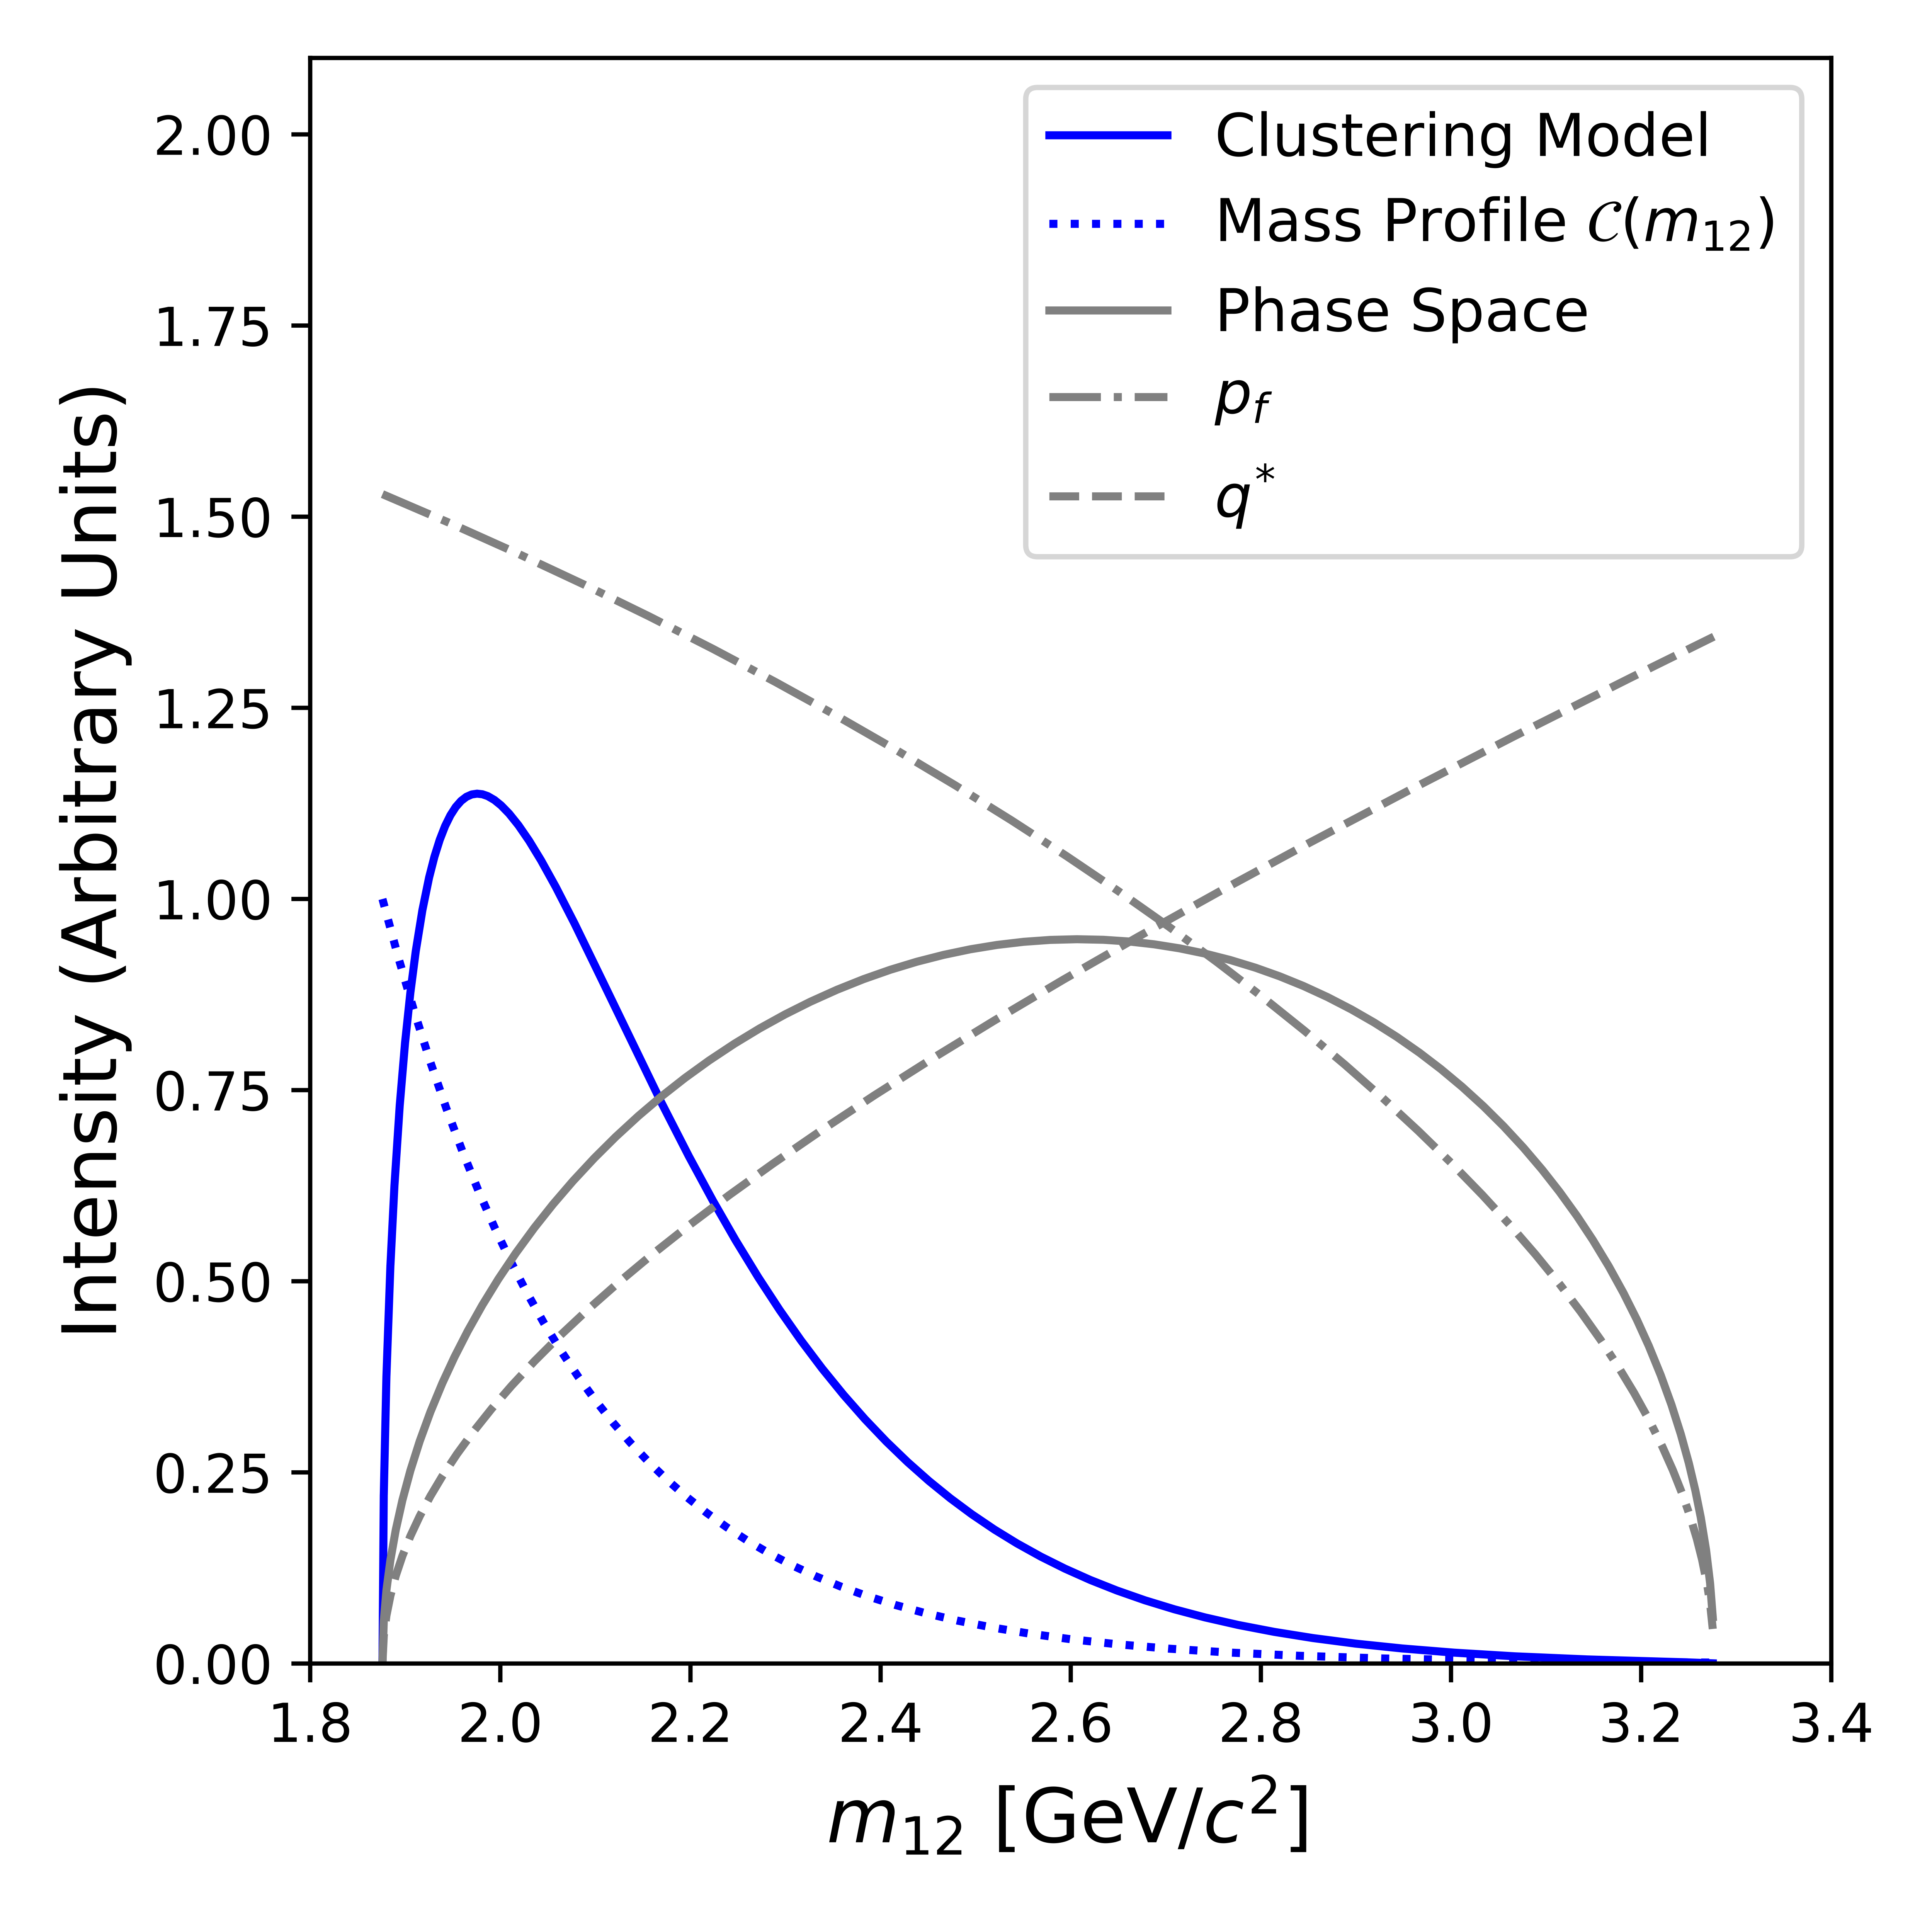
Figure 6:
Intensities (in arbitrary units) of components of the 3-body kinematics for the reaction $\gamma p \rightarrow \{p\bar{p}\} p$ as a function of $m_{12}$ at $E_{\gamma} = 9.0$ GeV, the two-body decay momentum $q^*$ (gray dashed line) in the $p\bar{p}$ pair rest frame; the two-body breakup momentum $p_{f}$ (grey dot-dashed line) between the recoil proton and $p\bar{p}$ system in the overall CM frame; and the full three-body phase space $Phsp(m_{12})$ (gray solid line) (Eq. 6). The phase space is modified by an exponential mass profile introduced as $\mathcal{C}(m_{12})$ (blue dotted curve)(Eq. 10), leading to the differential cross section line shape of the ``clustering" model (blue solid curve) given in Eq. 14 |
Phys. Rev. C113 (2026) 4, 045207: downloads png pdf |
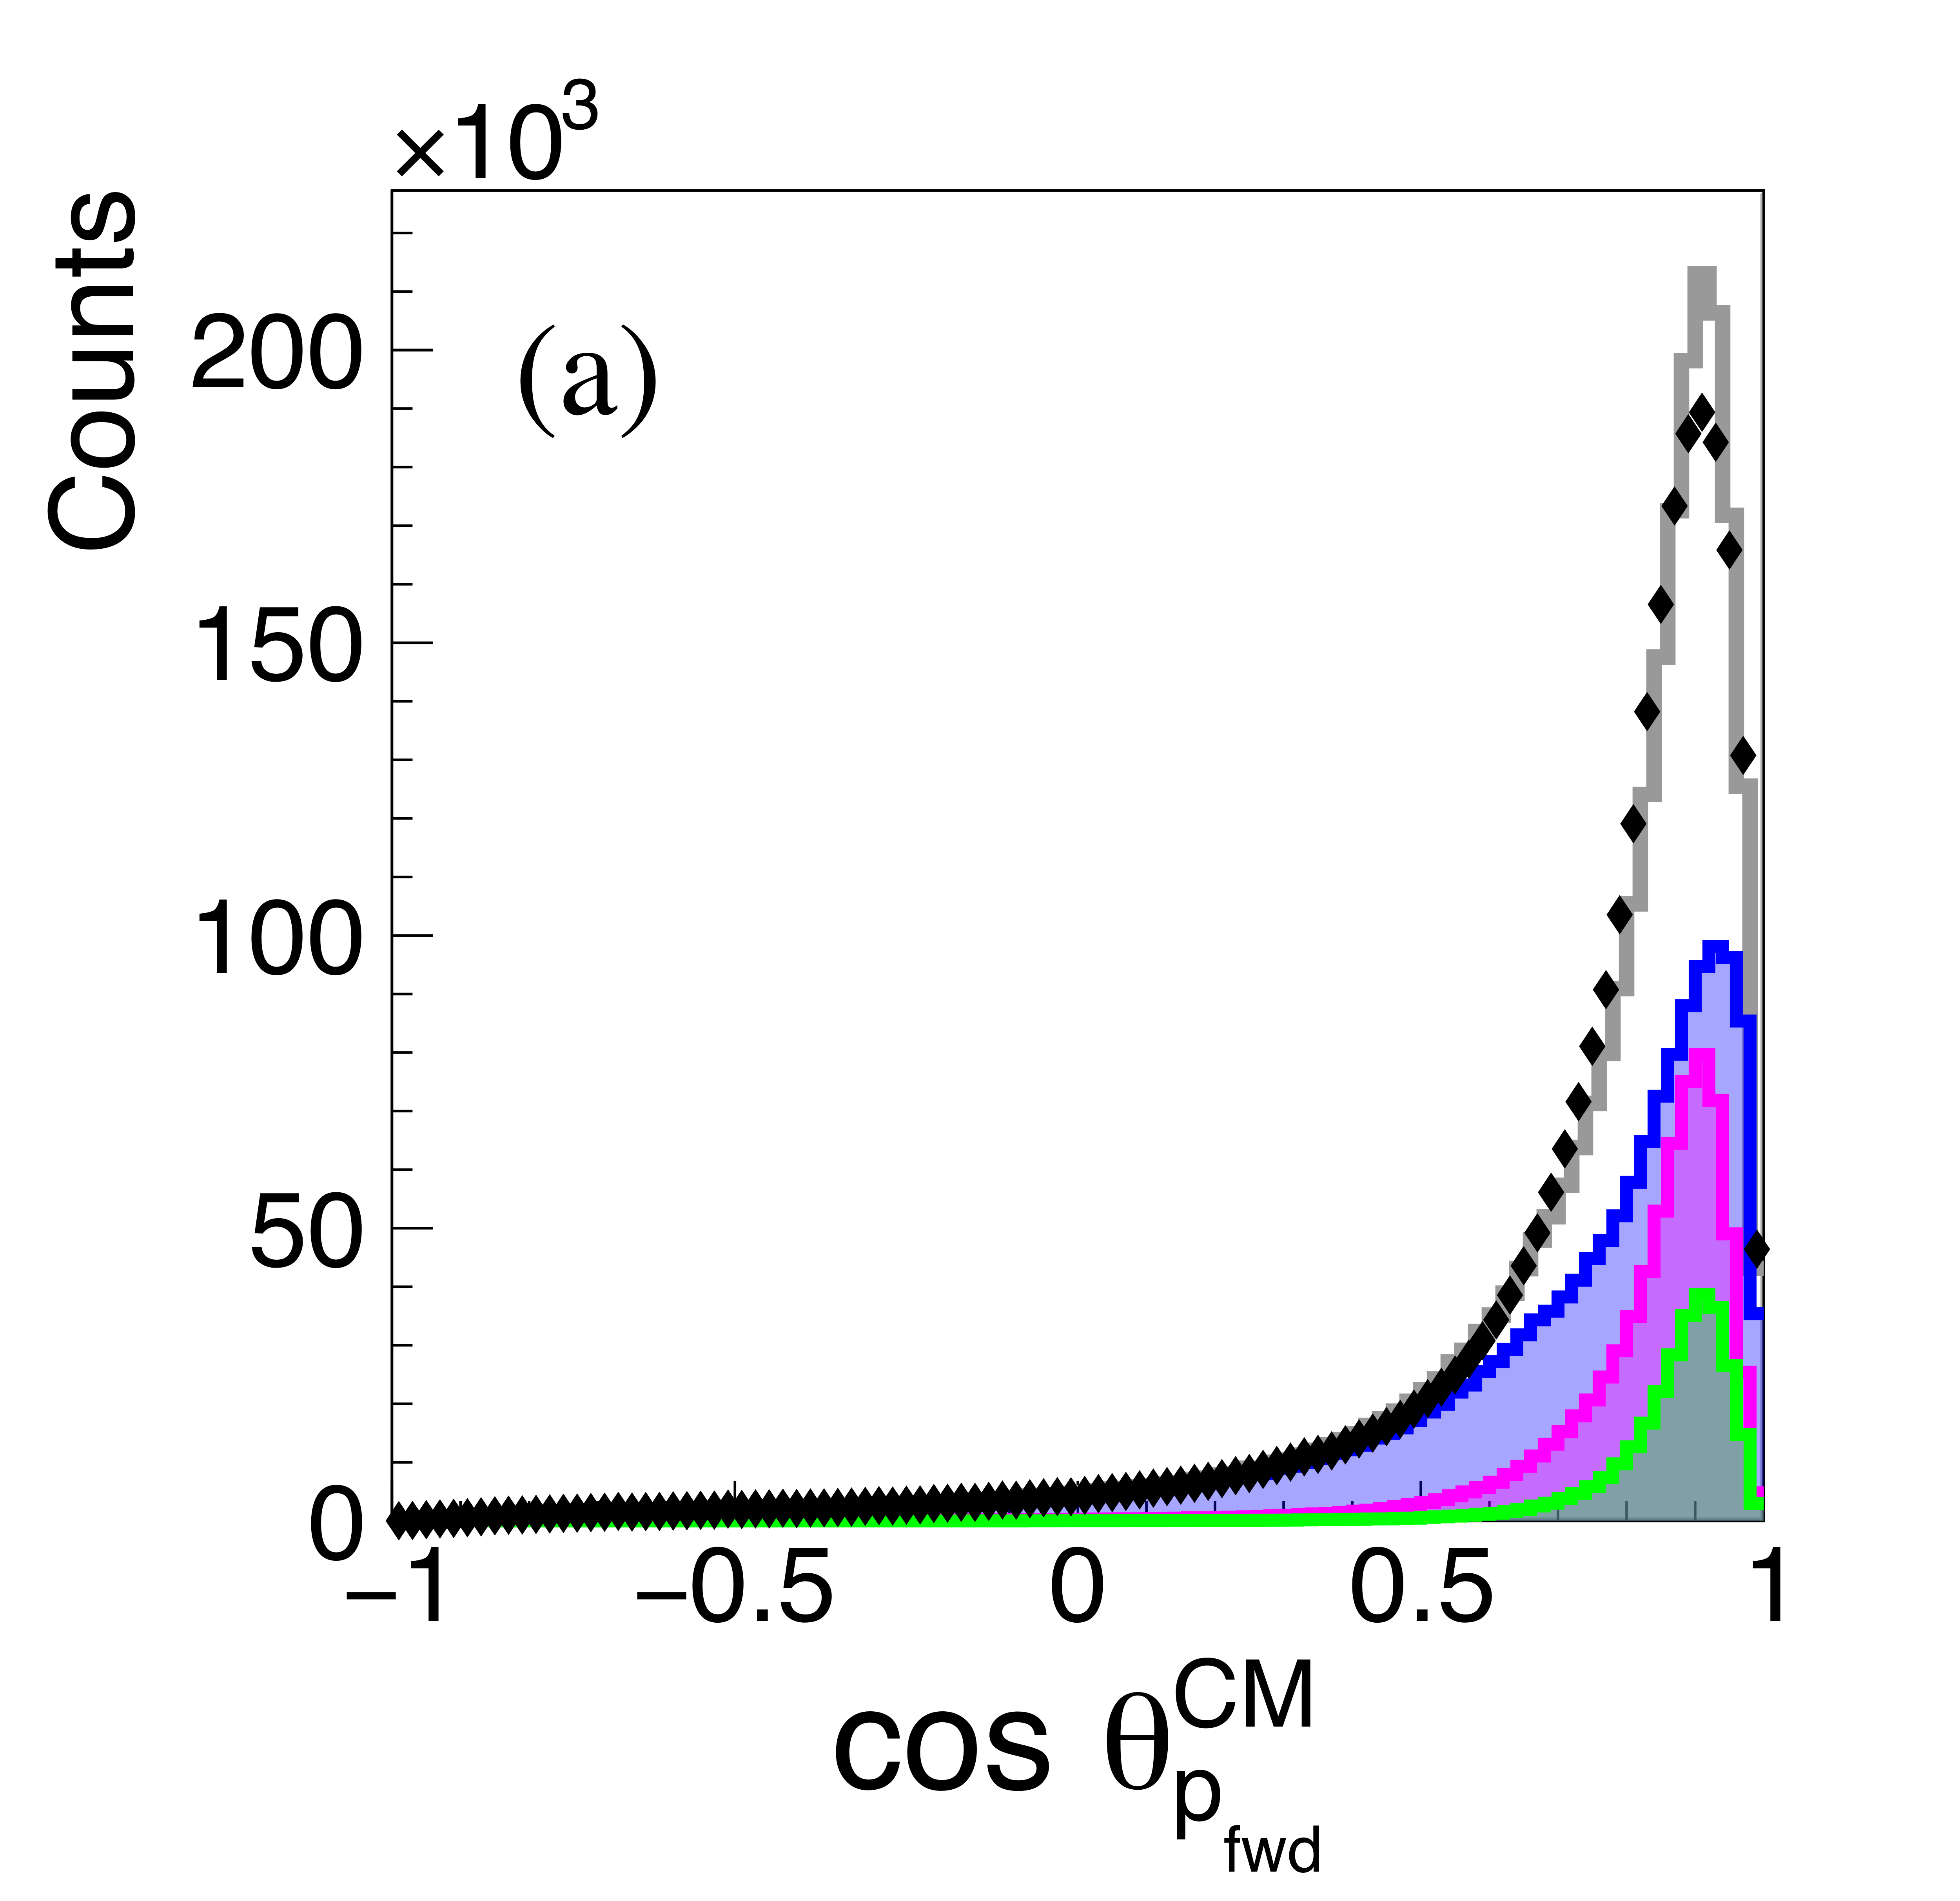
Figure 7a:
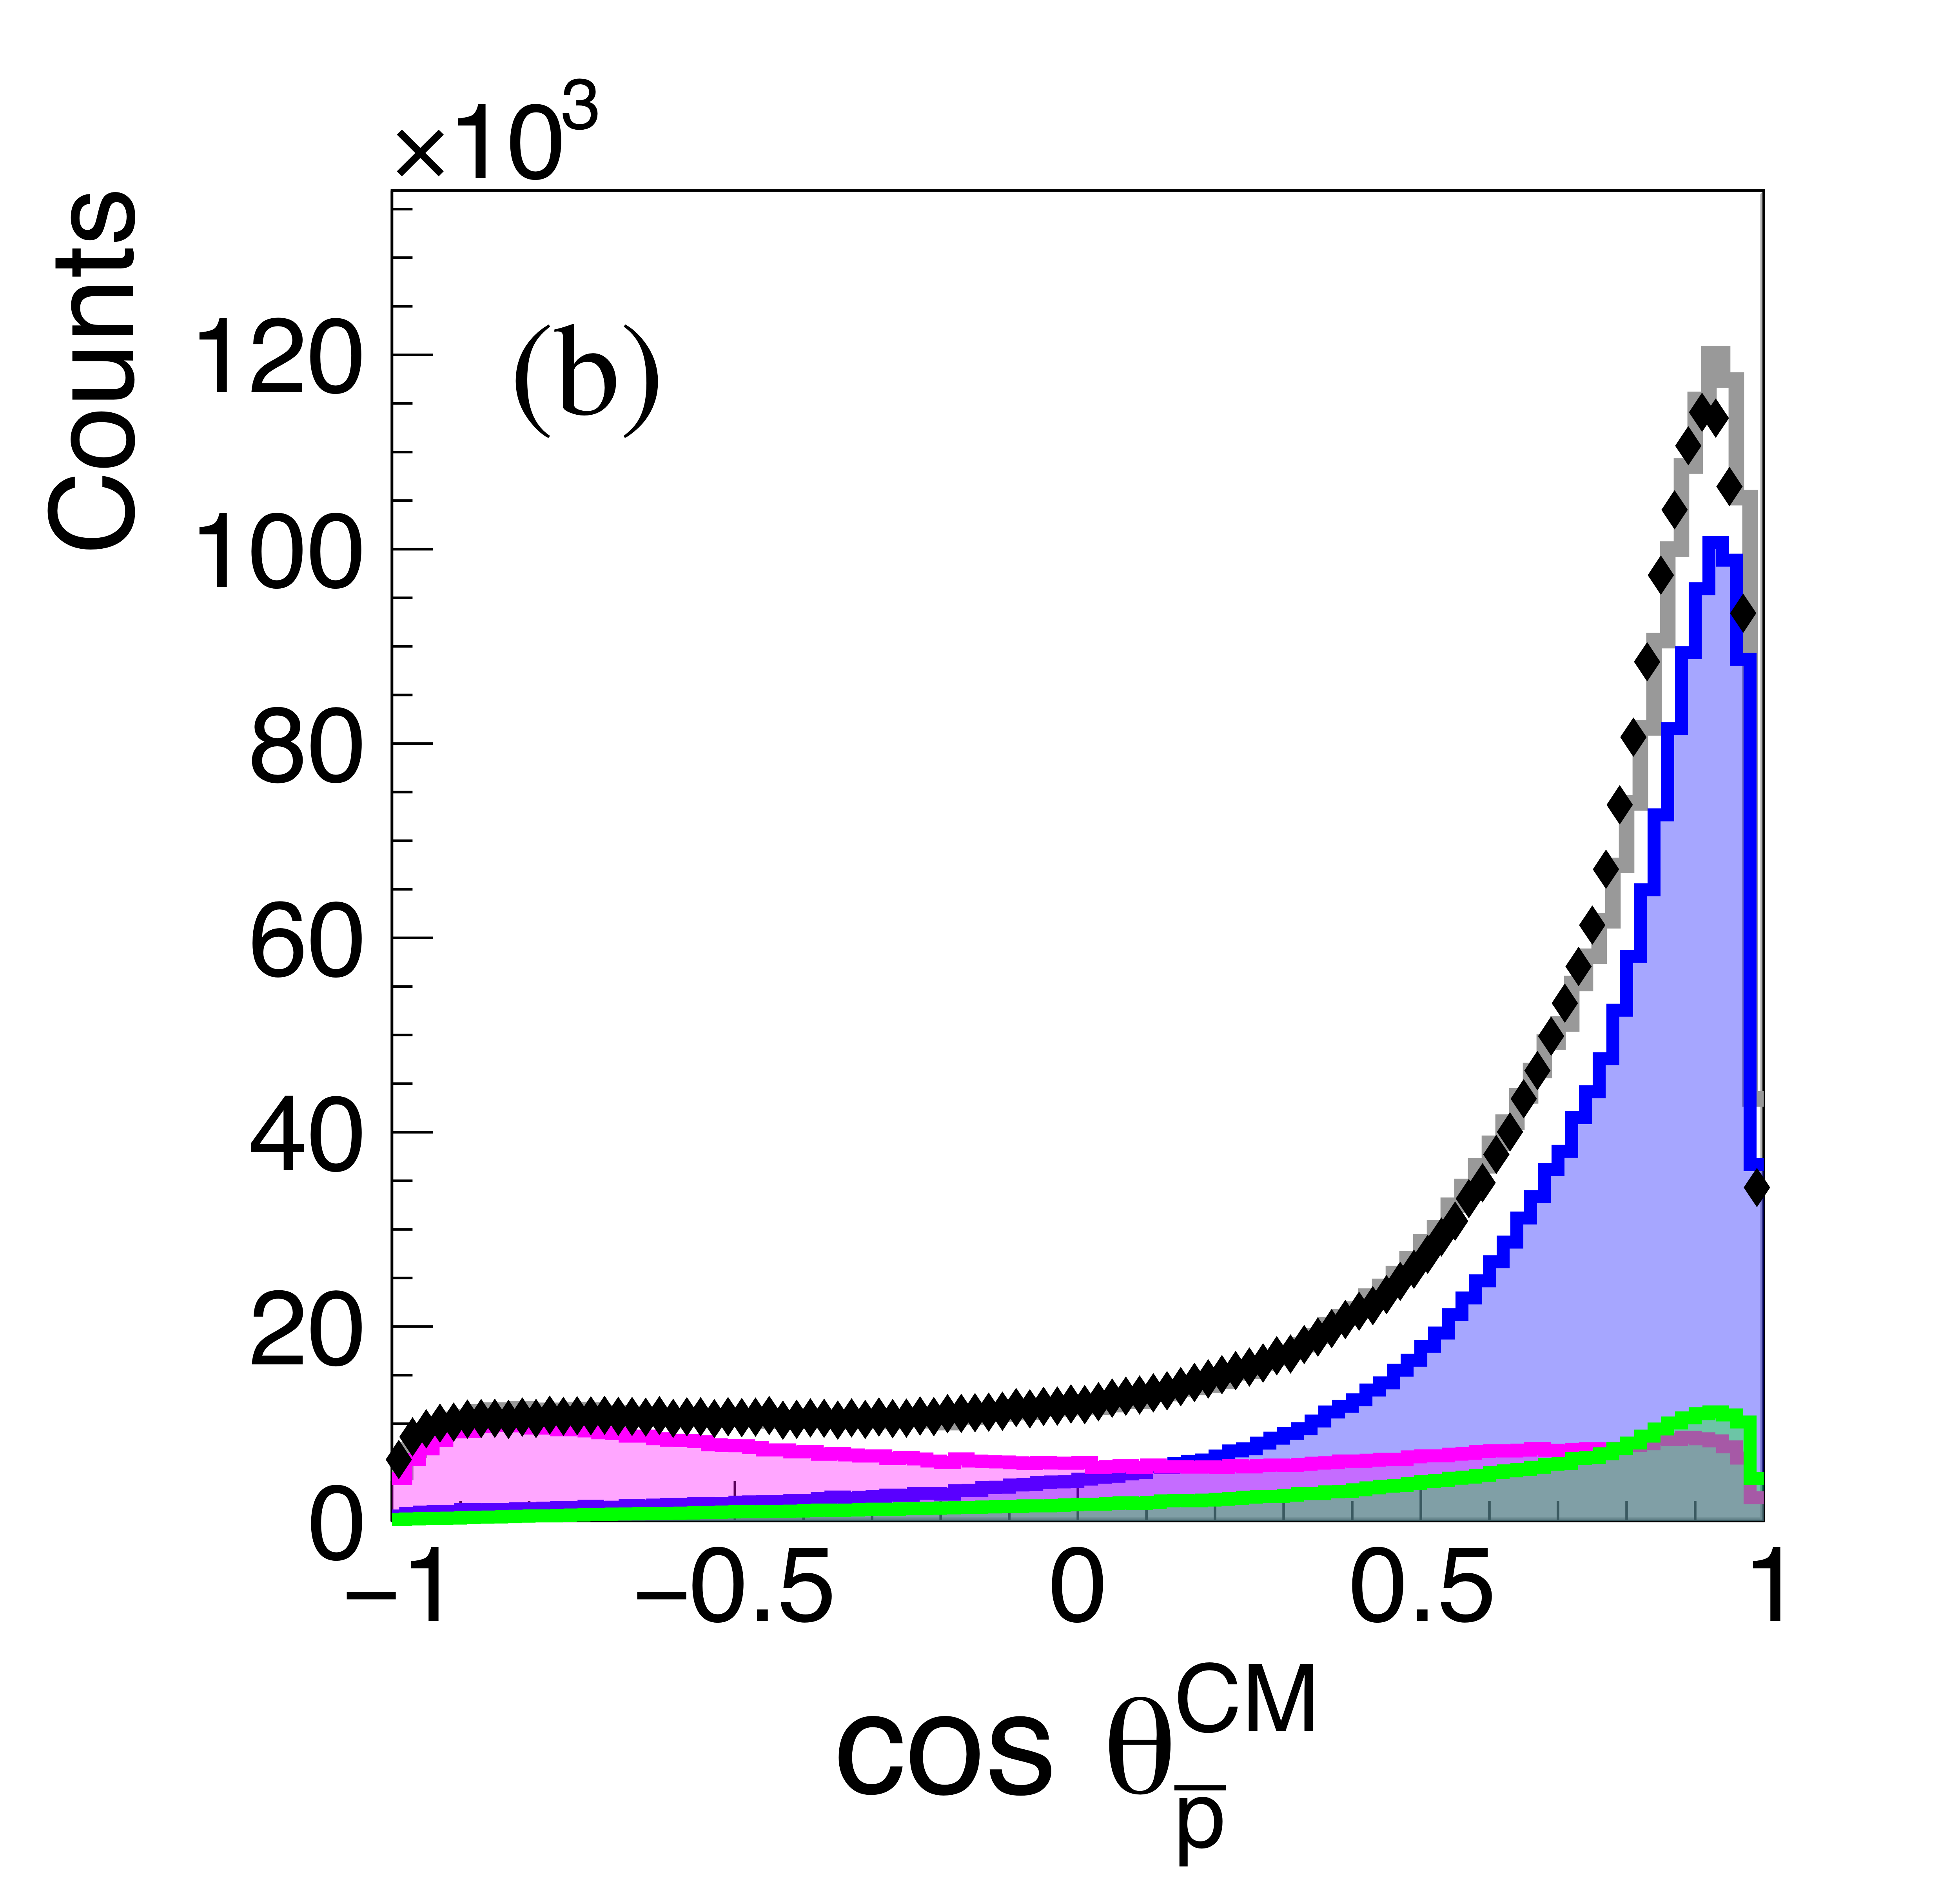
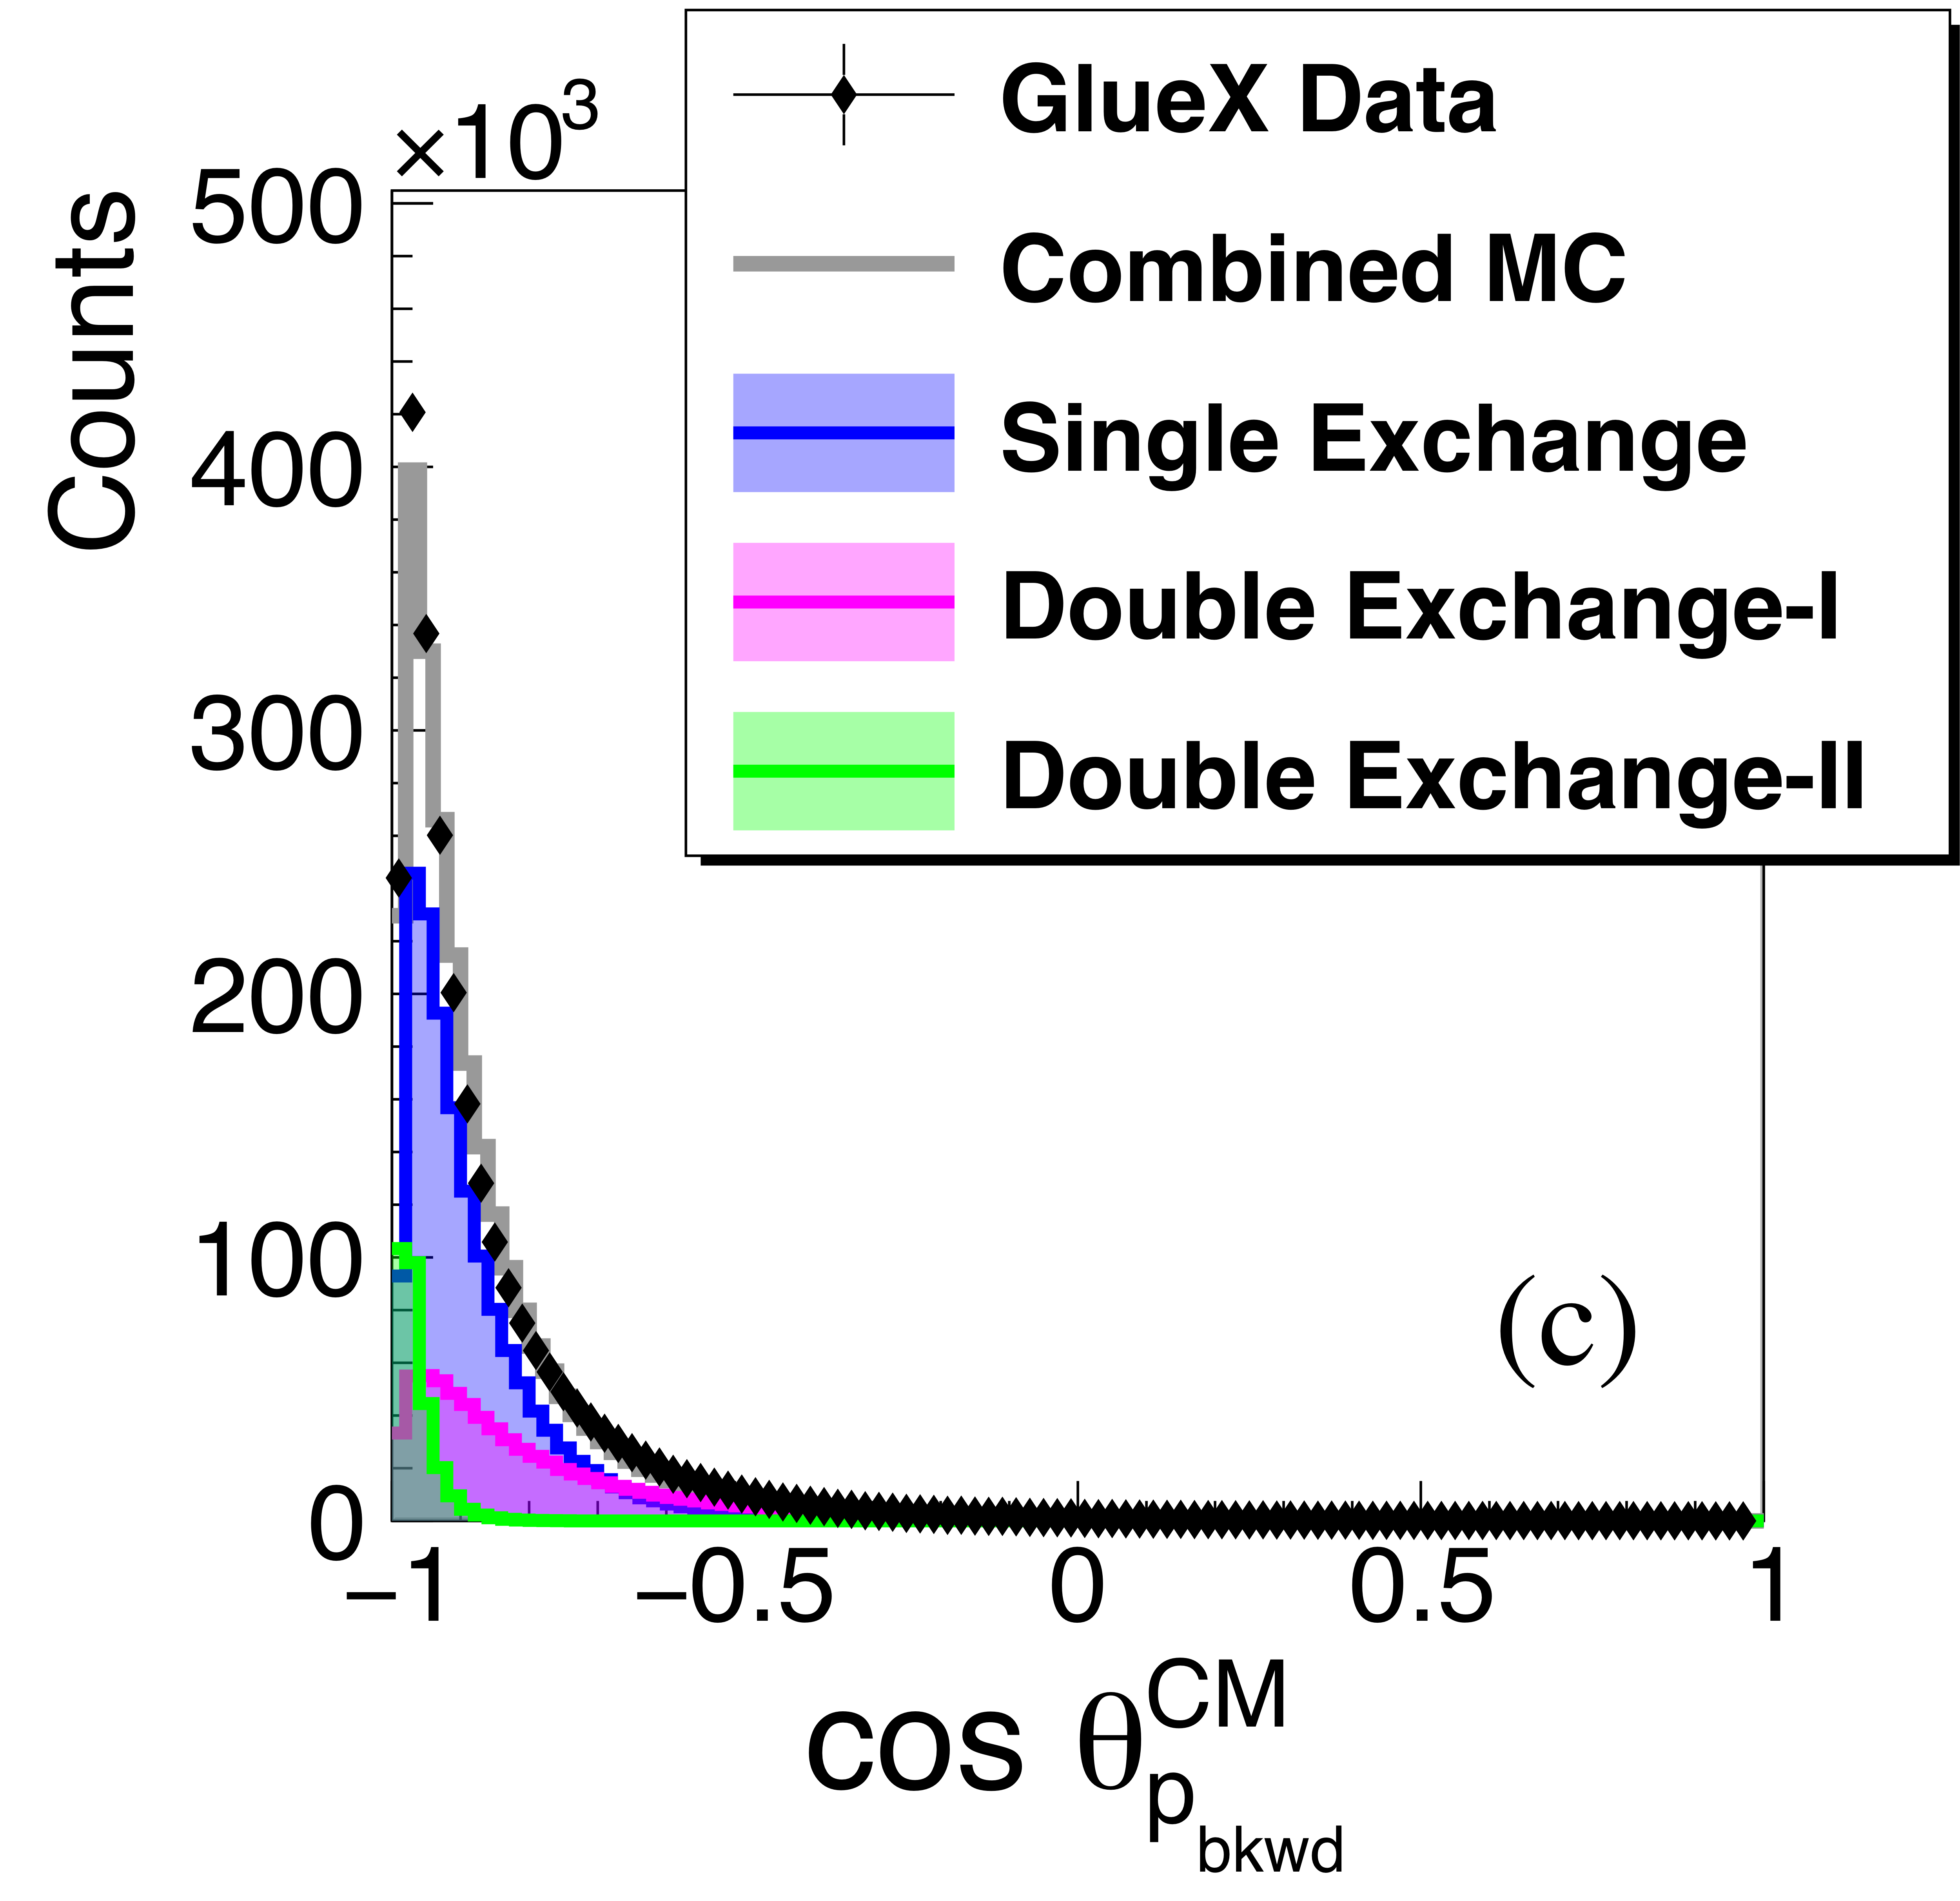
The angular distributions of the two protons (a), (c), and the anti-proton (b) in the $\gamma p \rightarrow p \bar{p} p $ reaction in the overall CM frame. Not acceptance corrected. The data are shown as black points and the summed simulation fit as a gray histogram. Components of the Monte Carlo simulations are shown as, Single Exchange (blue filled), Double Exchange-I (magenta filled), Double Exchange-II (green filled). |
Phys. Rev. C113 (2026) 4, 045207: downloads png pdf |
Figure 7b:
The angular distributions of the two protons (a), (c), and the anti-proton (b) in the $\gamma p \rightarrow p \bar{p} p $ reaction in the overall CM frame. Not acceptance corrected. The data are shown as black points and the summed simulation fit as a gray histogram. Components of the Monte Carlo simulations are shown as, Single Exchange (blue filled), Double Exchange-I (magenta filled), Double Exchange-II (green filled). |
Phys. Rev. C113 (2026) 4, 045207: downloads png pdf |
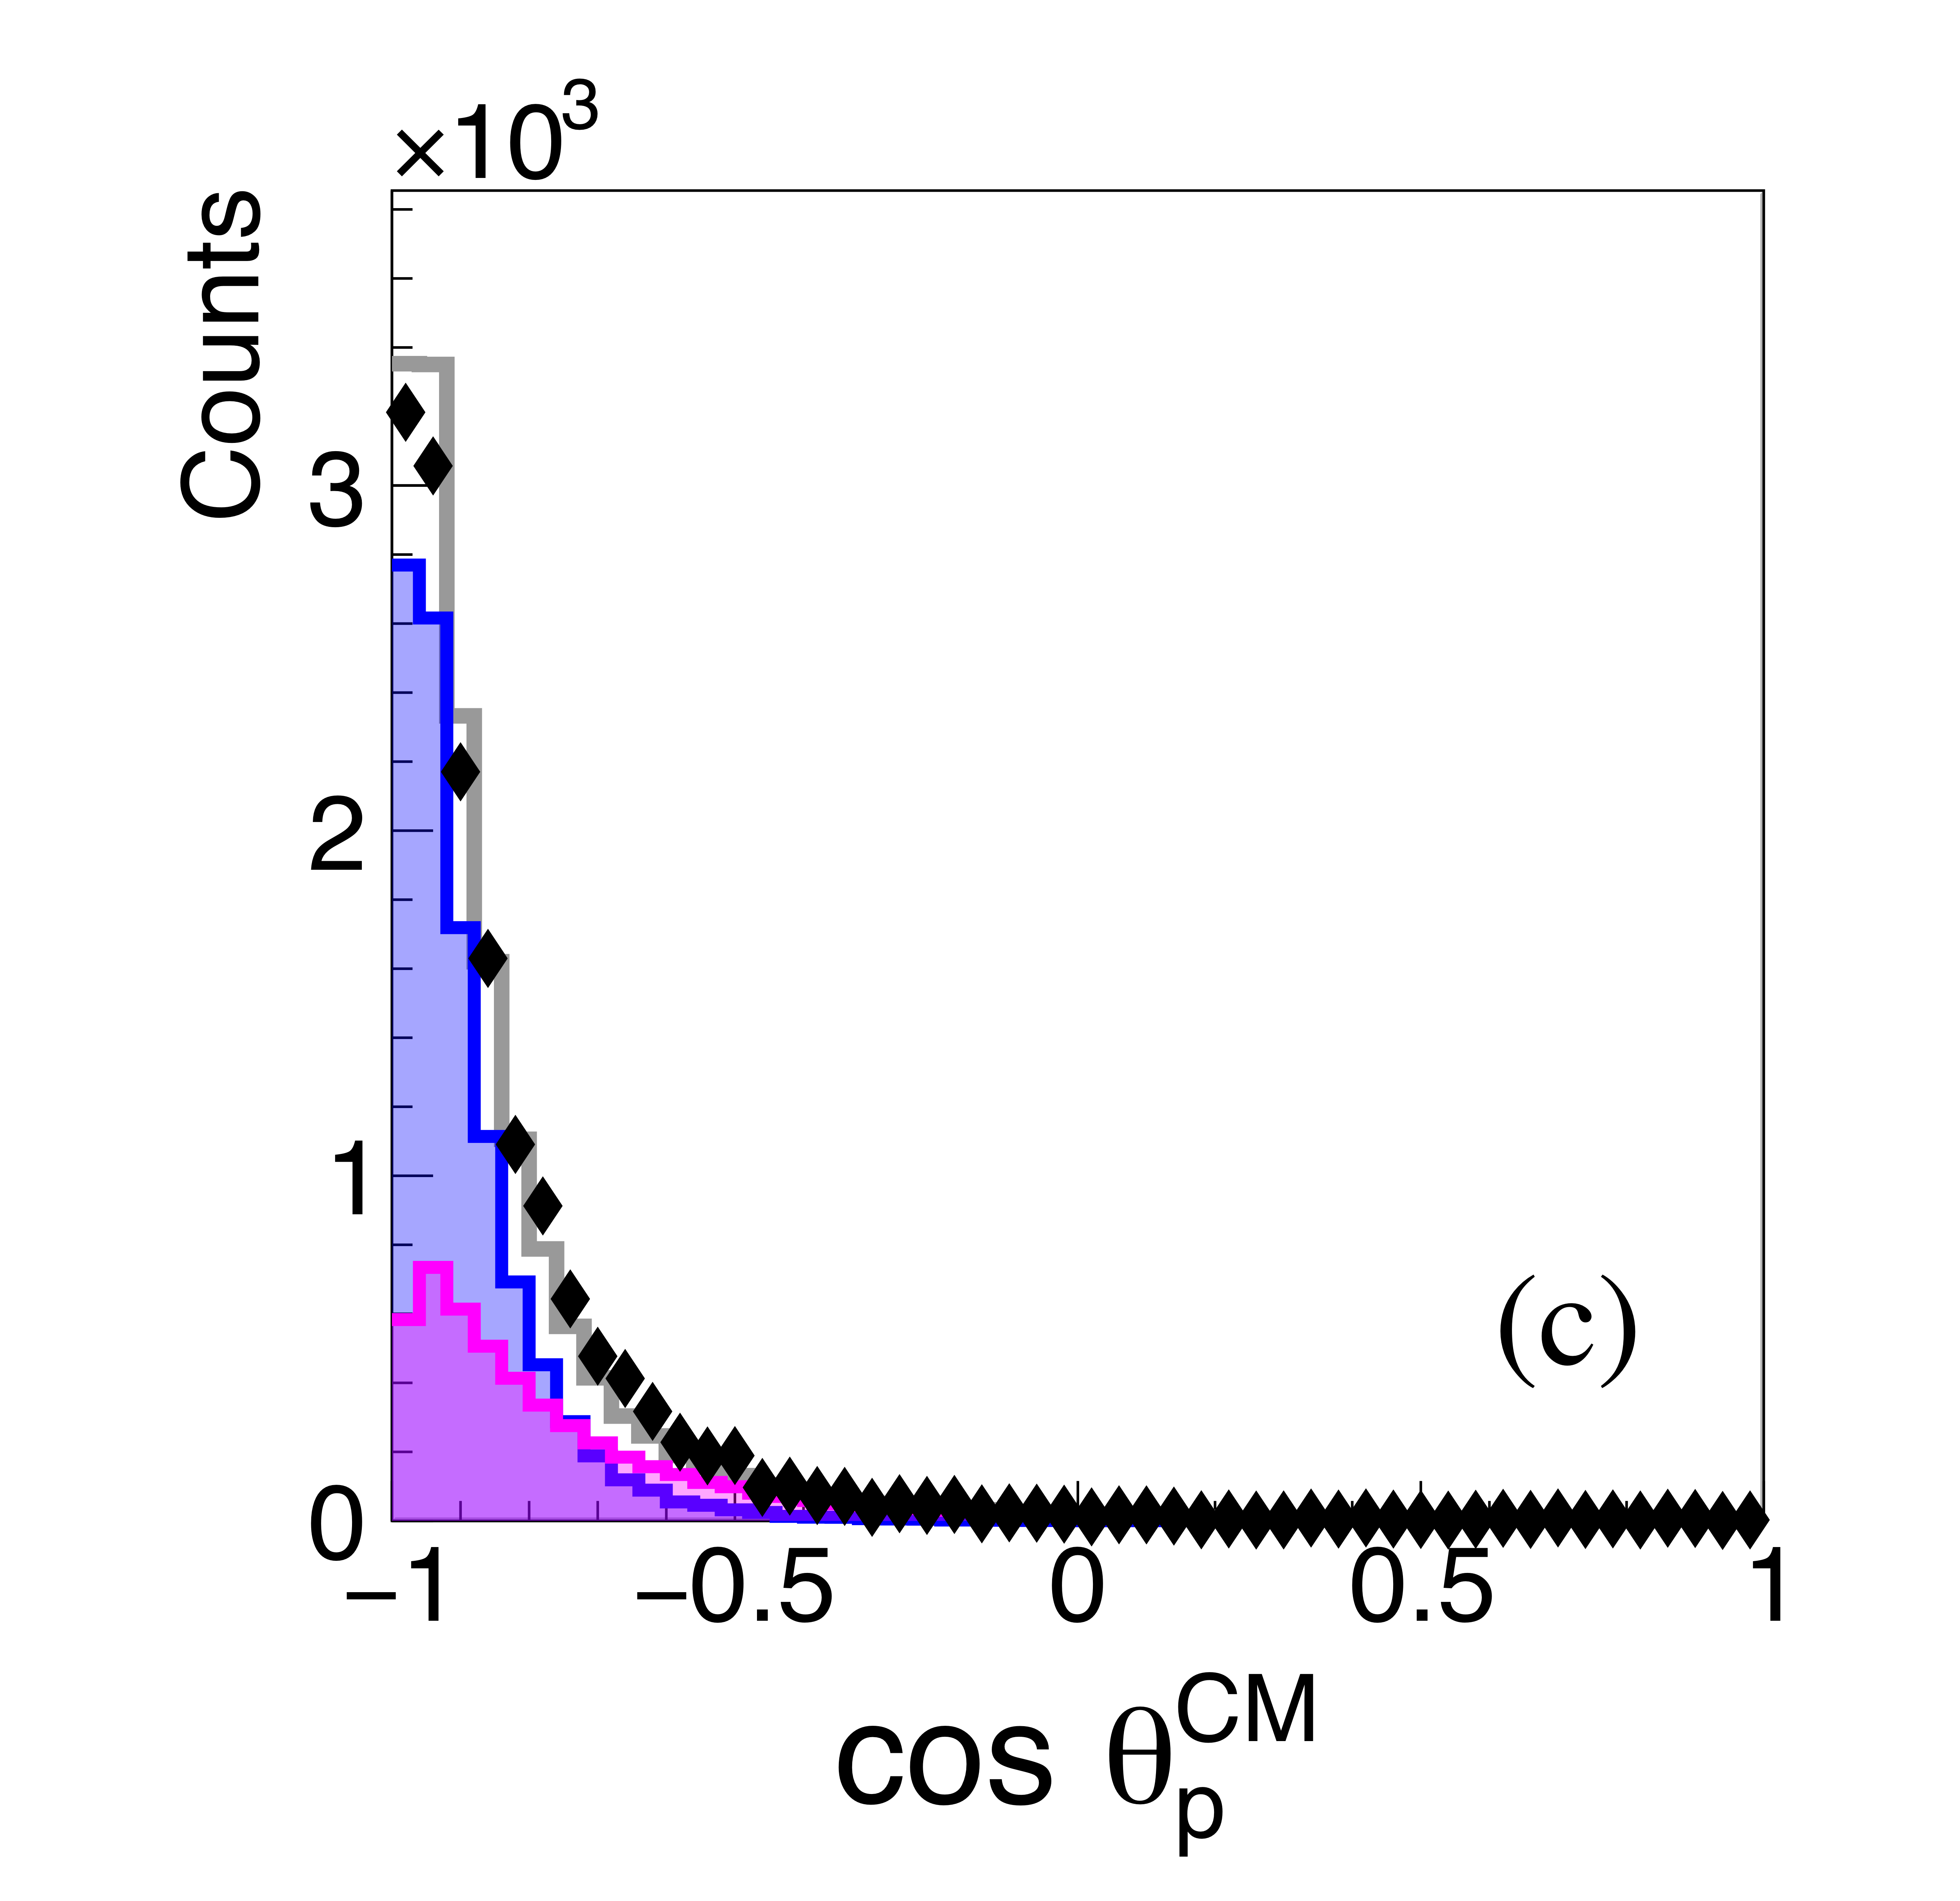
Figure 7c:
The angular distributions of the two protons (a), (c), and the anti-proton (b) in the $\gamma p \rightarrow p \bar{p} p $ reaction in the overall CM frame. Not acceptance corrected. The data are shown as black points and the summed simulation fit as a gray histogram. Components of the Monte Carlo simulations are shown as, Single Exchange (blue filled), Double Exchange-I (magenta filled), Double Exchange-II (green filled). |
Phys. Rev. C113 (2026) 4, 045207: downloads png pdf |
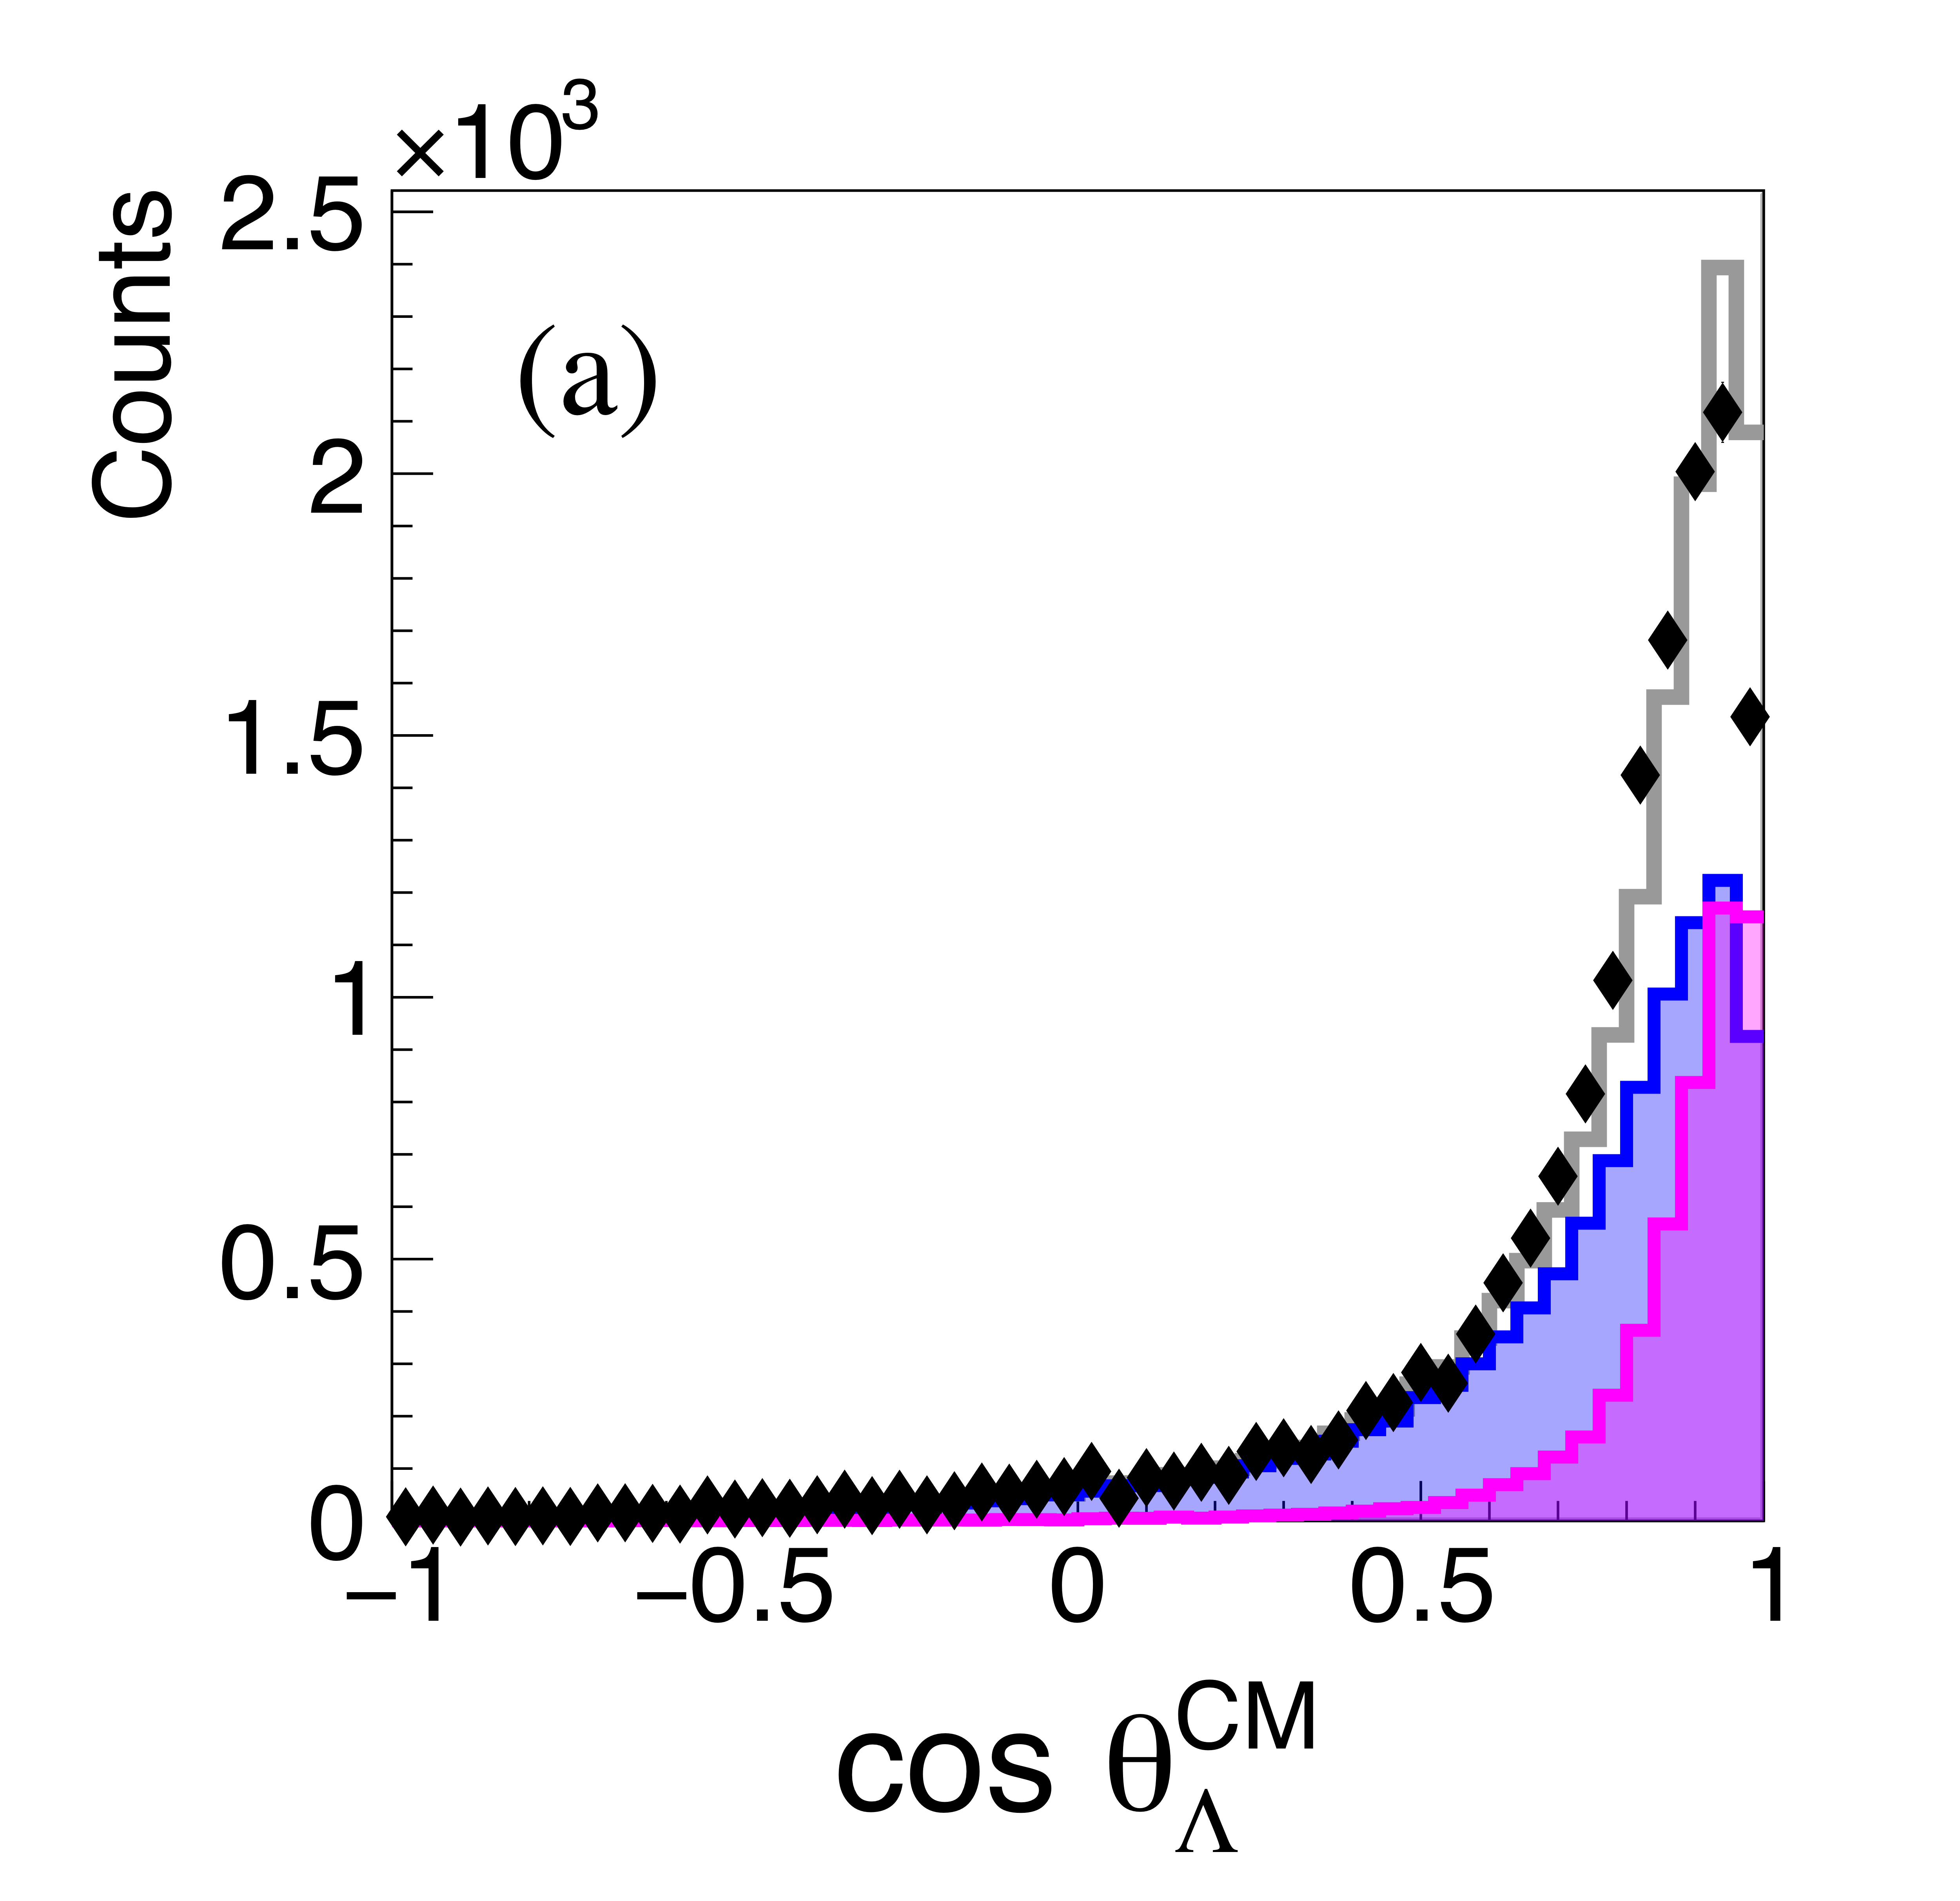
Figure 8a:
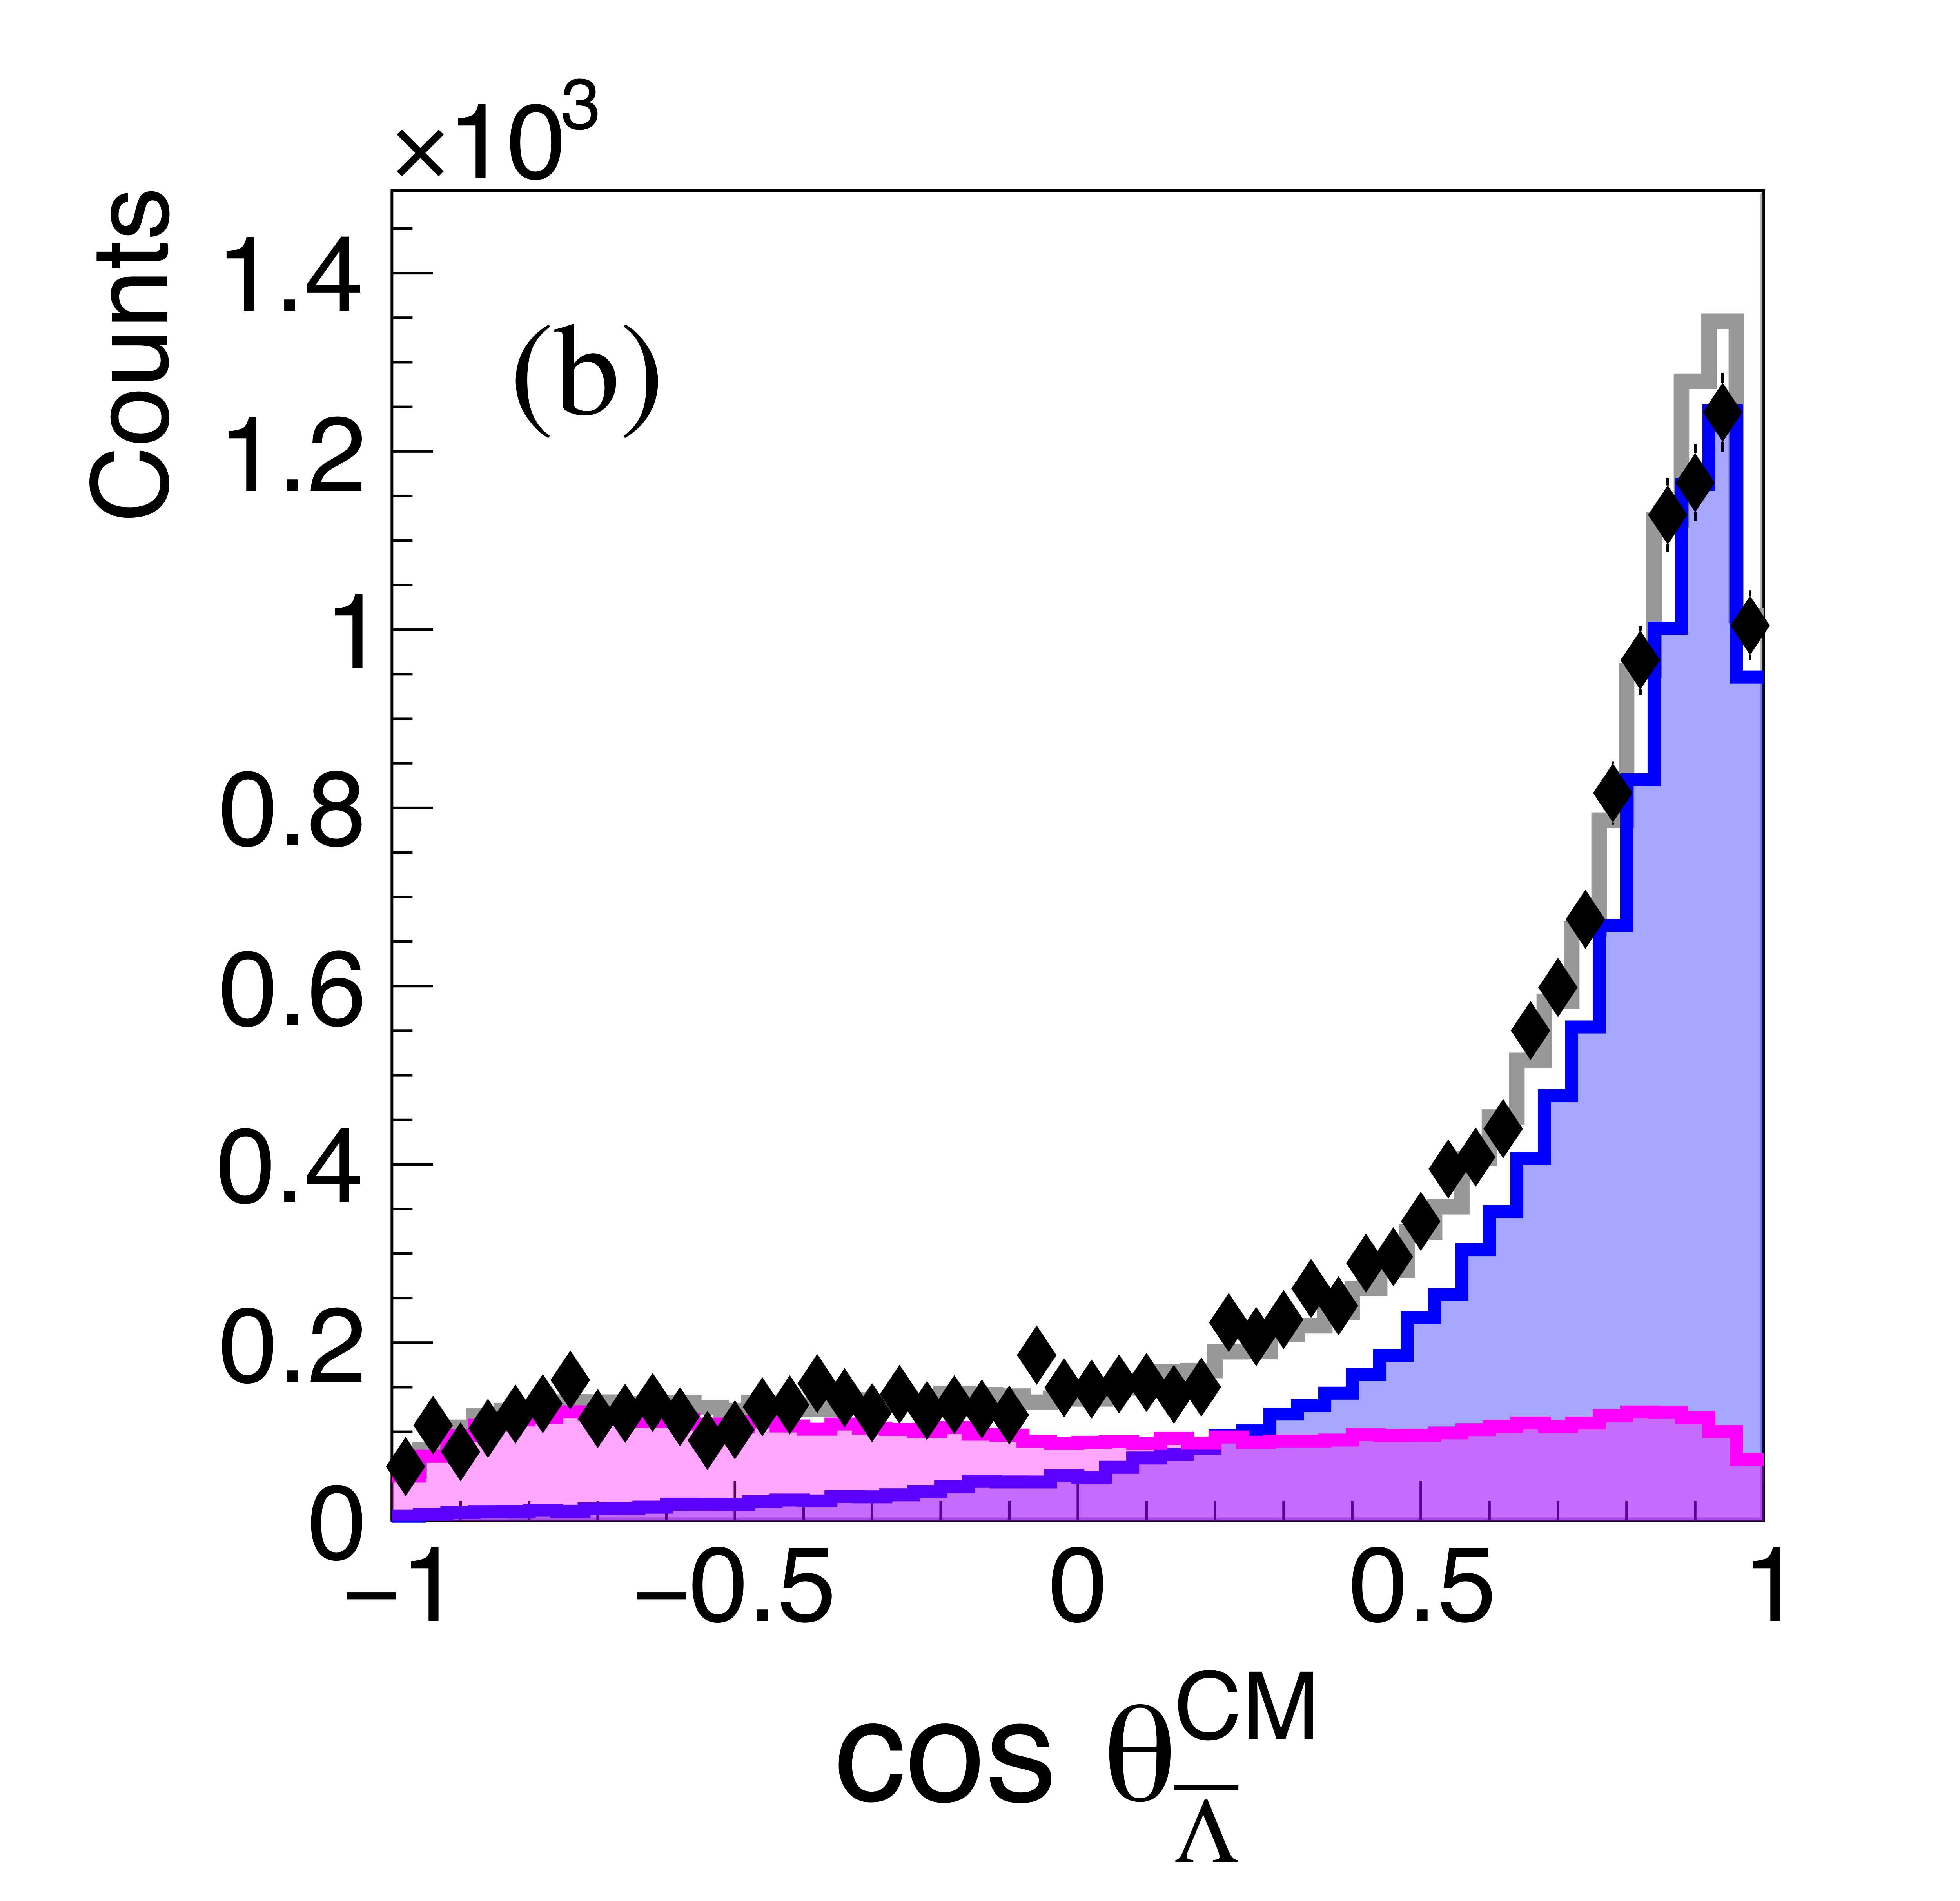
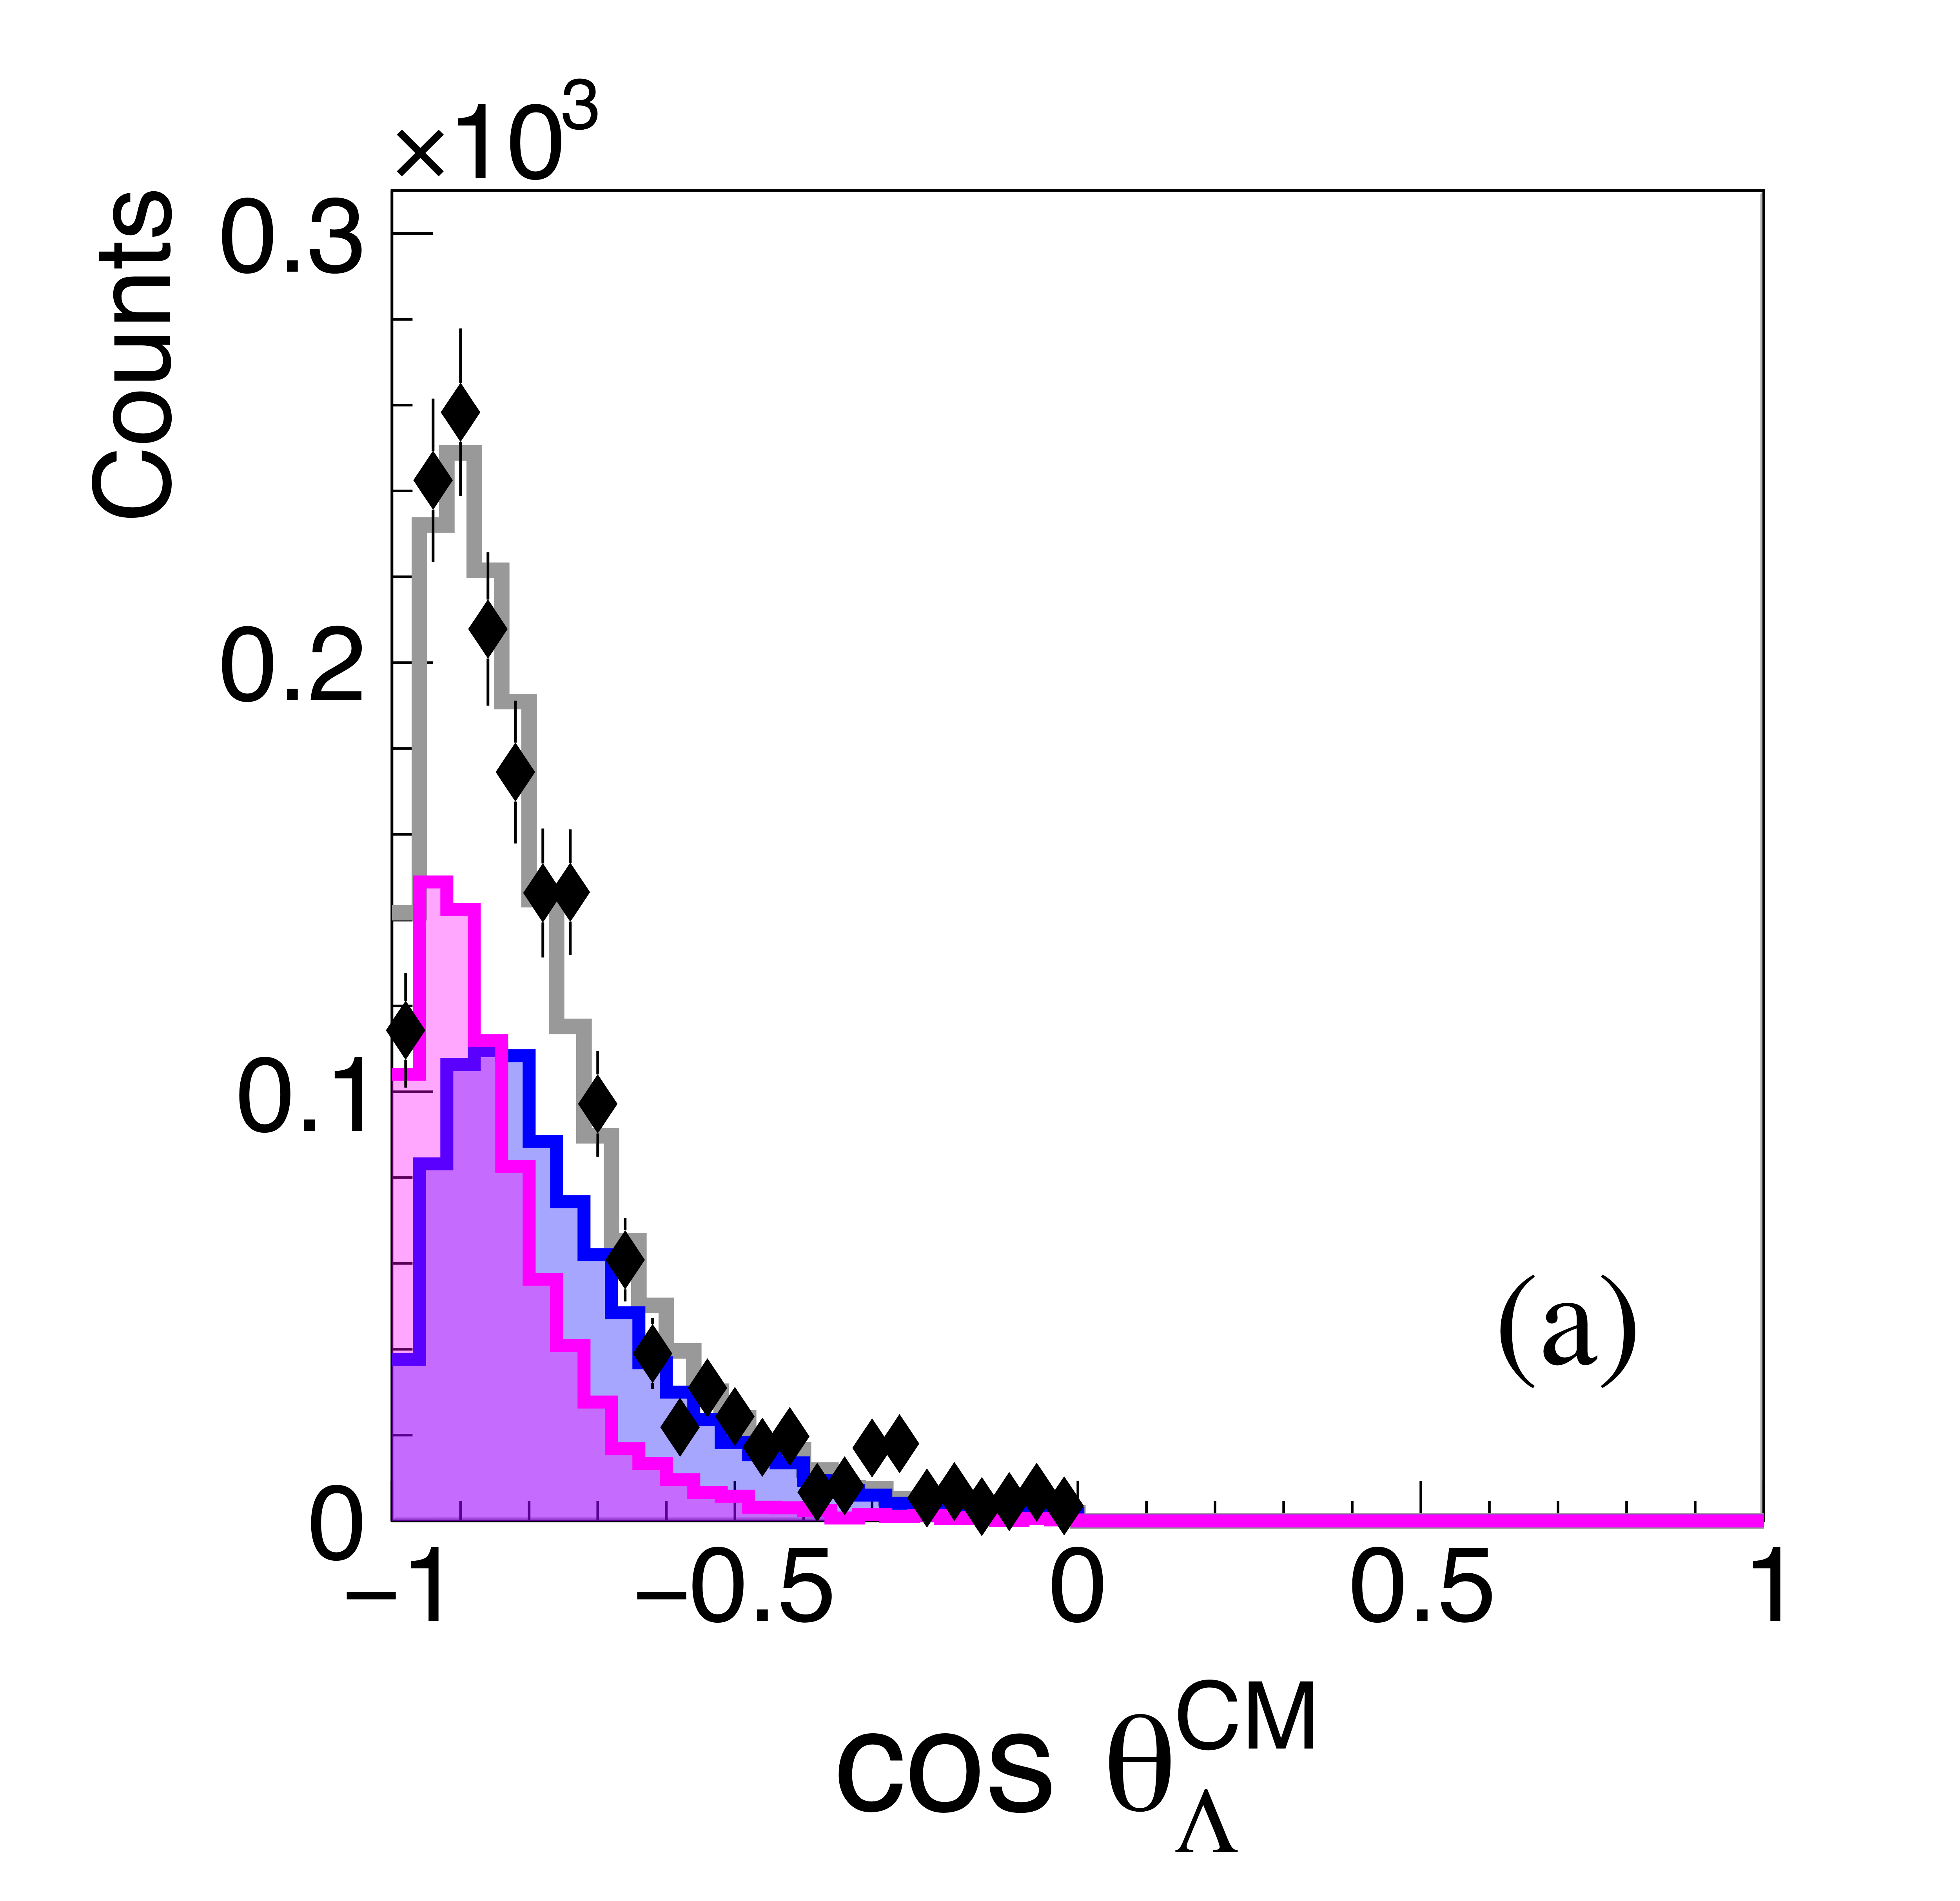
The angular distributions of the three particles in the $\gamma p \rightarrow \{ \Lambda \bar{\Lambda} \} p $ reaction channel in the overall CM system. The points and curves are organized as in Fig. 7. Unlike the proton reaction shown in Fig. 7, only one Double Exchange component is needed in the hyperon cases (magenta filled). |
Phys. Rev. C113 (2026) 4, 045207: downloads png pdf |
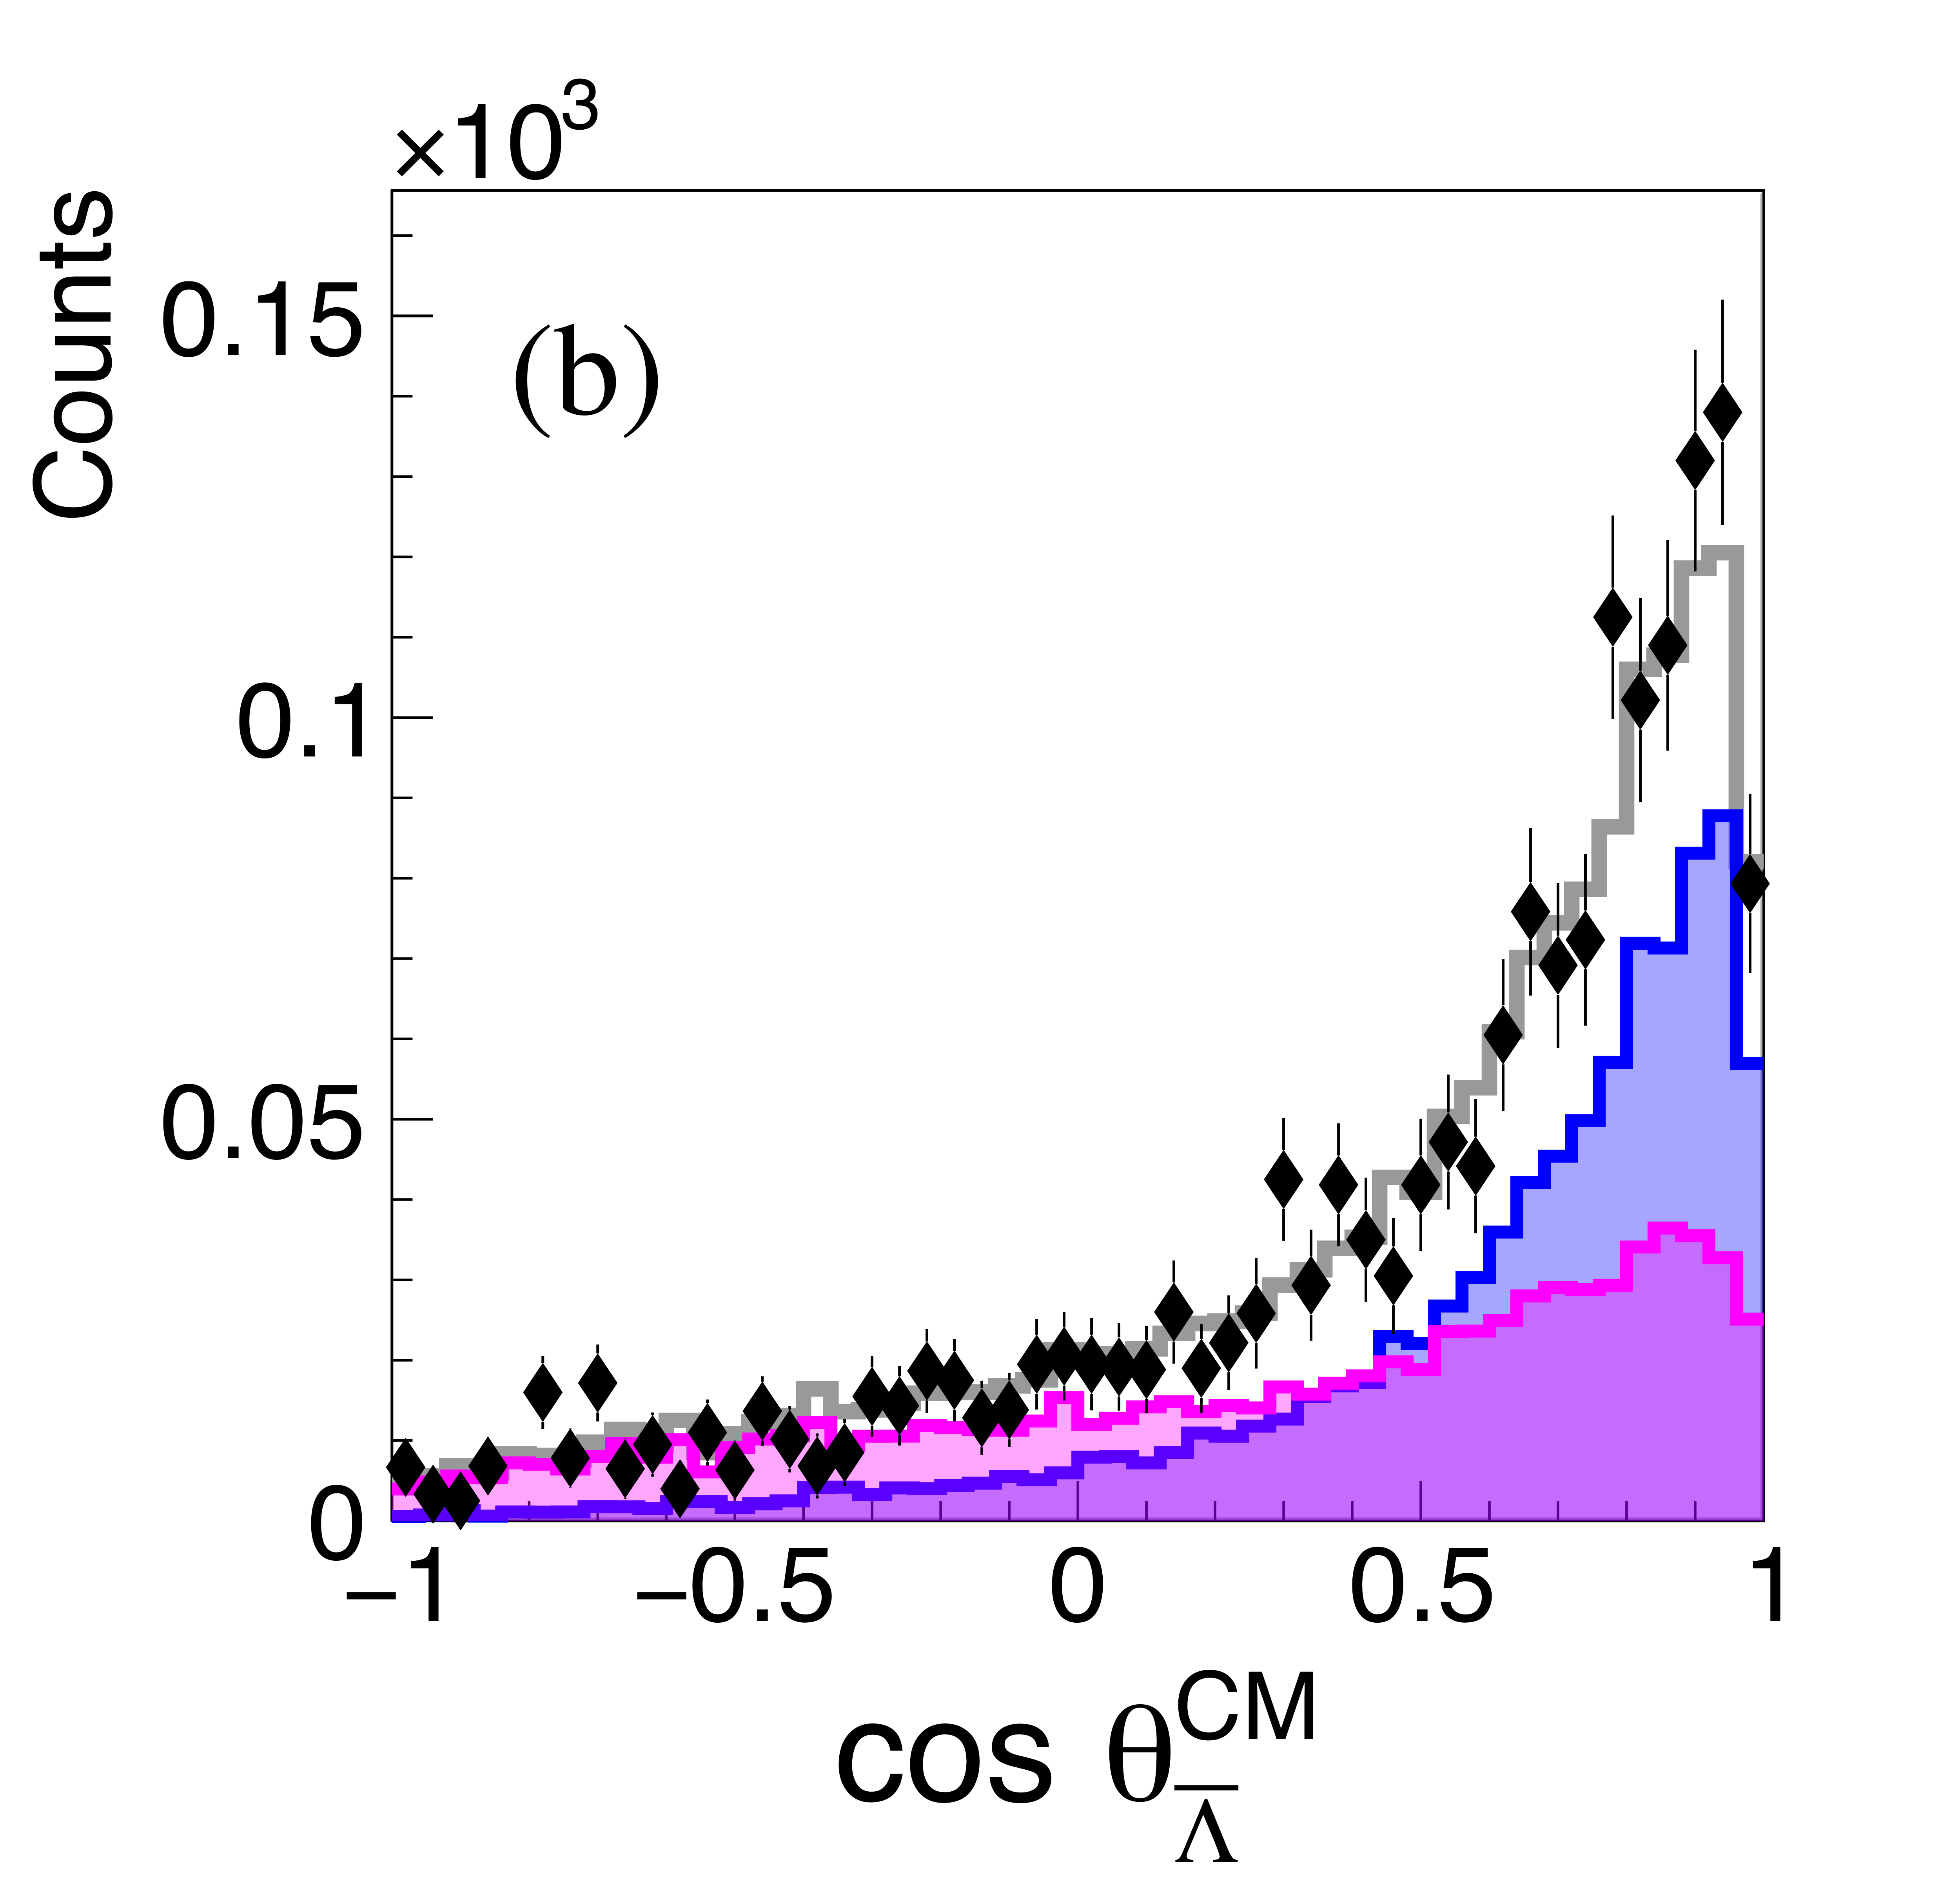
Figure 8b:
The angular distributions of the three particles in the $\gamma p \rightarrow \{ \Lambda \bar{\Lambda} \} p $ reaction channel in the overall CM system. The points and curves are organized as in Fig. 7. Unlike the proton reaction shown in Fig. 7, only one Double Exchange component is needed in the hyperon cases (magenta filled). |
Phys. Rev. C113 (2026) 4, 045207: downloads png pdf |
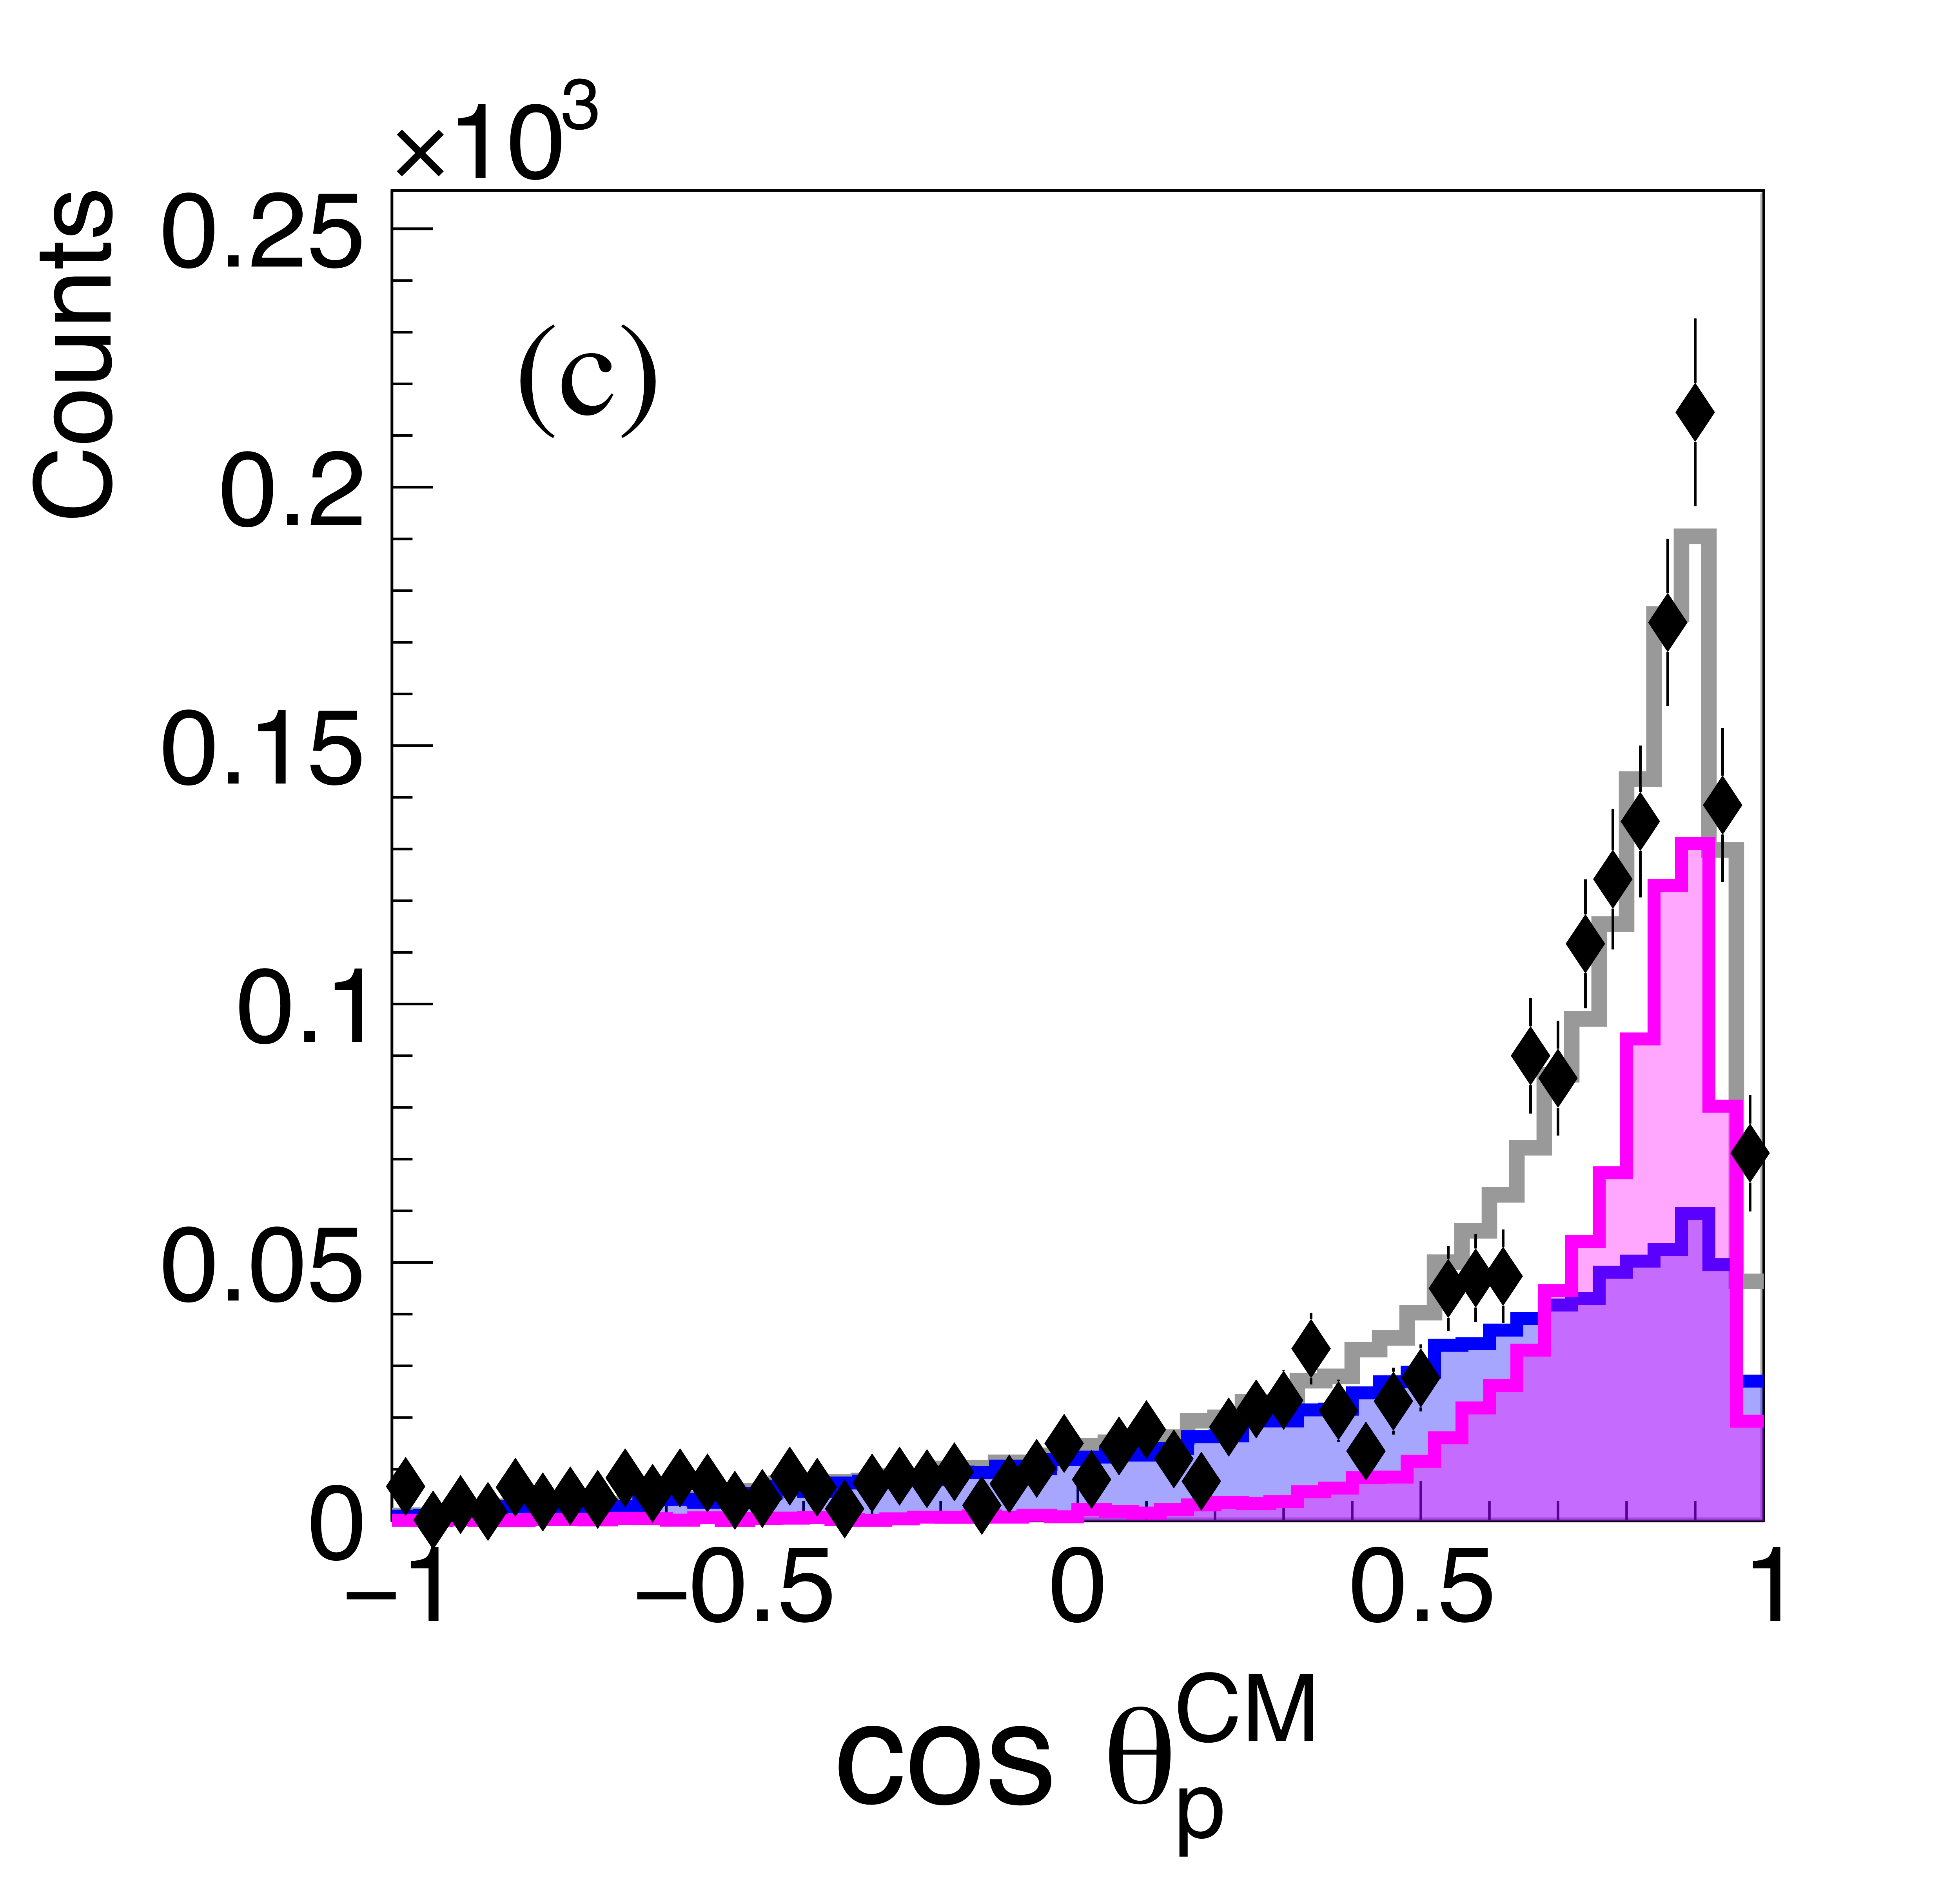
Figure 8c:
The angular distributions of the three particles in the $\gamma p \rightarrow \{ \Lambda \bar{\Lambda} \} p $ reaction channel in the overall CM system. The points and curves are organized as in Fig. 7. Unlike the proton reaction shown in Fig. 7, only one Double Exchange component is needed in the hyperon cases (magenta filled). |
Phys. Rev. C113 (2026) 4, 045207: downloads png pdf |
Figure 9a:
The angular distributions of the three particles in the $\gamma p \rightarrow \{ \bar{\Lambda} p \} \Lambda $ reaction channel in the overall CM system. The points and curves are organized as in Figs. 7 and 8, but note that the roles of the proton and the $\Lambda$ are reversed when compared to Fig. 8 in this reaction; see text. |
Phys. Rev. C113 (2026) 4, 045207: downloads png pdf |
Figure 9b:
The angular distributions of the three particles in the $\gamma p \rightarrow \{ \bar{\Lambda} p \} \Lambda $ reaction channel in the overall CM system. The points and curves are organized as in Figs. 7 and 8, but note that the roles of the proton and the $\Lambda$ are reversed when compared to Fig. 8 in this reaction; see text. |
Phys. Rev. C113 (2026) 4, 045207: downloads png pdf |
Figure 9c:
The angular distributions of the three particles in the $\gamma p \rightarrow \{ \bar{\Lambda} p \} \Lambda $ reaction channel in the overall CM system. The points and curves are organized as in Figs. 7 and 8, but note that the roles of the proton and the $\Lambda$ are reversed when compared to Fig. 8 in this reaction; see text. |
Phys. Rev. C113 (2026) 4, 045207: downloads png pdf |
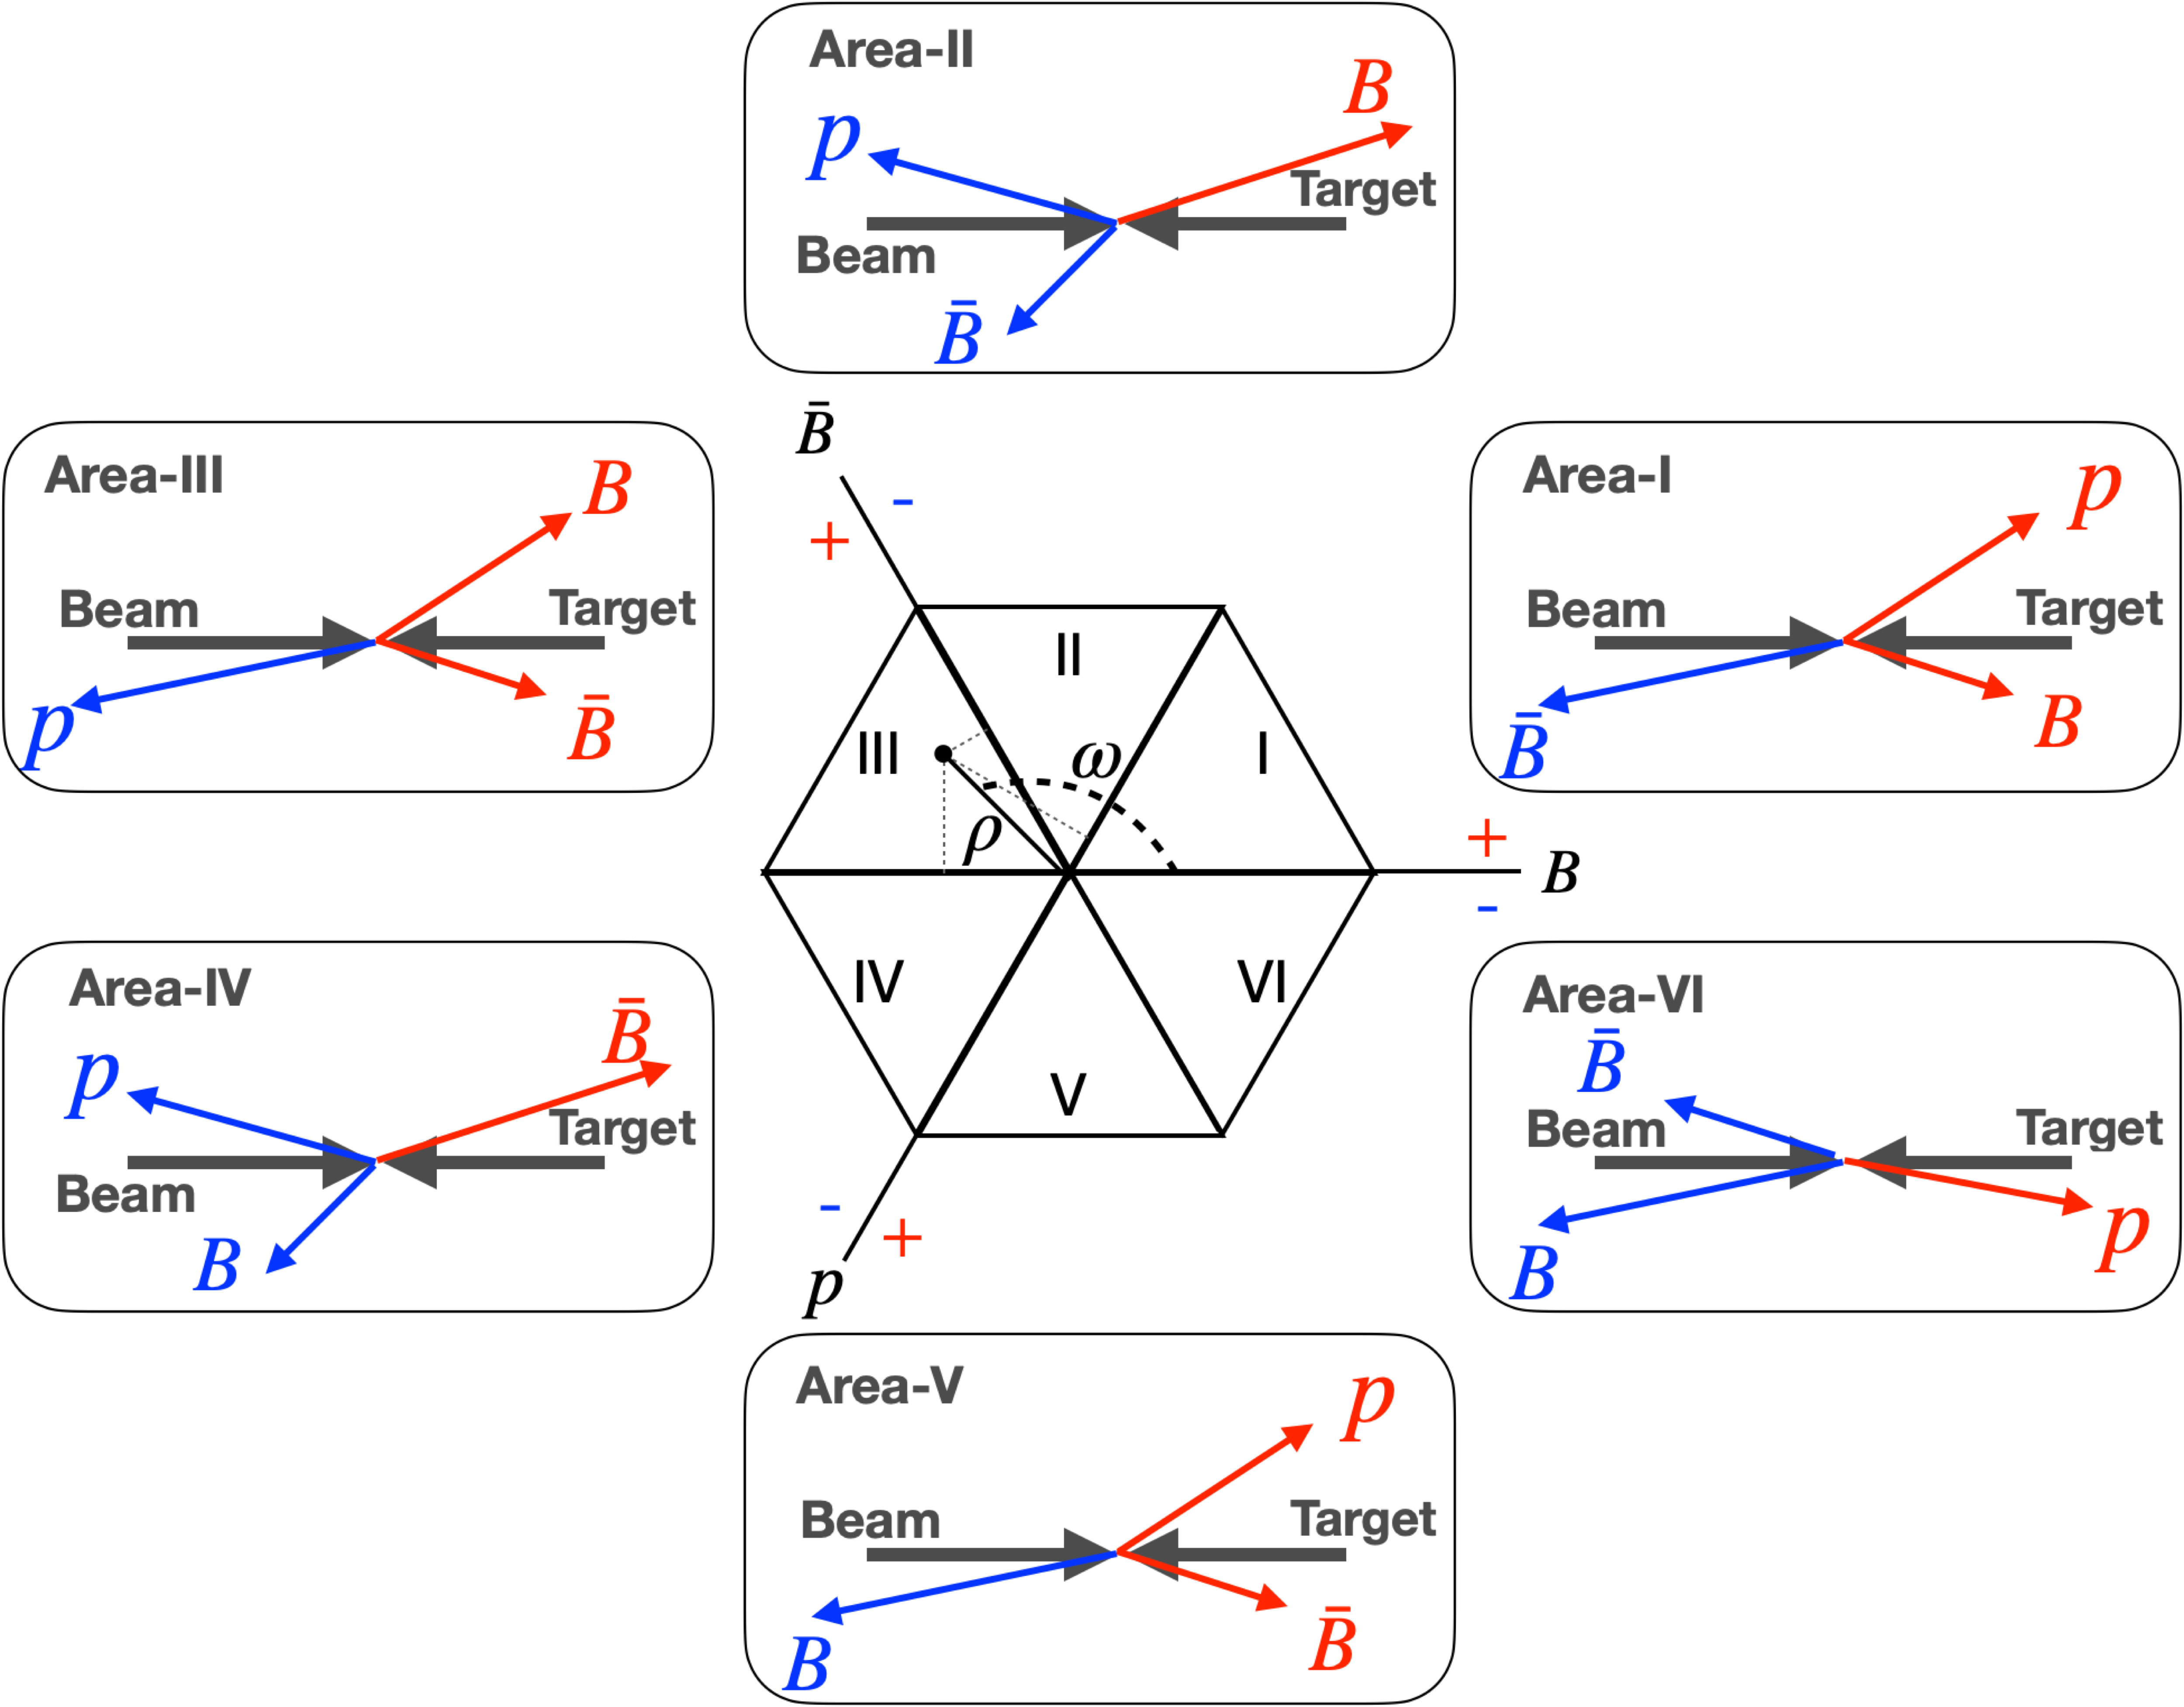
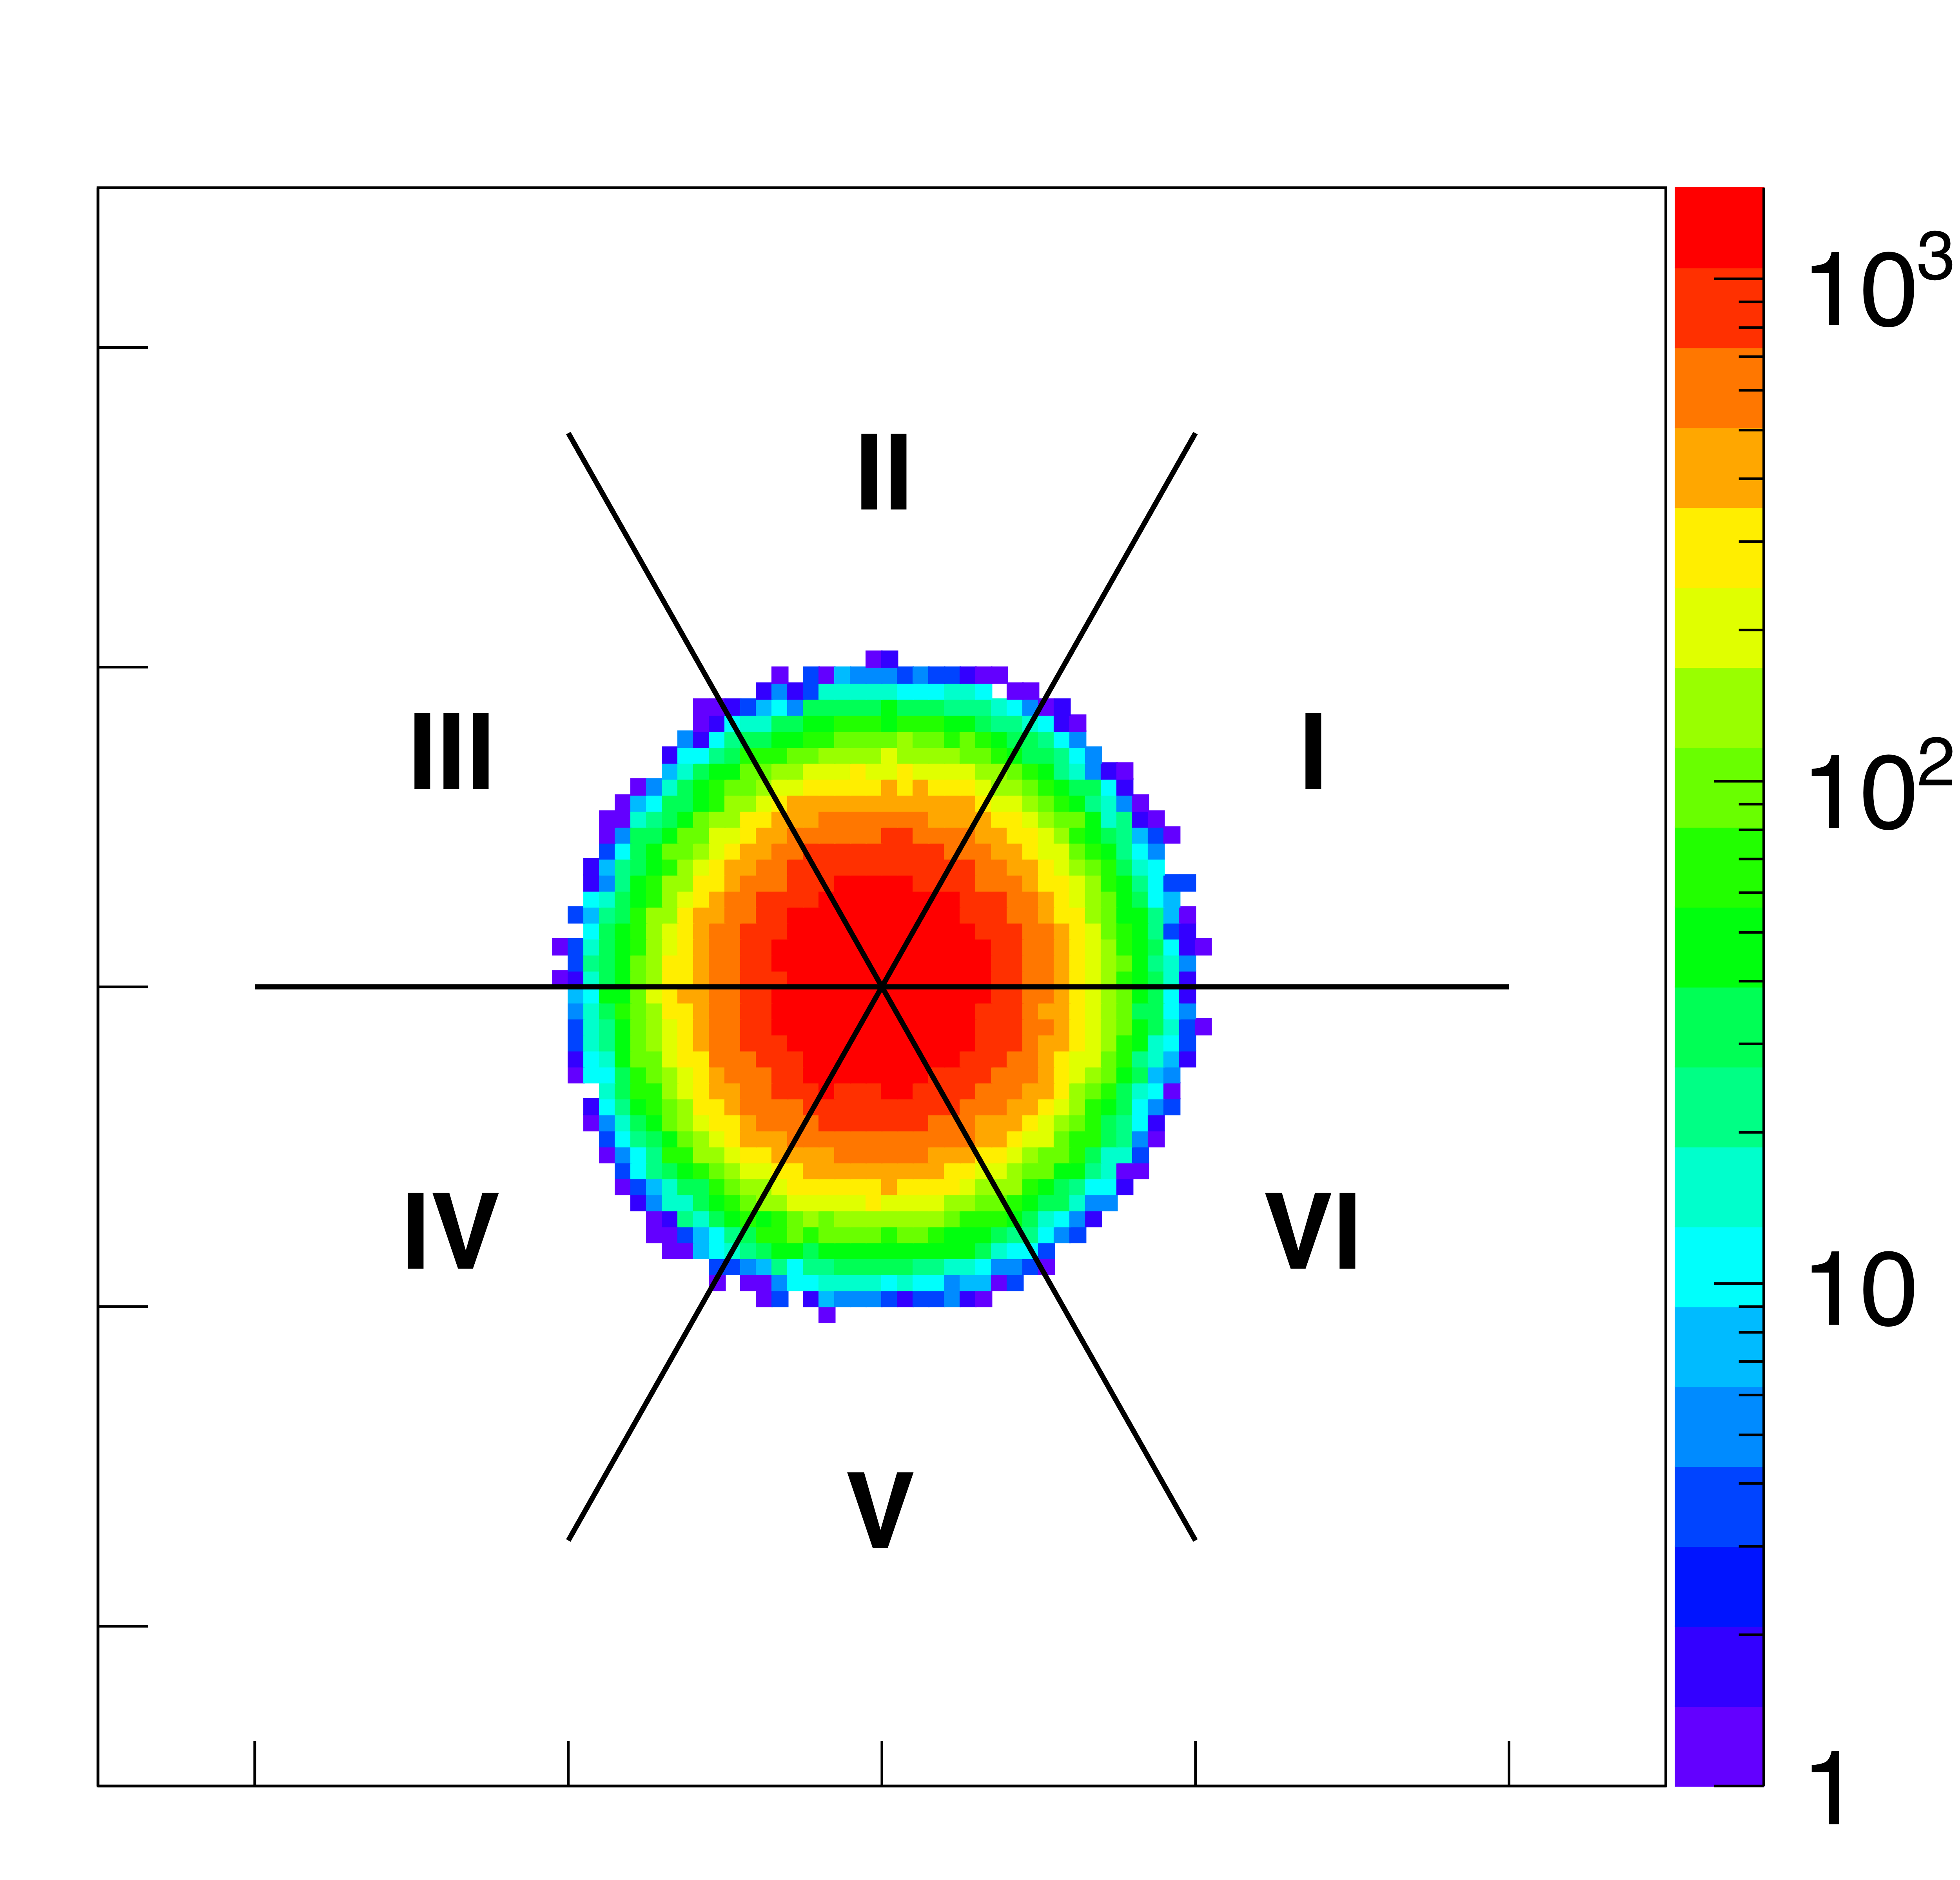
Figure 10:
The six sectors on a Van Hove diagram that differentiate three-body angular correlations in six separate kinematic regions in the CM frame, as depicted in the pictures located around the center and marked by Roman numerals. See text for explanation. |
Phys. Rev. C113 (2026) 4, 045207: downloads png pdf |
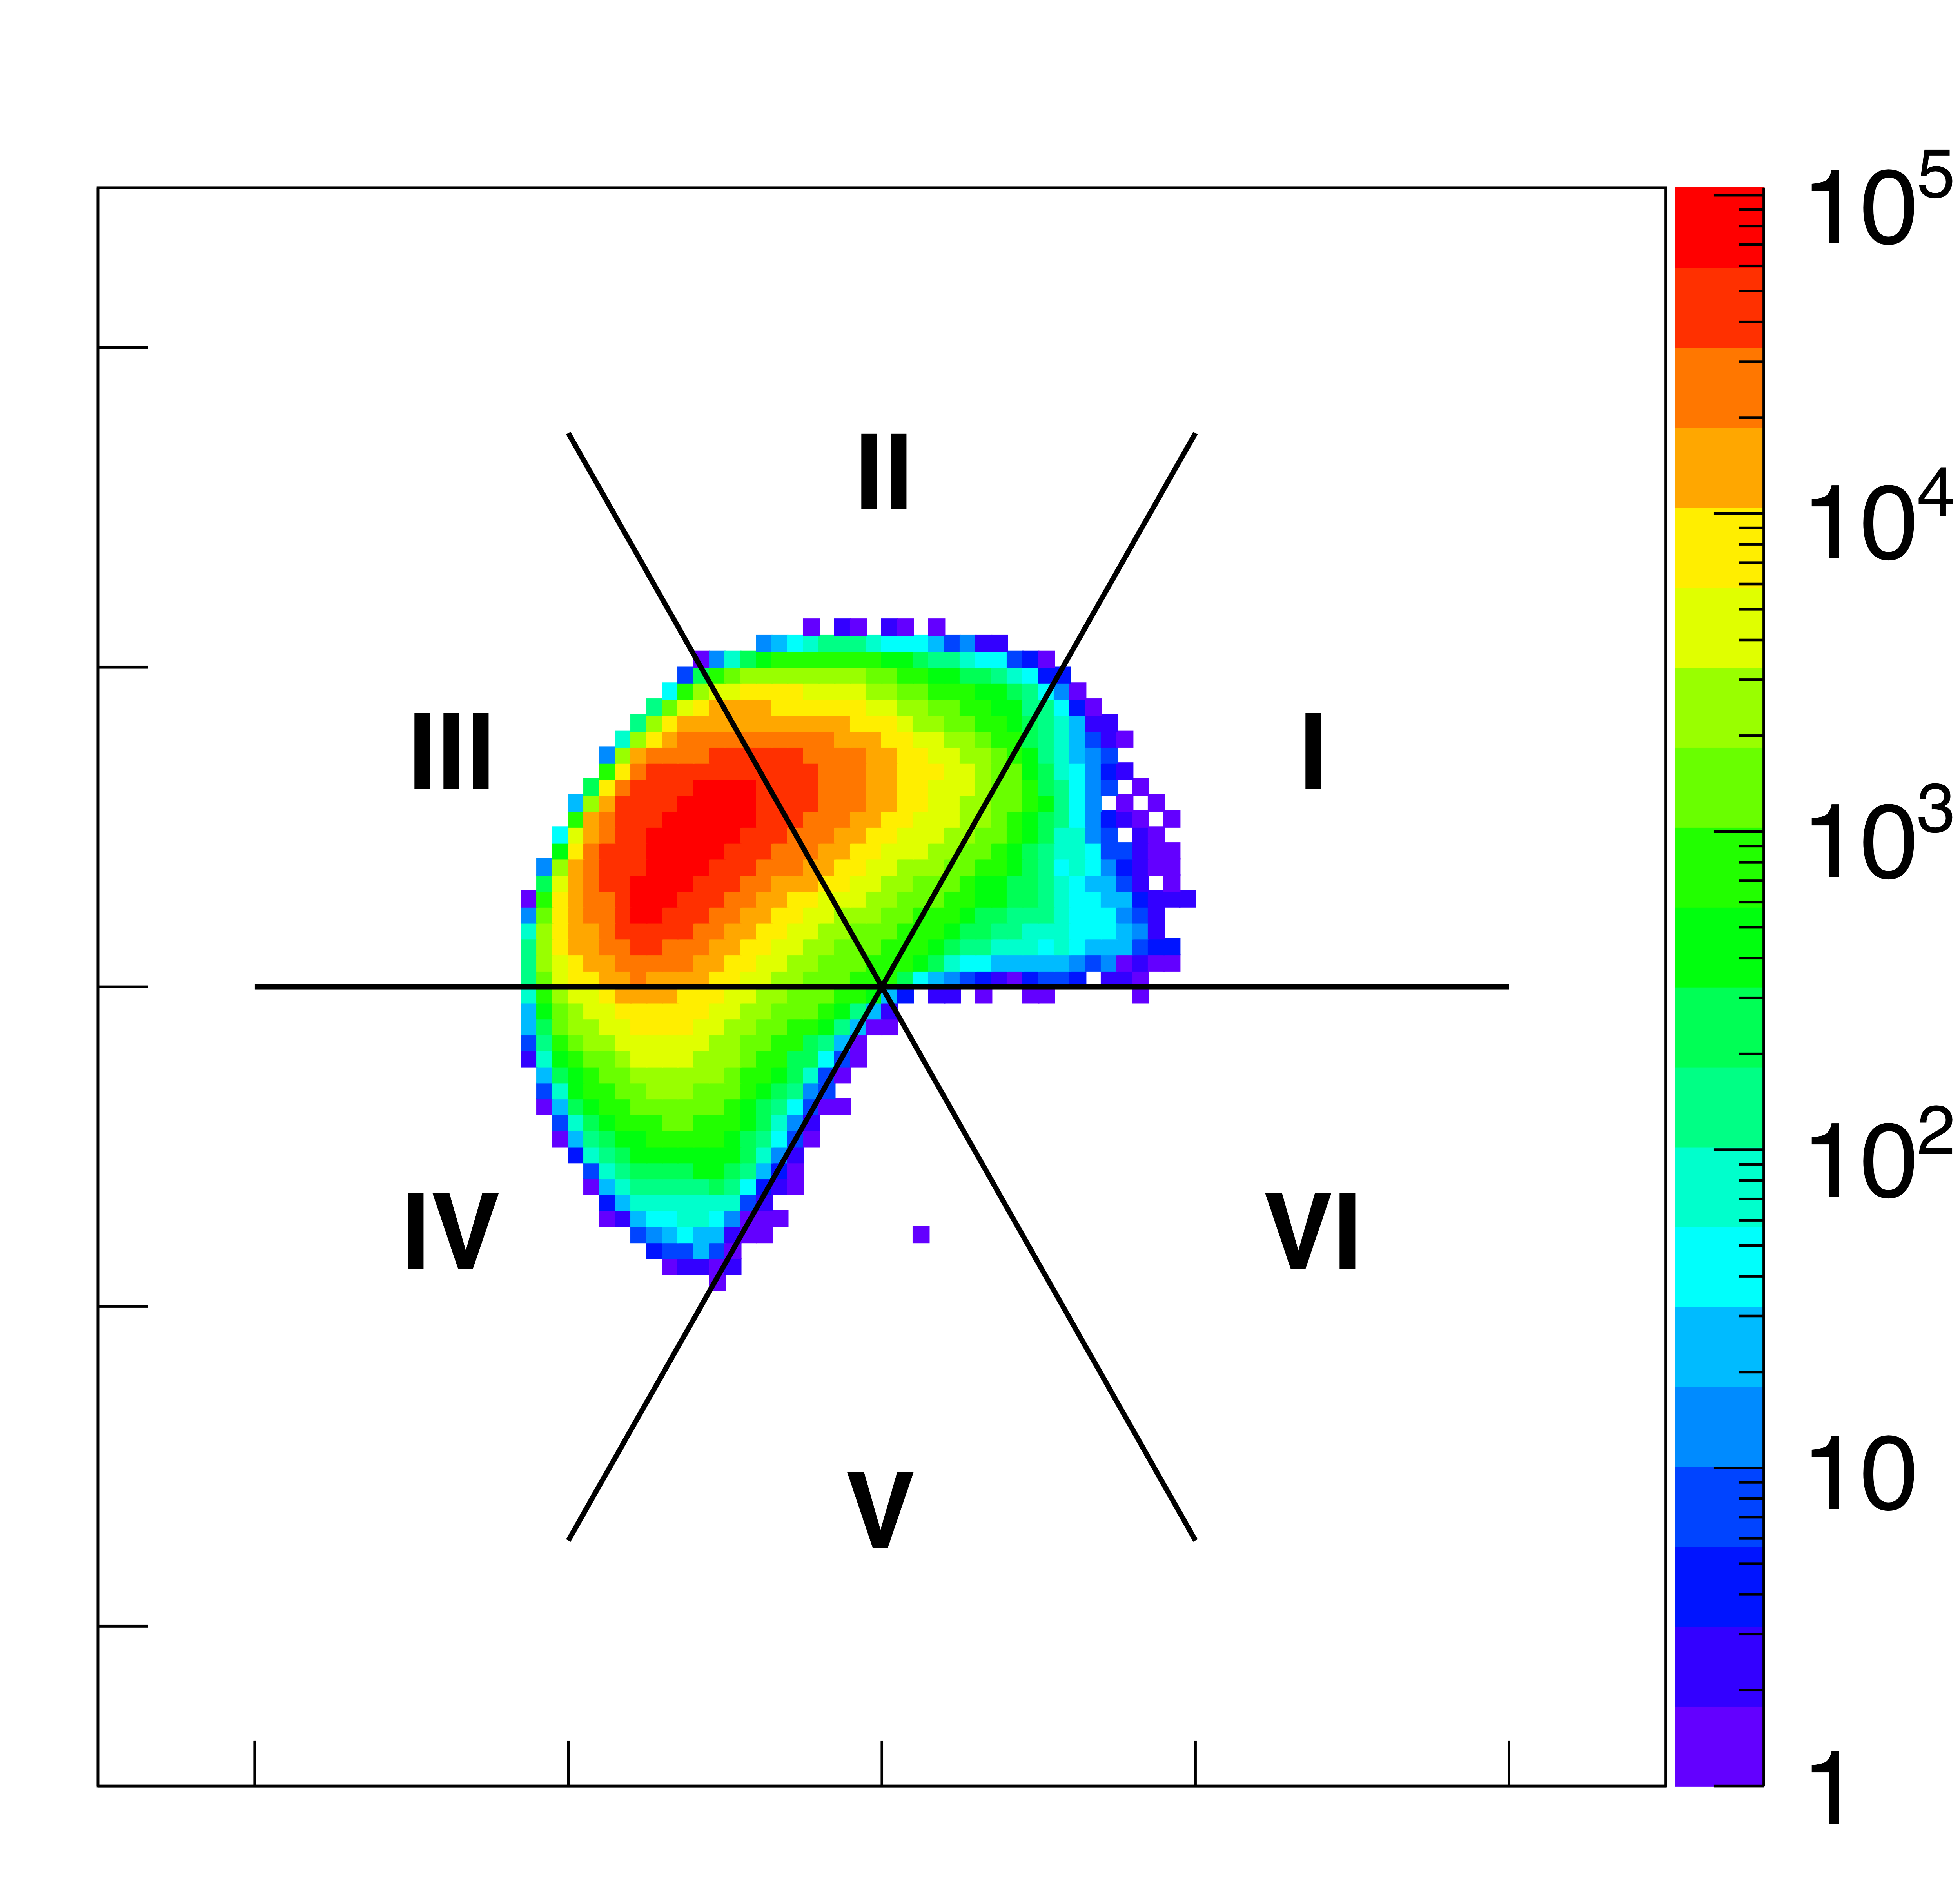
Figure 11a:
Van Hove plots of the three-body final states, (a) Data from the $p\bar{p}p$ reaction, with Areas V and VI empty due to proton sorting. (b) Phase space MC distribution for the $p\bar{p}p$ reaction. (c) Data from the $\Lambda \bar{\Lambda} p$ reactions in which each particle is unique. Two clusters of data indicate the kinematic separation of $\Lambda \bar{\Lambda}$ and $p \bar{\Lambda}$ creation. (d) Phase space MC for the $\Lambda \bar{\Lambda} p$ reaction. The data shown in (a), (c) are not acceptance corrected. |
Phys. Rev. C113 (2026) 4, 045207: downloads png pdf |
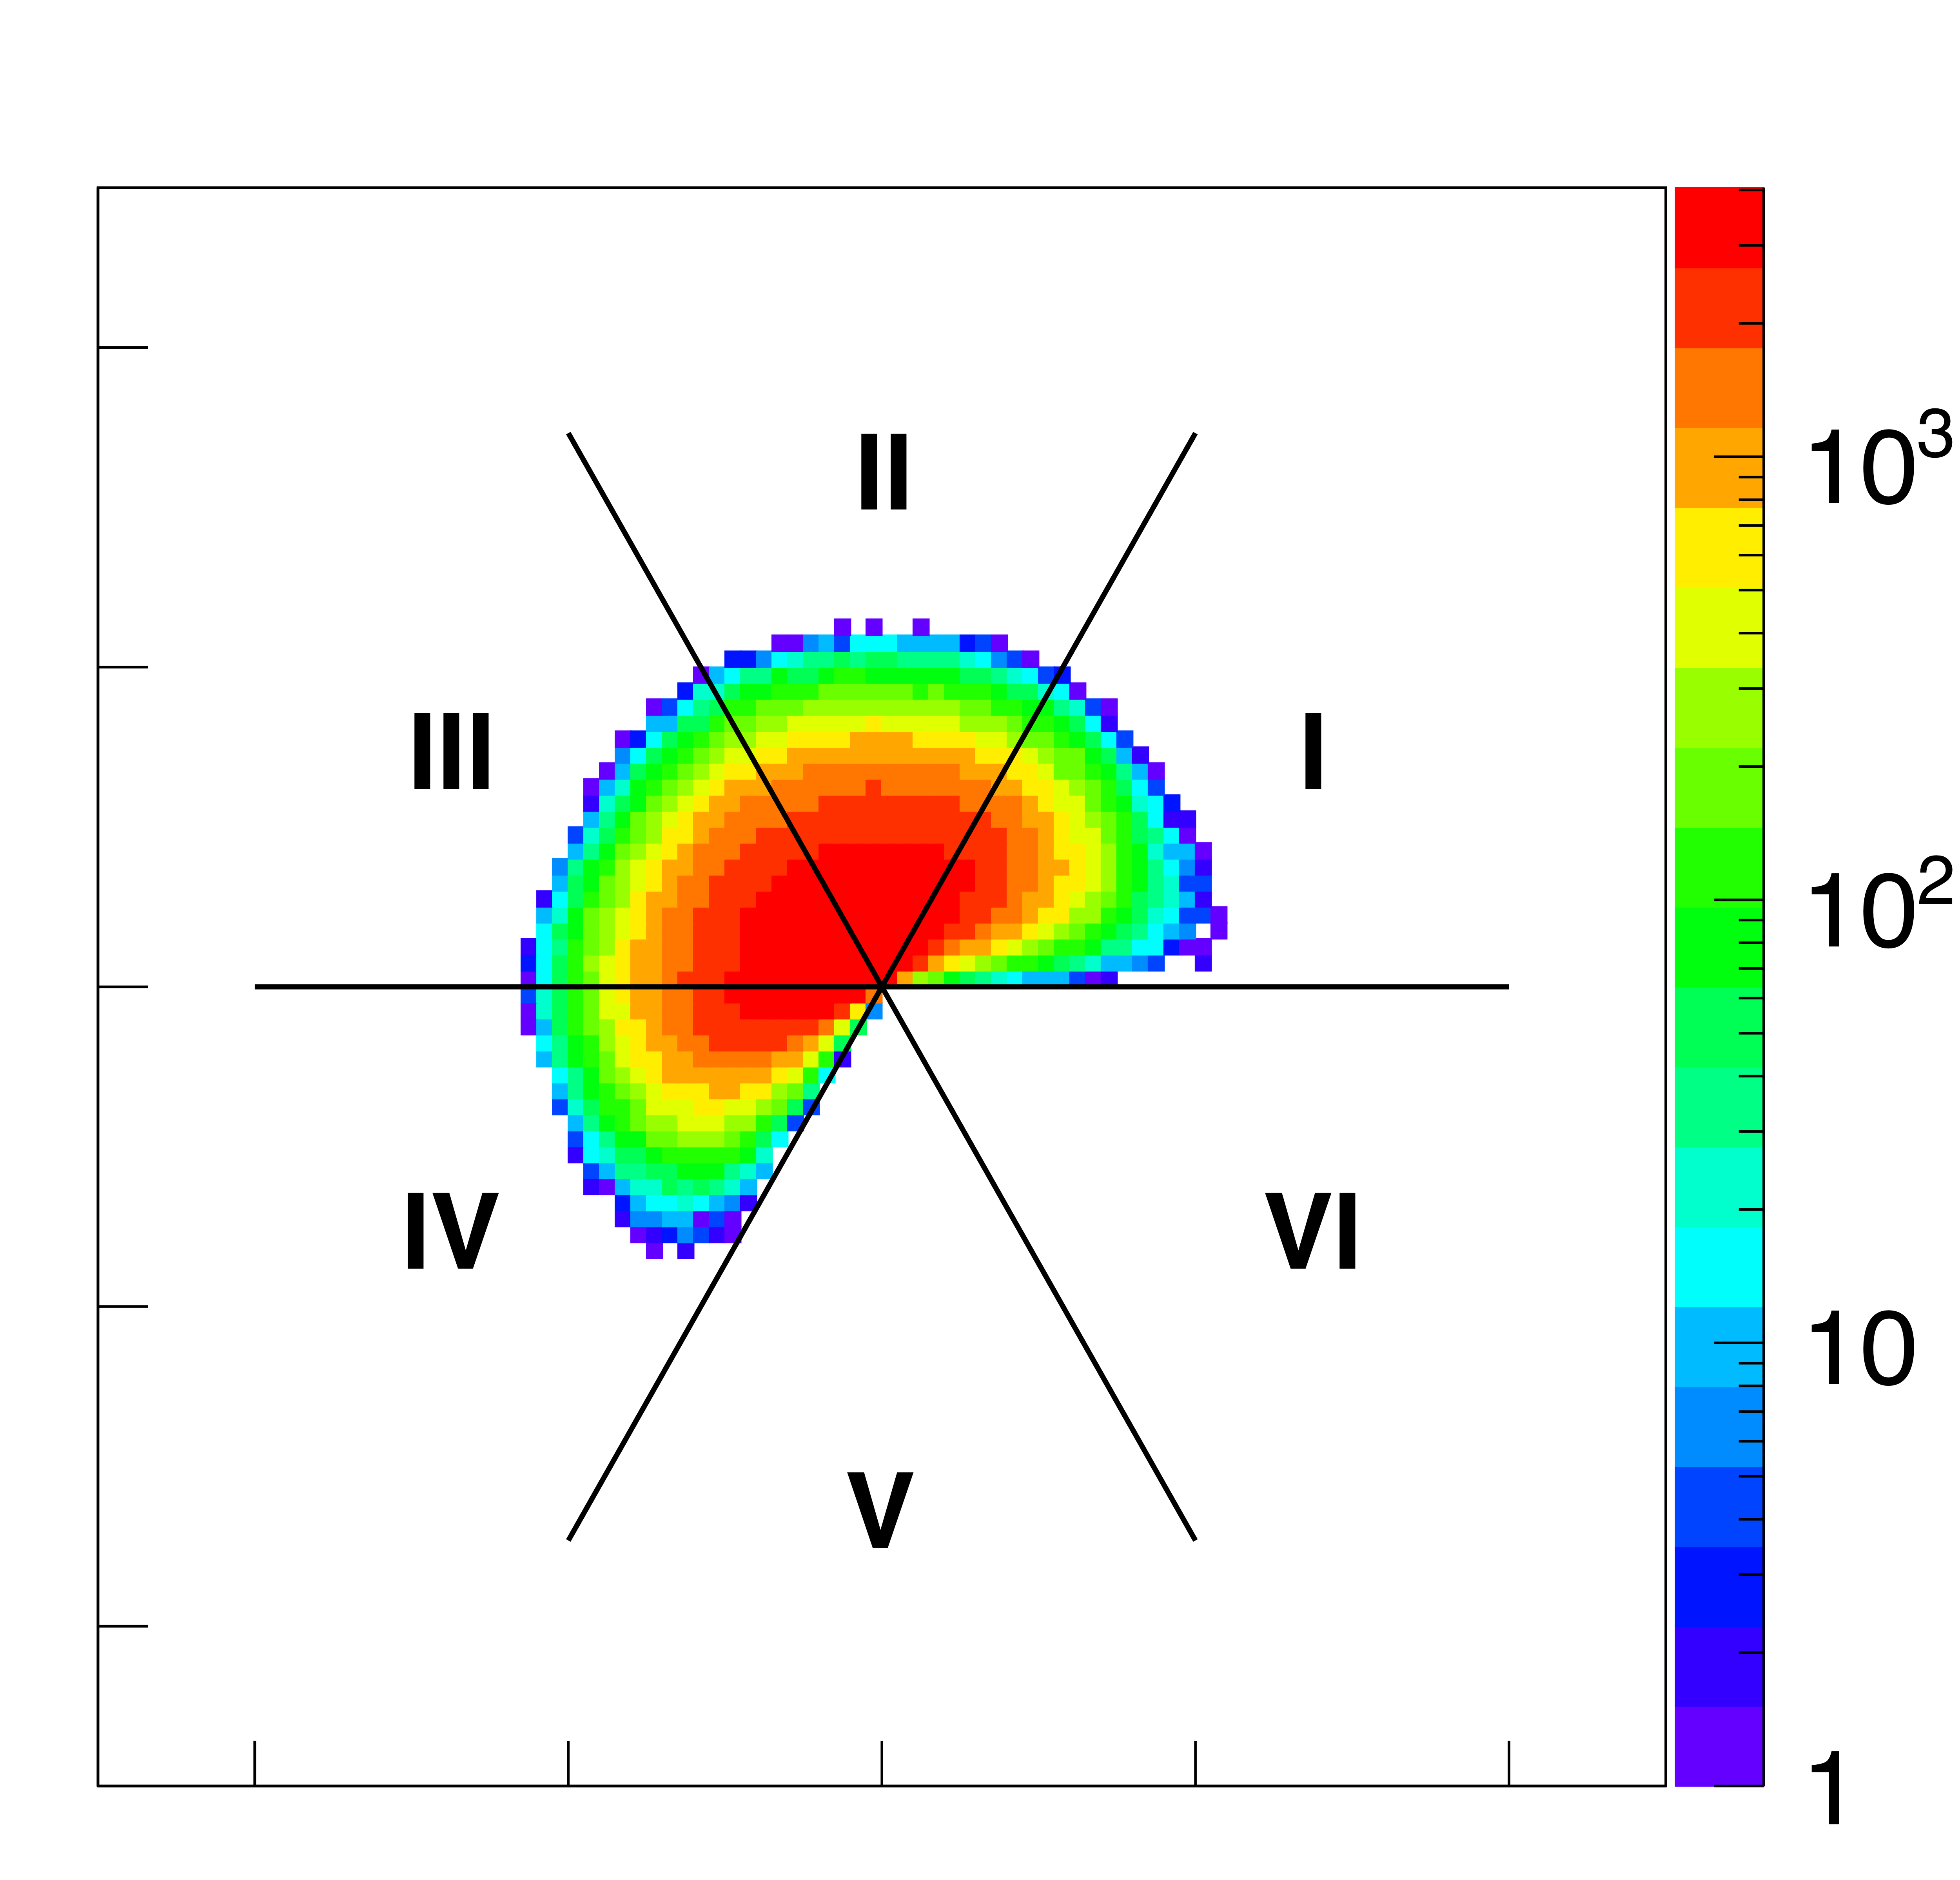
Figure 11b:
Van Hove plots of the three-body final states, (a) Data from the $p\bar{p}p$ reaction, with Areas V and VI empty due to proton sorting. (b) Phase space MC distribution for the $p\bar{p}p$ reaction. (c) Data from the $\Lambda \bar{\Lambda} p$ reactions in which each particle is unique. Two clusters of data indicate the kinematic separation of $\Lambda \bar{\Lambda}$ and $p \bar{\Lambda}$ creation. (d) Phase space MC for the $\Lambda \bar{\Lambda} p$ reaction. The data shown in (a), (c) are not acceptance corrected. |
Phys. Rev. C113 (2026) 4, 045207: downloads png pdf |
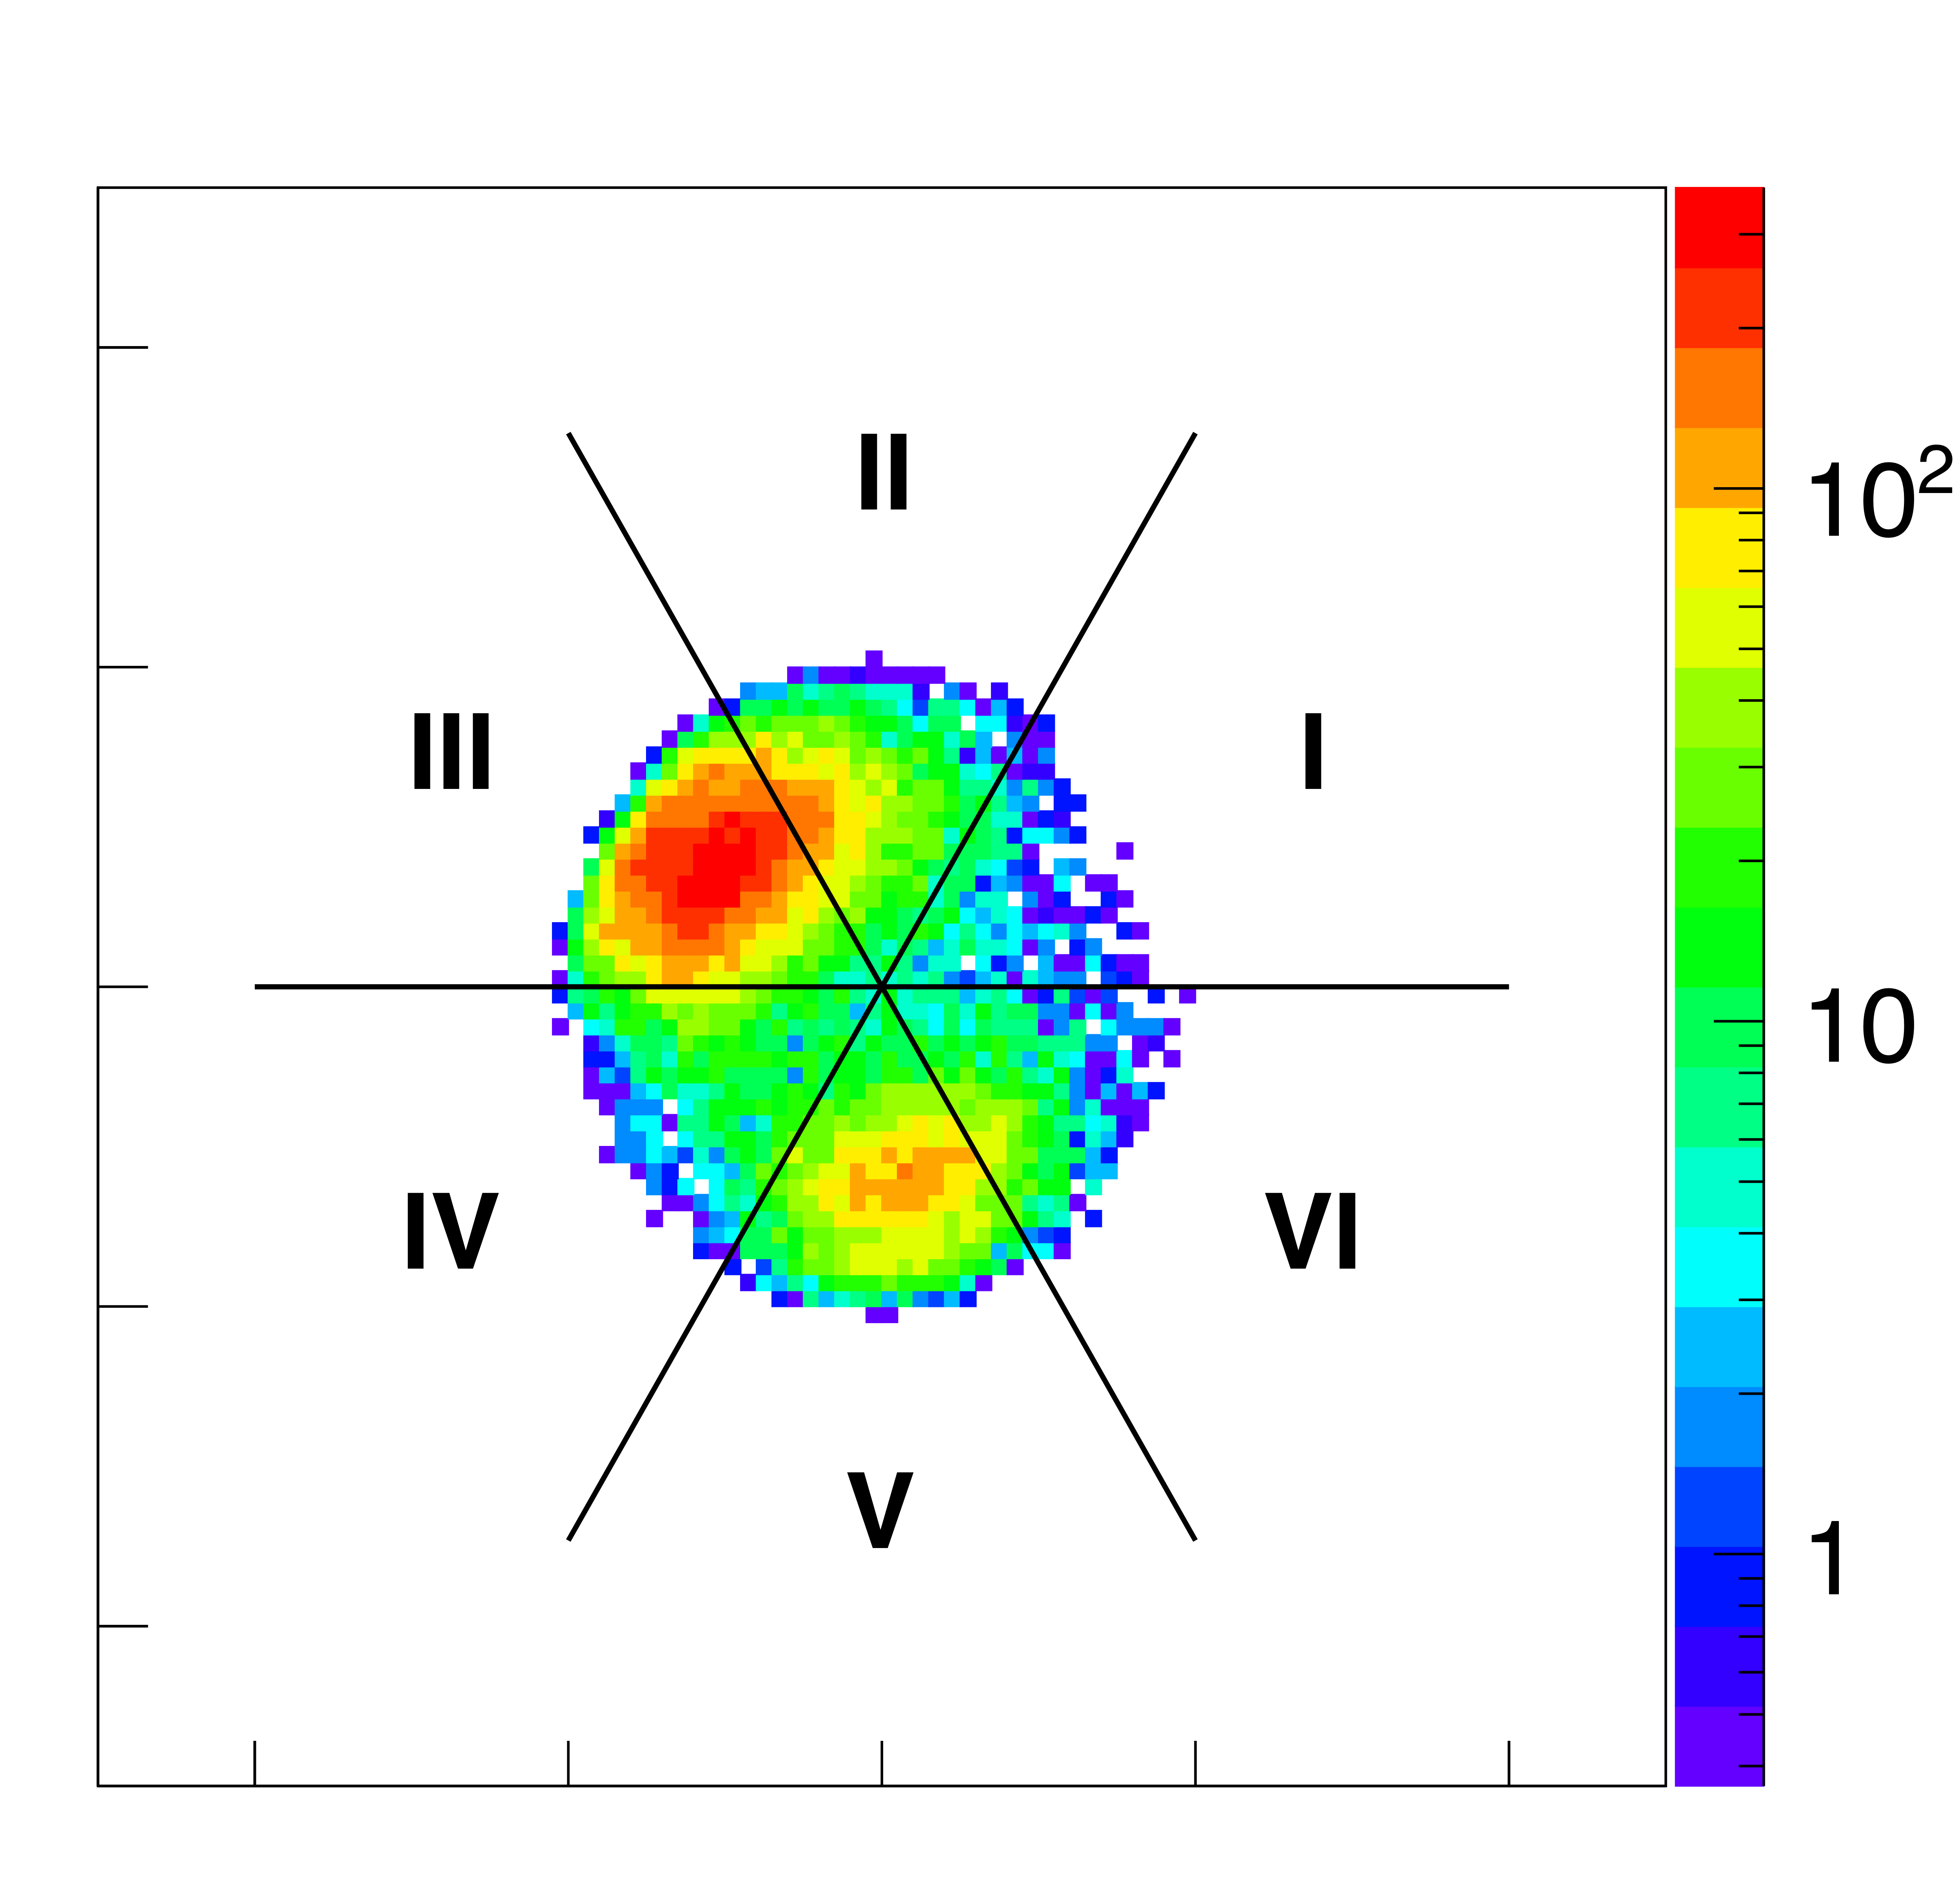
Figure 11c:
Van Hove plots of the three-body final states, (a) Data from the $p\bar{p}p$ reaction, with Areas V and VI empty due to proton sorting. (b) Phase space MC distribution for the $p\bar{p}p$ reaction. (c) Data from the $\Lambda \bar{\Lambda} p$ reactions in which each particle is unique. Two clusters of data indicate the kinematic separation of $\Lambda \bar{\Lambda}$ and $p \bar{\Lambda}$ creation. (d) Phase space MC for the $\Lambda \bar{\Lambda} p$ reaction. The data shown in (a), (c) are not acceptance corrected. |
Phys. Rev. C113 (2026) 4, 045207: downloads png pdf |
Figure 11d:
Van Hove plots of the three-body final states, (a) Data from the $p\bar{p}p$ reaction, with Areas V and VI empty due to proton sorting. (b) Phase space MC distribution for the $p\bar{p}p$ reaction. (c) Data from the $\Lambda \bar{\Lambda} p$ reactions in which each particle is unique. Two clusters of data indicate the kinematic separation of $\Lambda \bar{\Lambda}$ and $p \bar{\Lambda}$ creation. (d) Phase space MC for the $\Lambda \bar{\Lambda} p$ reaction. The data shown in (a), (c) are not acceptance corrected. |
Phys. Rev. C113 (2026) 4, 045207: downloads png pdf |
Figure 12a:
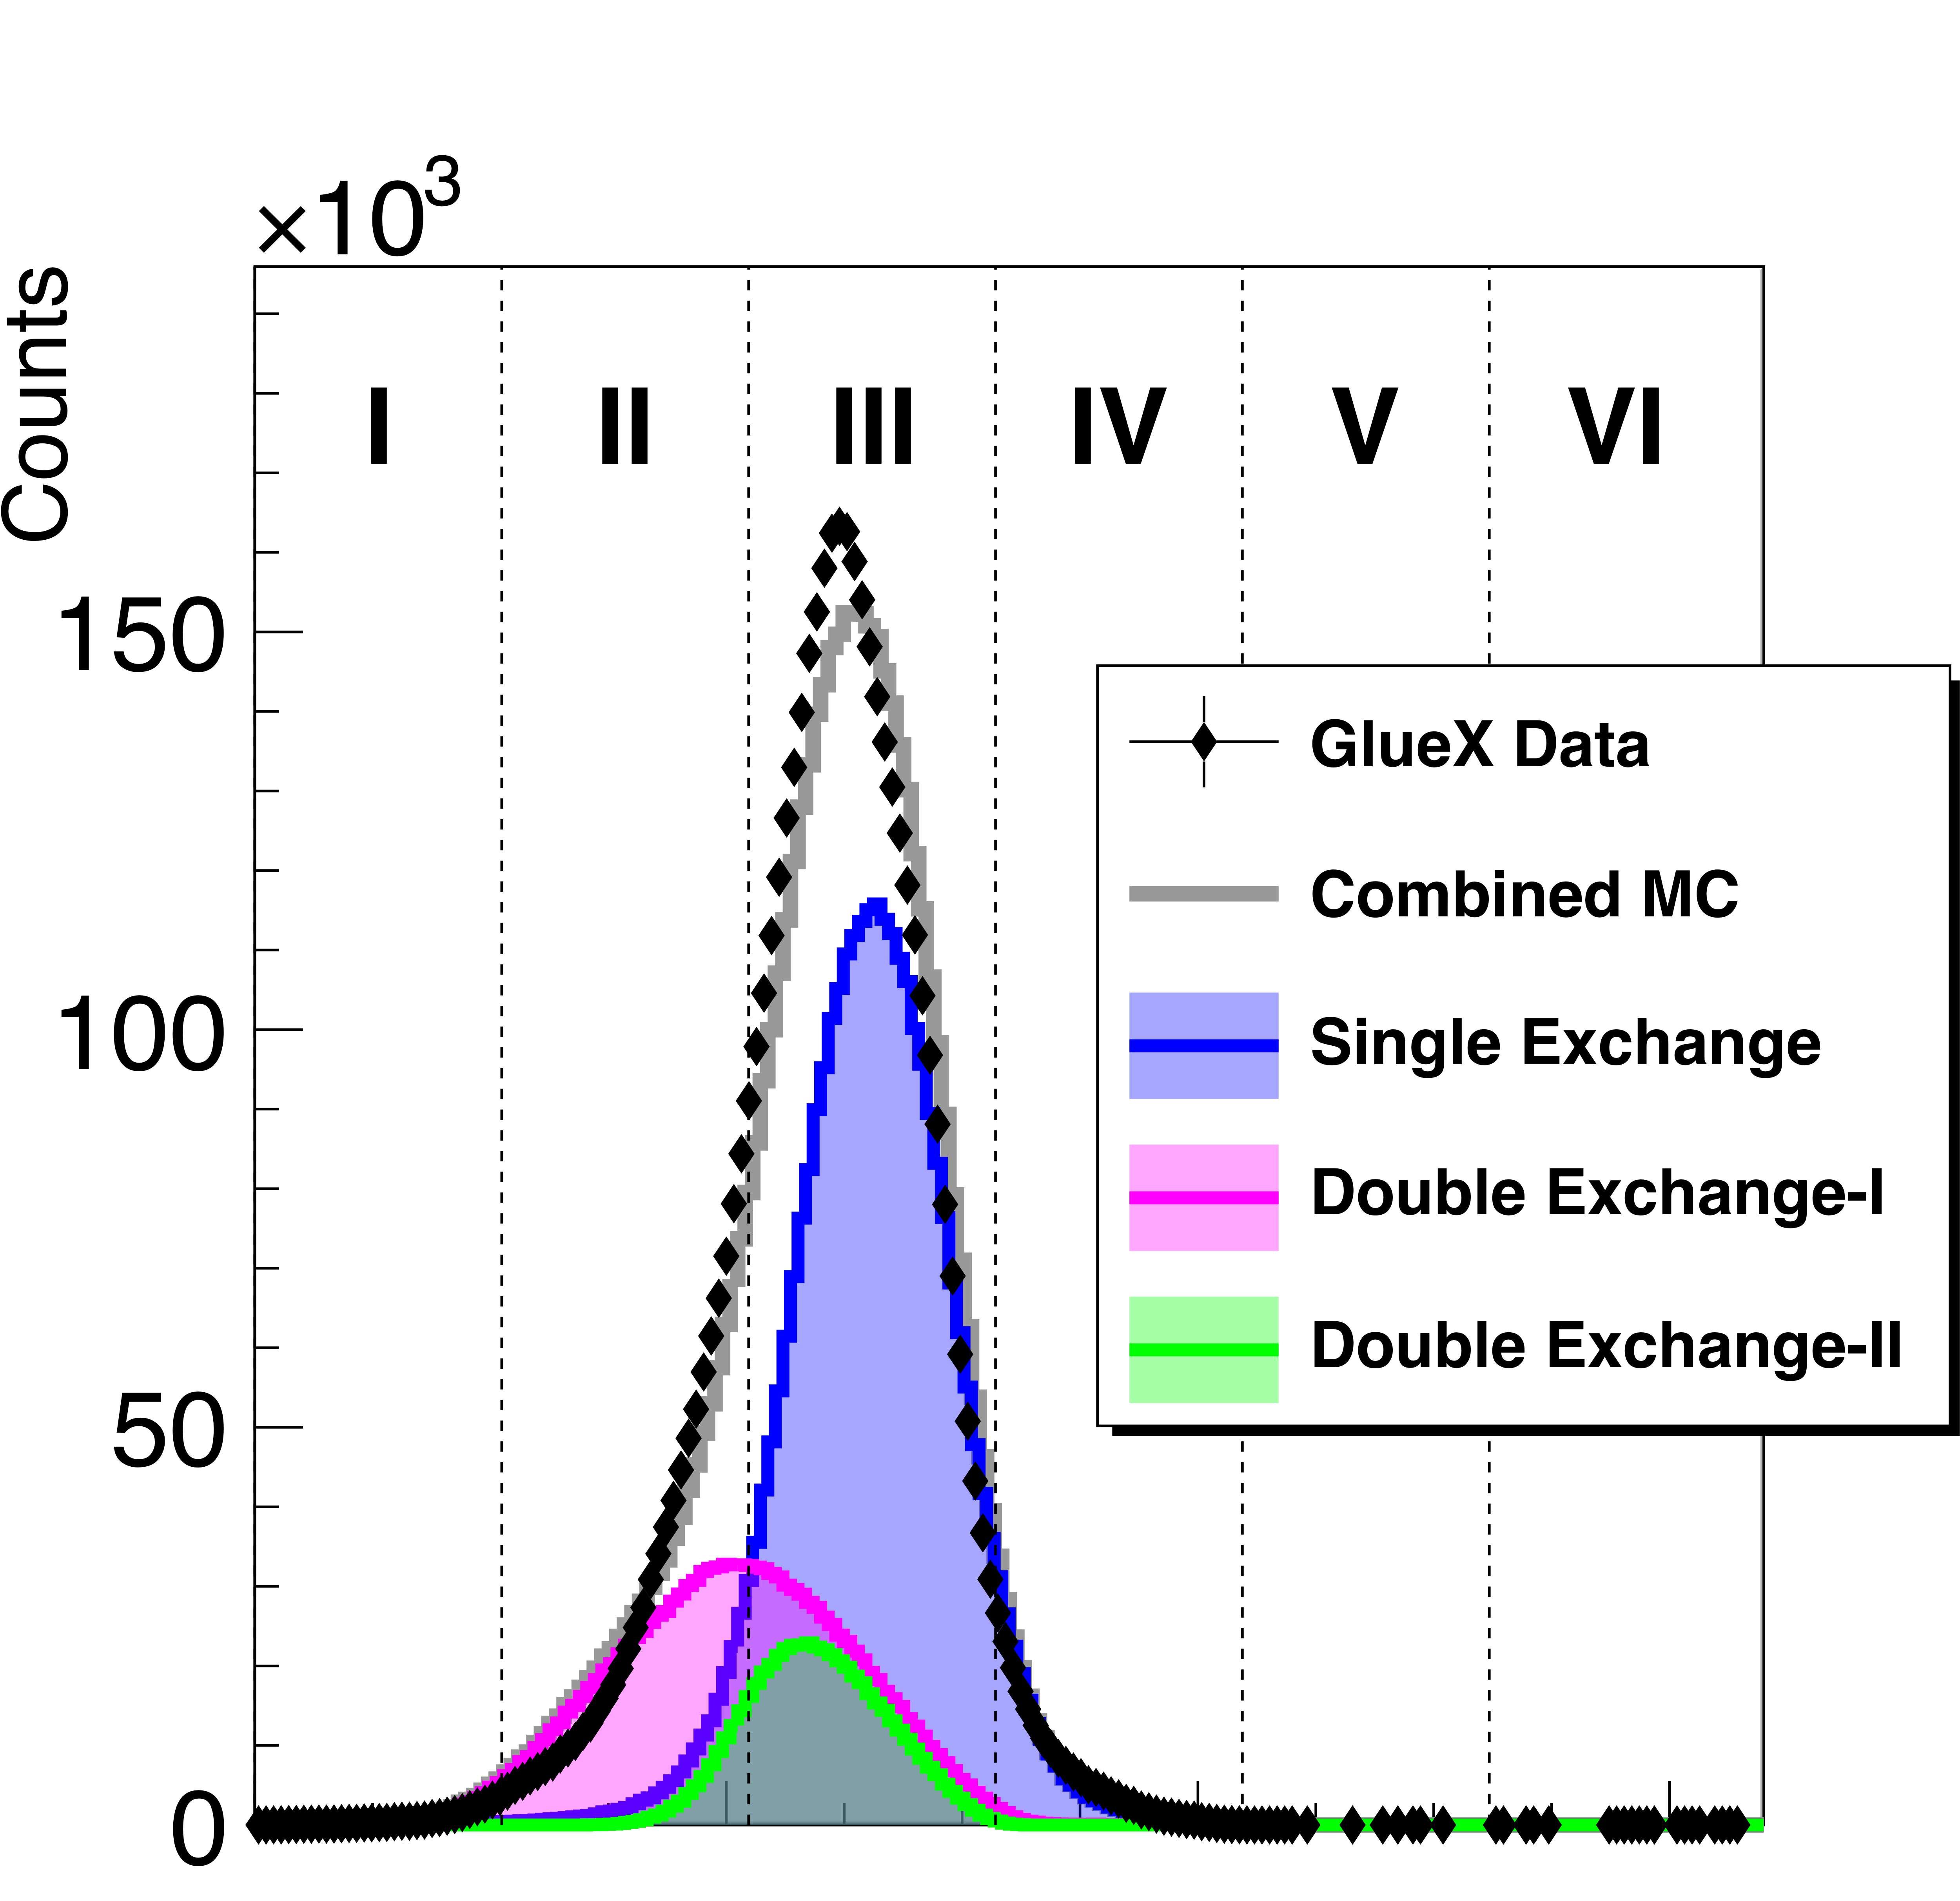
Van Hove distributions of the three-particle final states as a function of the angular parameter, $\omega$, that sorts the events according to pair longitudinal momenta. (Top) Data from the $p \bar{p} p$ reaction showing that most events are in Area III, corresponding to single exchange kinematics (blue in the model fit), but with significant overlap with events in the double exchange dominated region of Area II (magenta and green in the model fit). (Bottom) Data from the $\Lambda \bar{\Lambda} p$ reaction showing the division between $\{ \Lambda \bar{\Lambda} \} p $ events mainly in Areas II and III, and $\{ p \bar{\Lambda} \} \Lambda $ events mainly in Areas V and VI. The cut separating $\Lambda\bar{\Lambda}$ and $p\bar{\Lambda}$ cases is indicated by the solid red line at $\omega = 3.67$. |
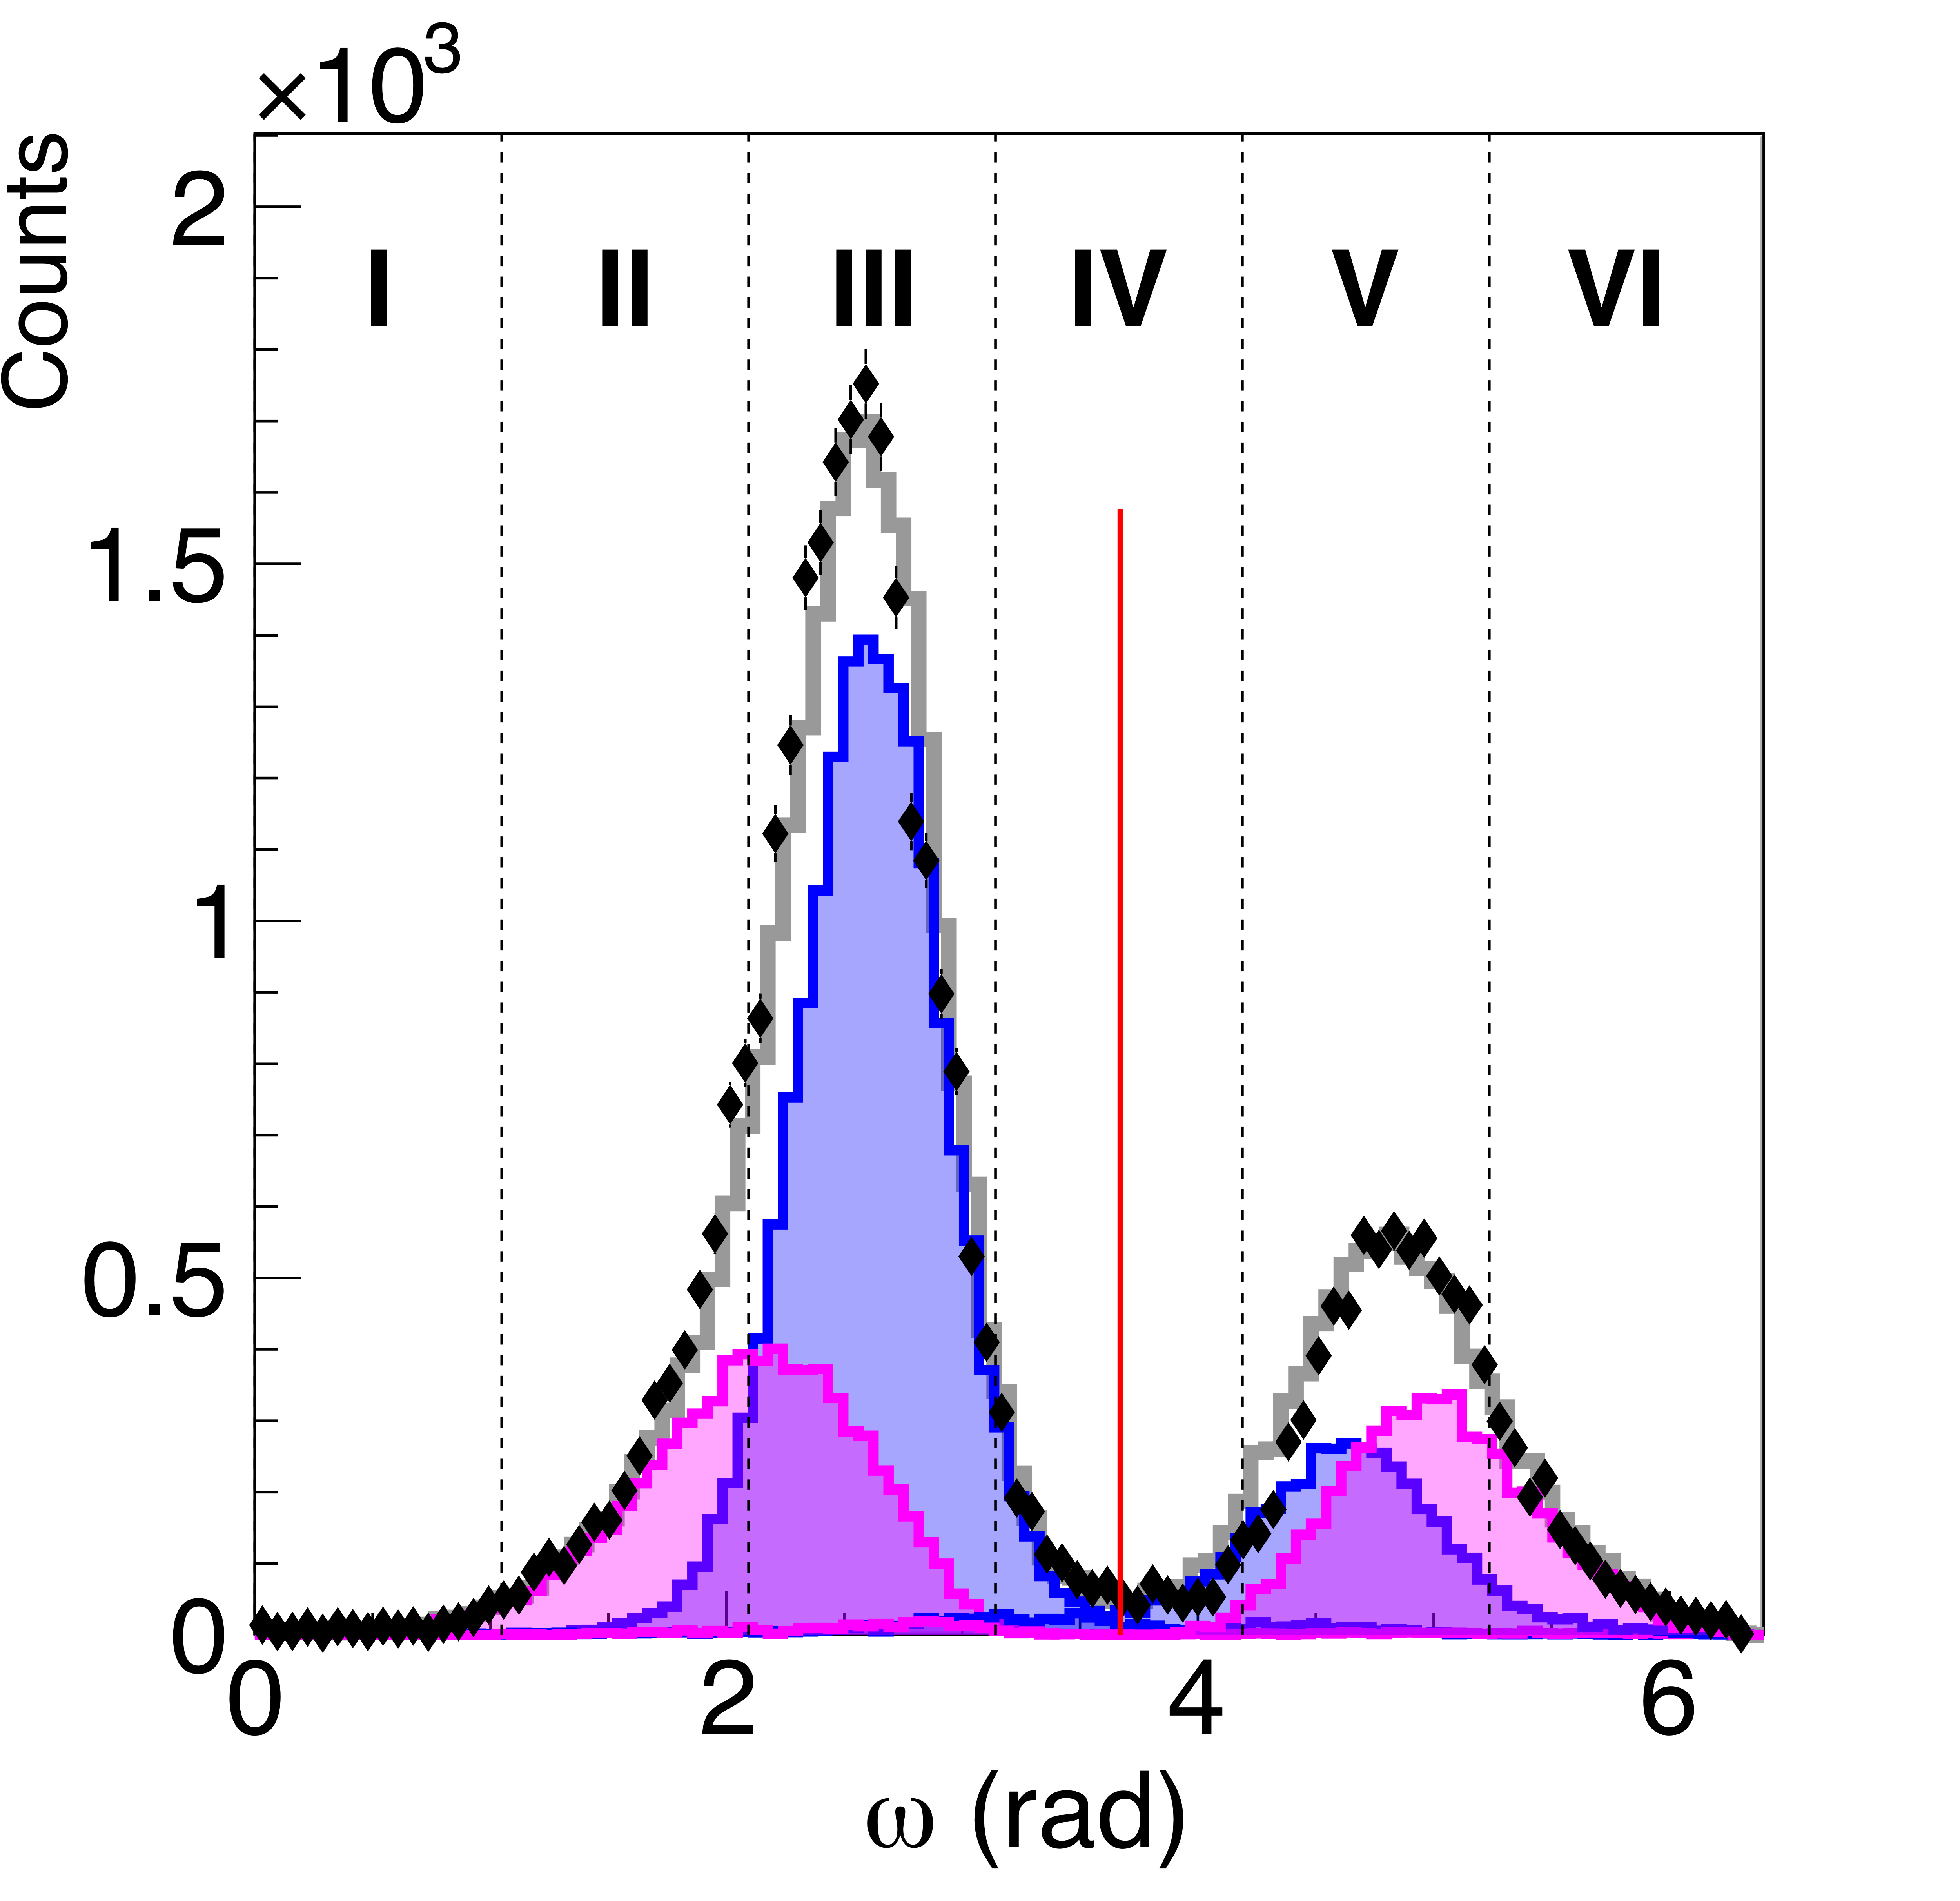
Phys. Rev. C113 (2026) 4, 045207: downloads png pdf |
Figure 12b:
Van Hove distributions of the three-particle final states as a function of the angular parameter, $\omega$, that sorts the events according to pair longitudinal momenta. (Top) Data from the $p \bar{p} p$ reaction showing that most events are in Area III, corresponding to single exchange kinematics (blue in the model fit), but with significant overlap with events in the double exchange dominated region of Area II (magenta and green in the model fit). (Bottom) Data from the $\Lambda \bar{\Lambda} p$ reaction showing the division between $\{ \Lambda \bar{\Lambda} \} p $ events mainly in Areas II and III, and $\{ p \bar{\Lambda} \} \Lambda $ events mainly in Areas V and VI. The cut separating $\Lambda\bar{\Lambda}$ and $p\bar{\Lambda}$ cases is indicated by the solid red line at $\omega = 3.67$. |
Phys. Rev. C113 (2026) 4, 045207: downloads png pdf |
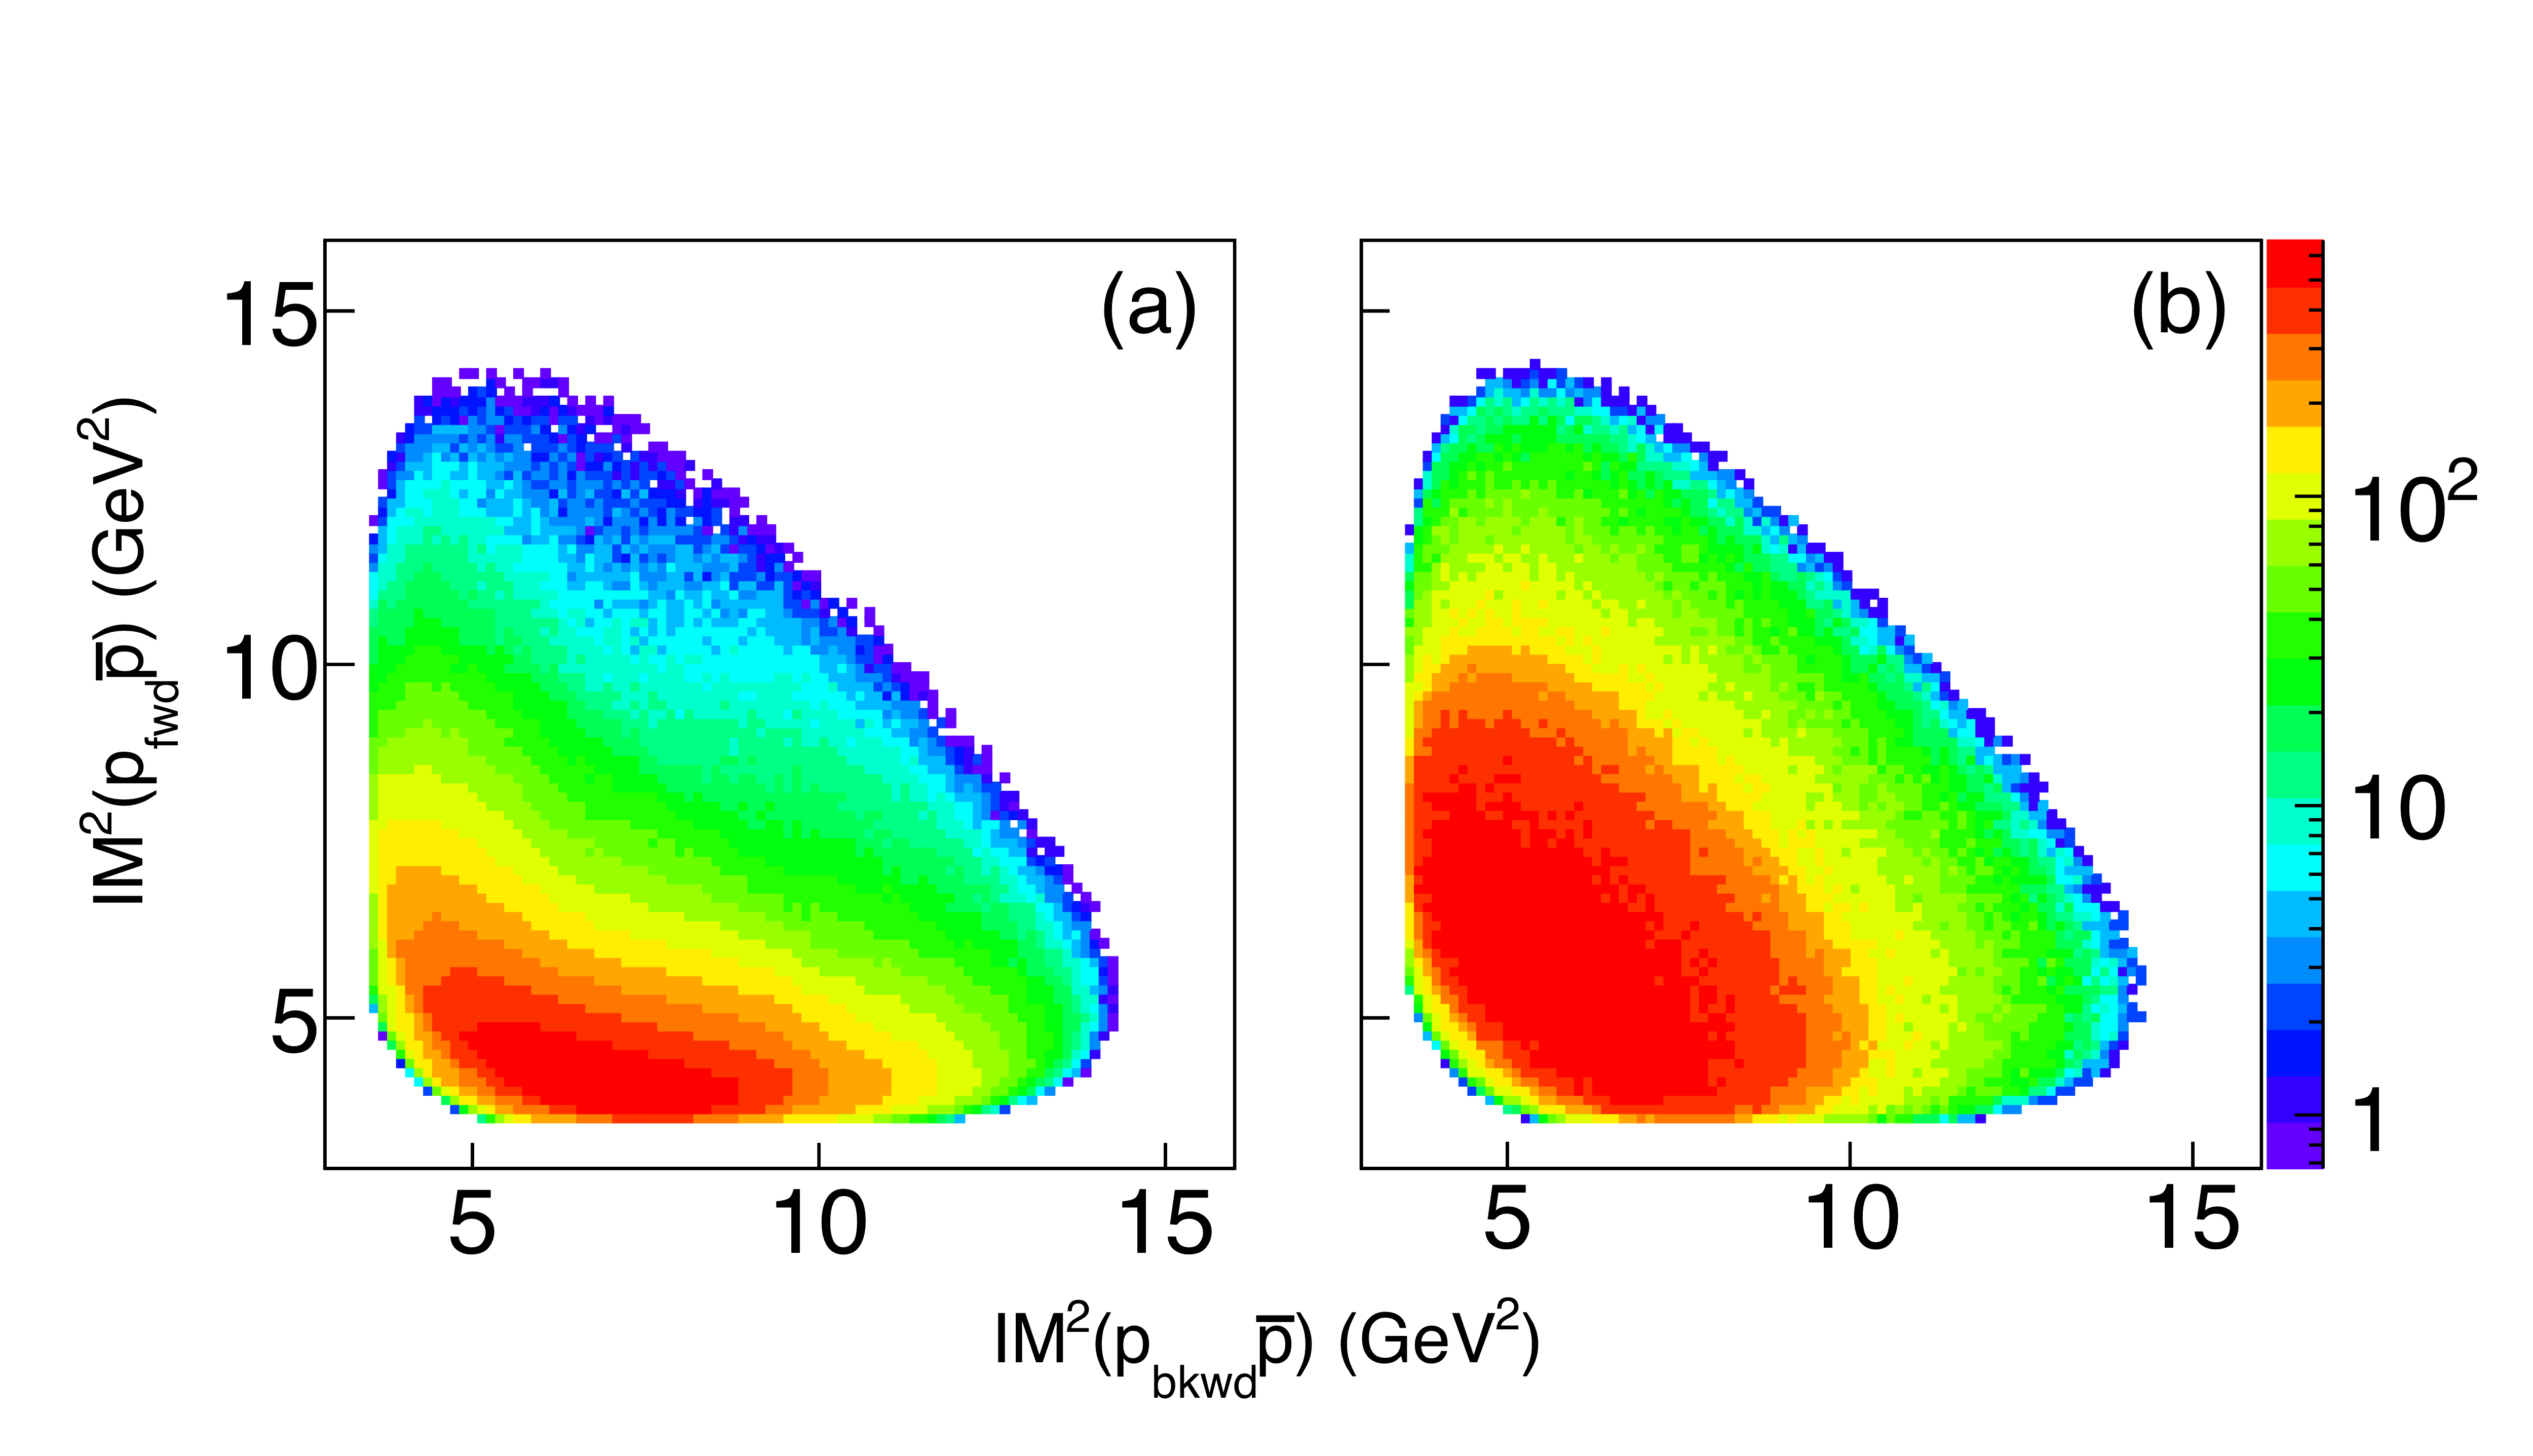
Figure 13:
Dalitz plots for the $\gamma p \rightarrow \{p\bar{p}\} p$ reaction summed over the GlueX beam energy range. (a) GlueX data, without acceptance correction. (b) three-body phase space MC. |
Phys. Rev. C113 (2026) 4, 045207: downloads png pdf |
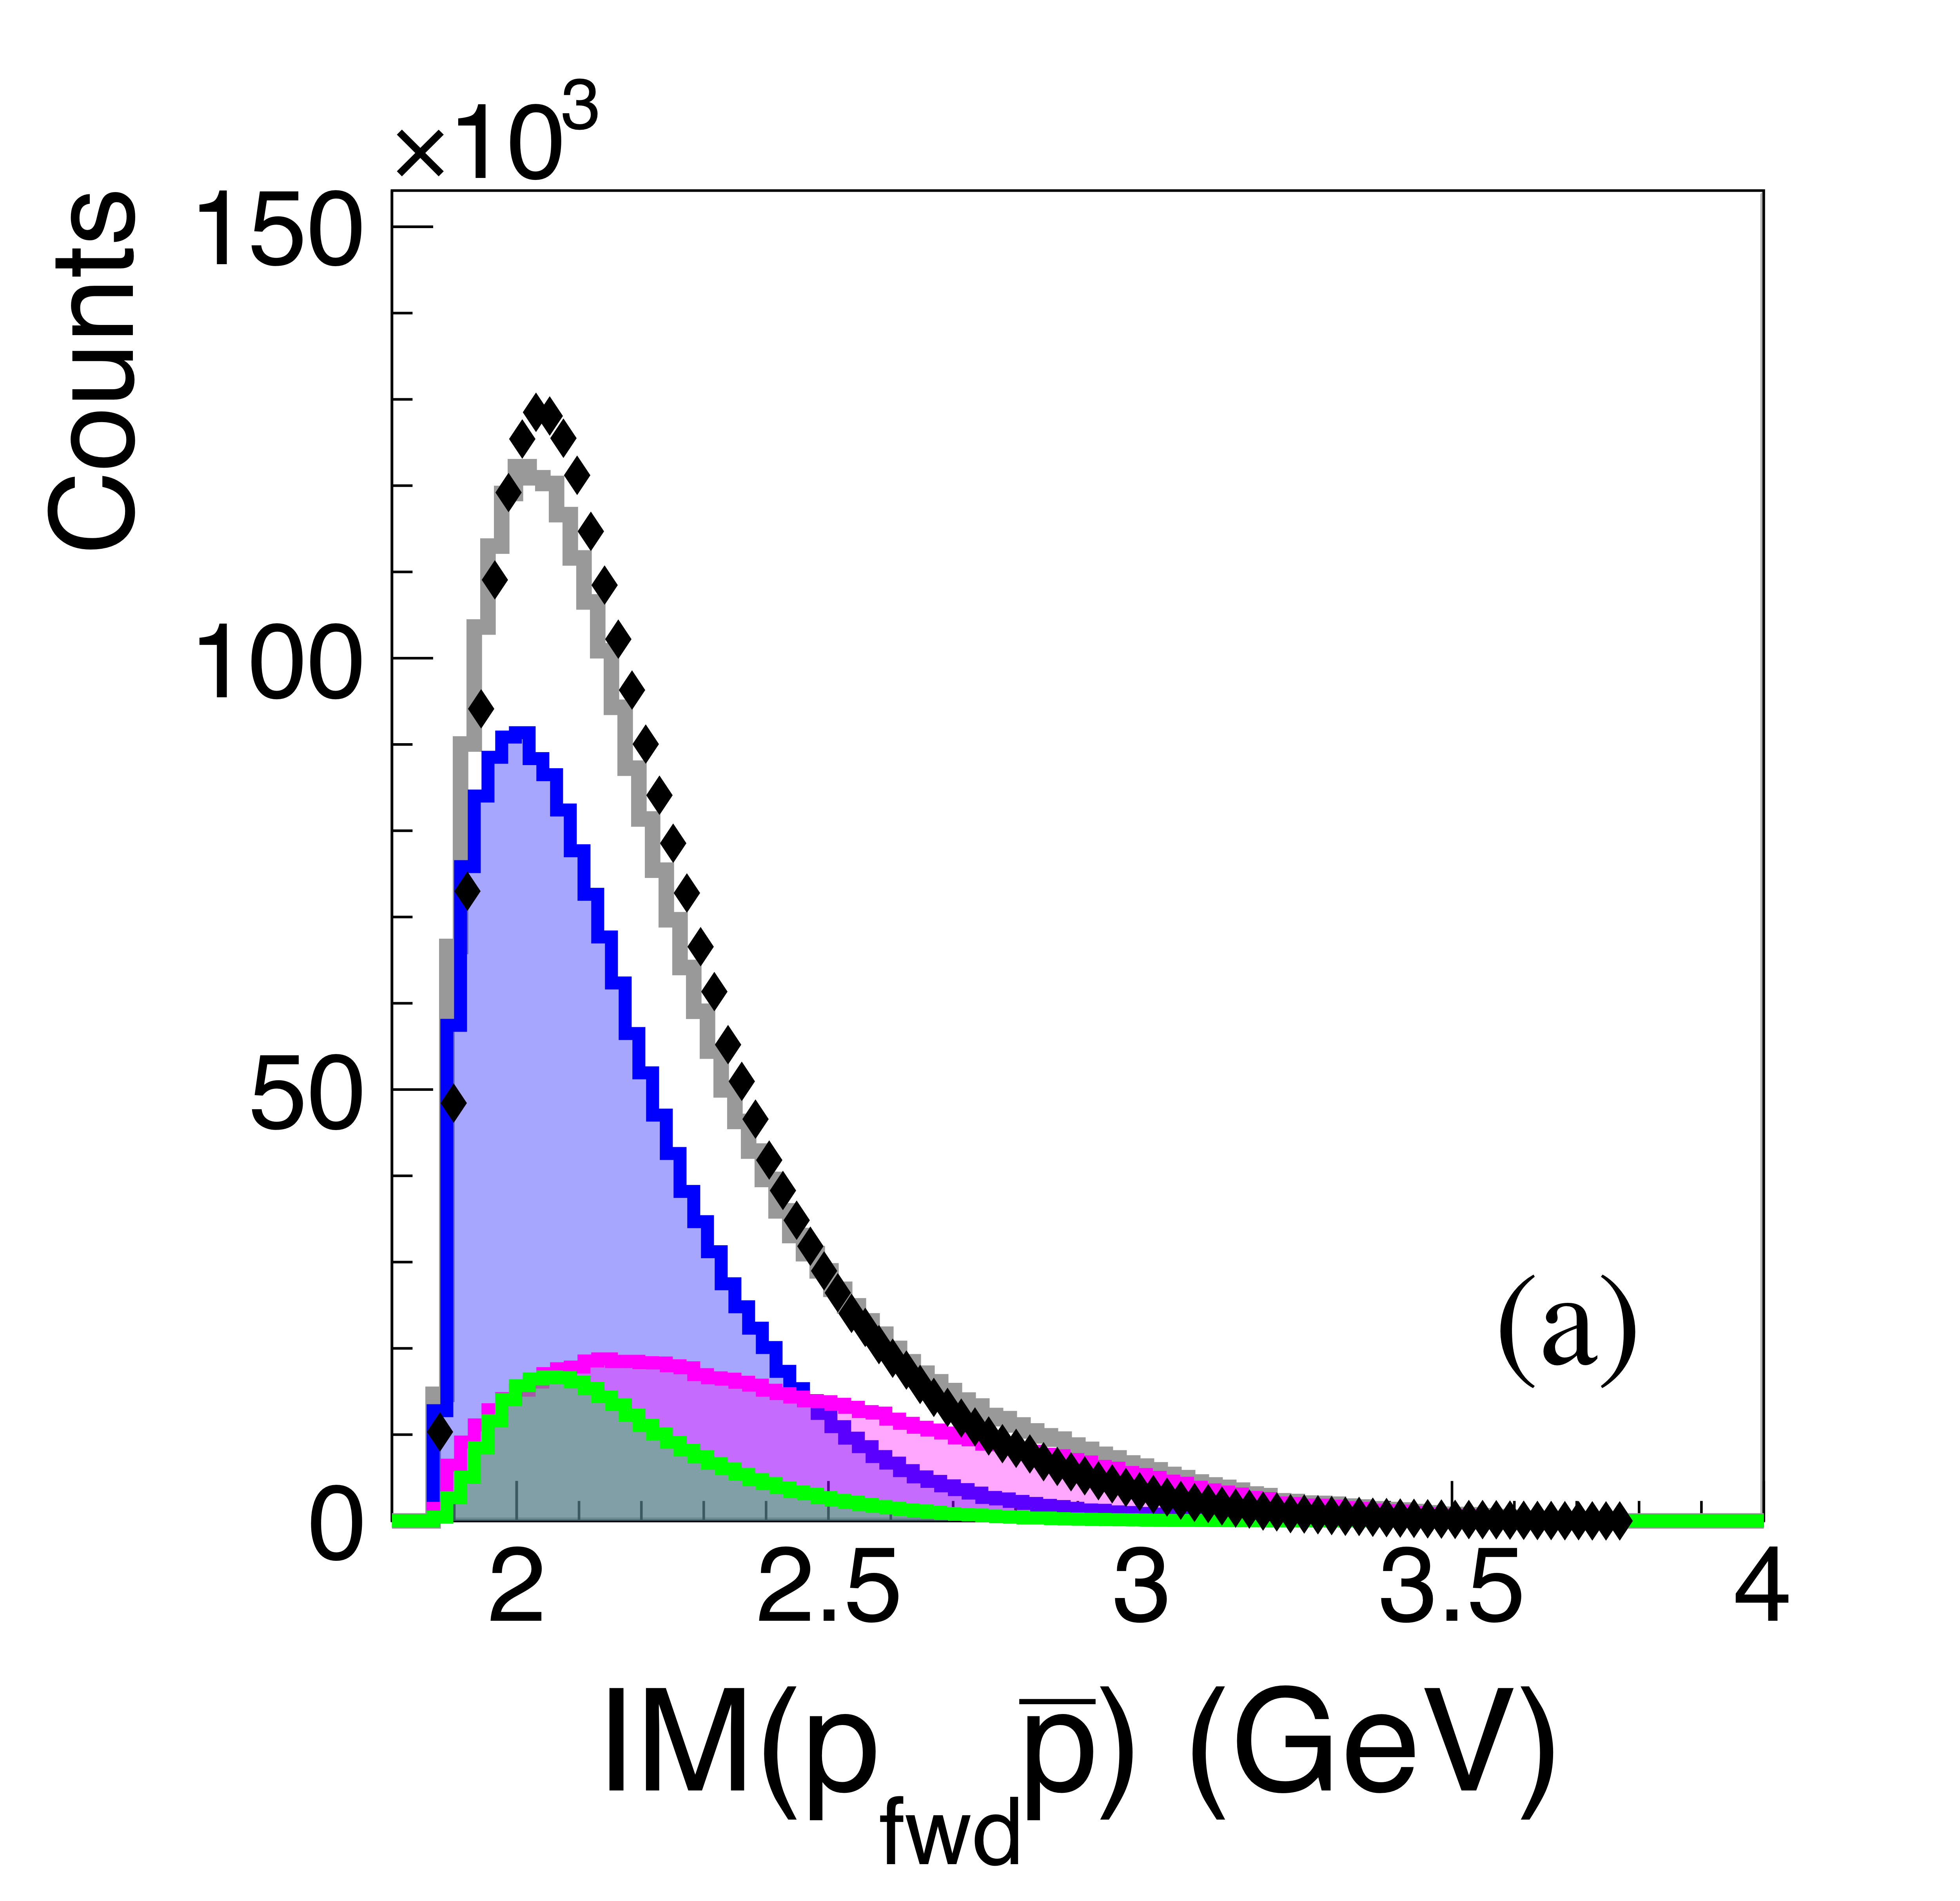
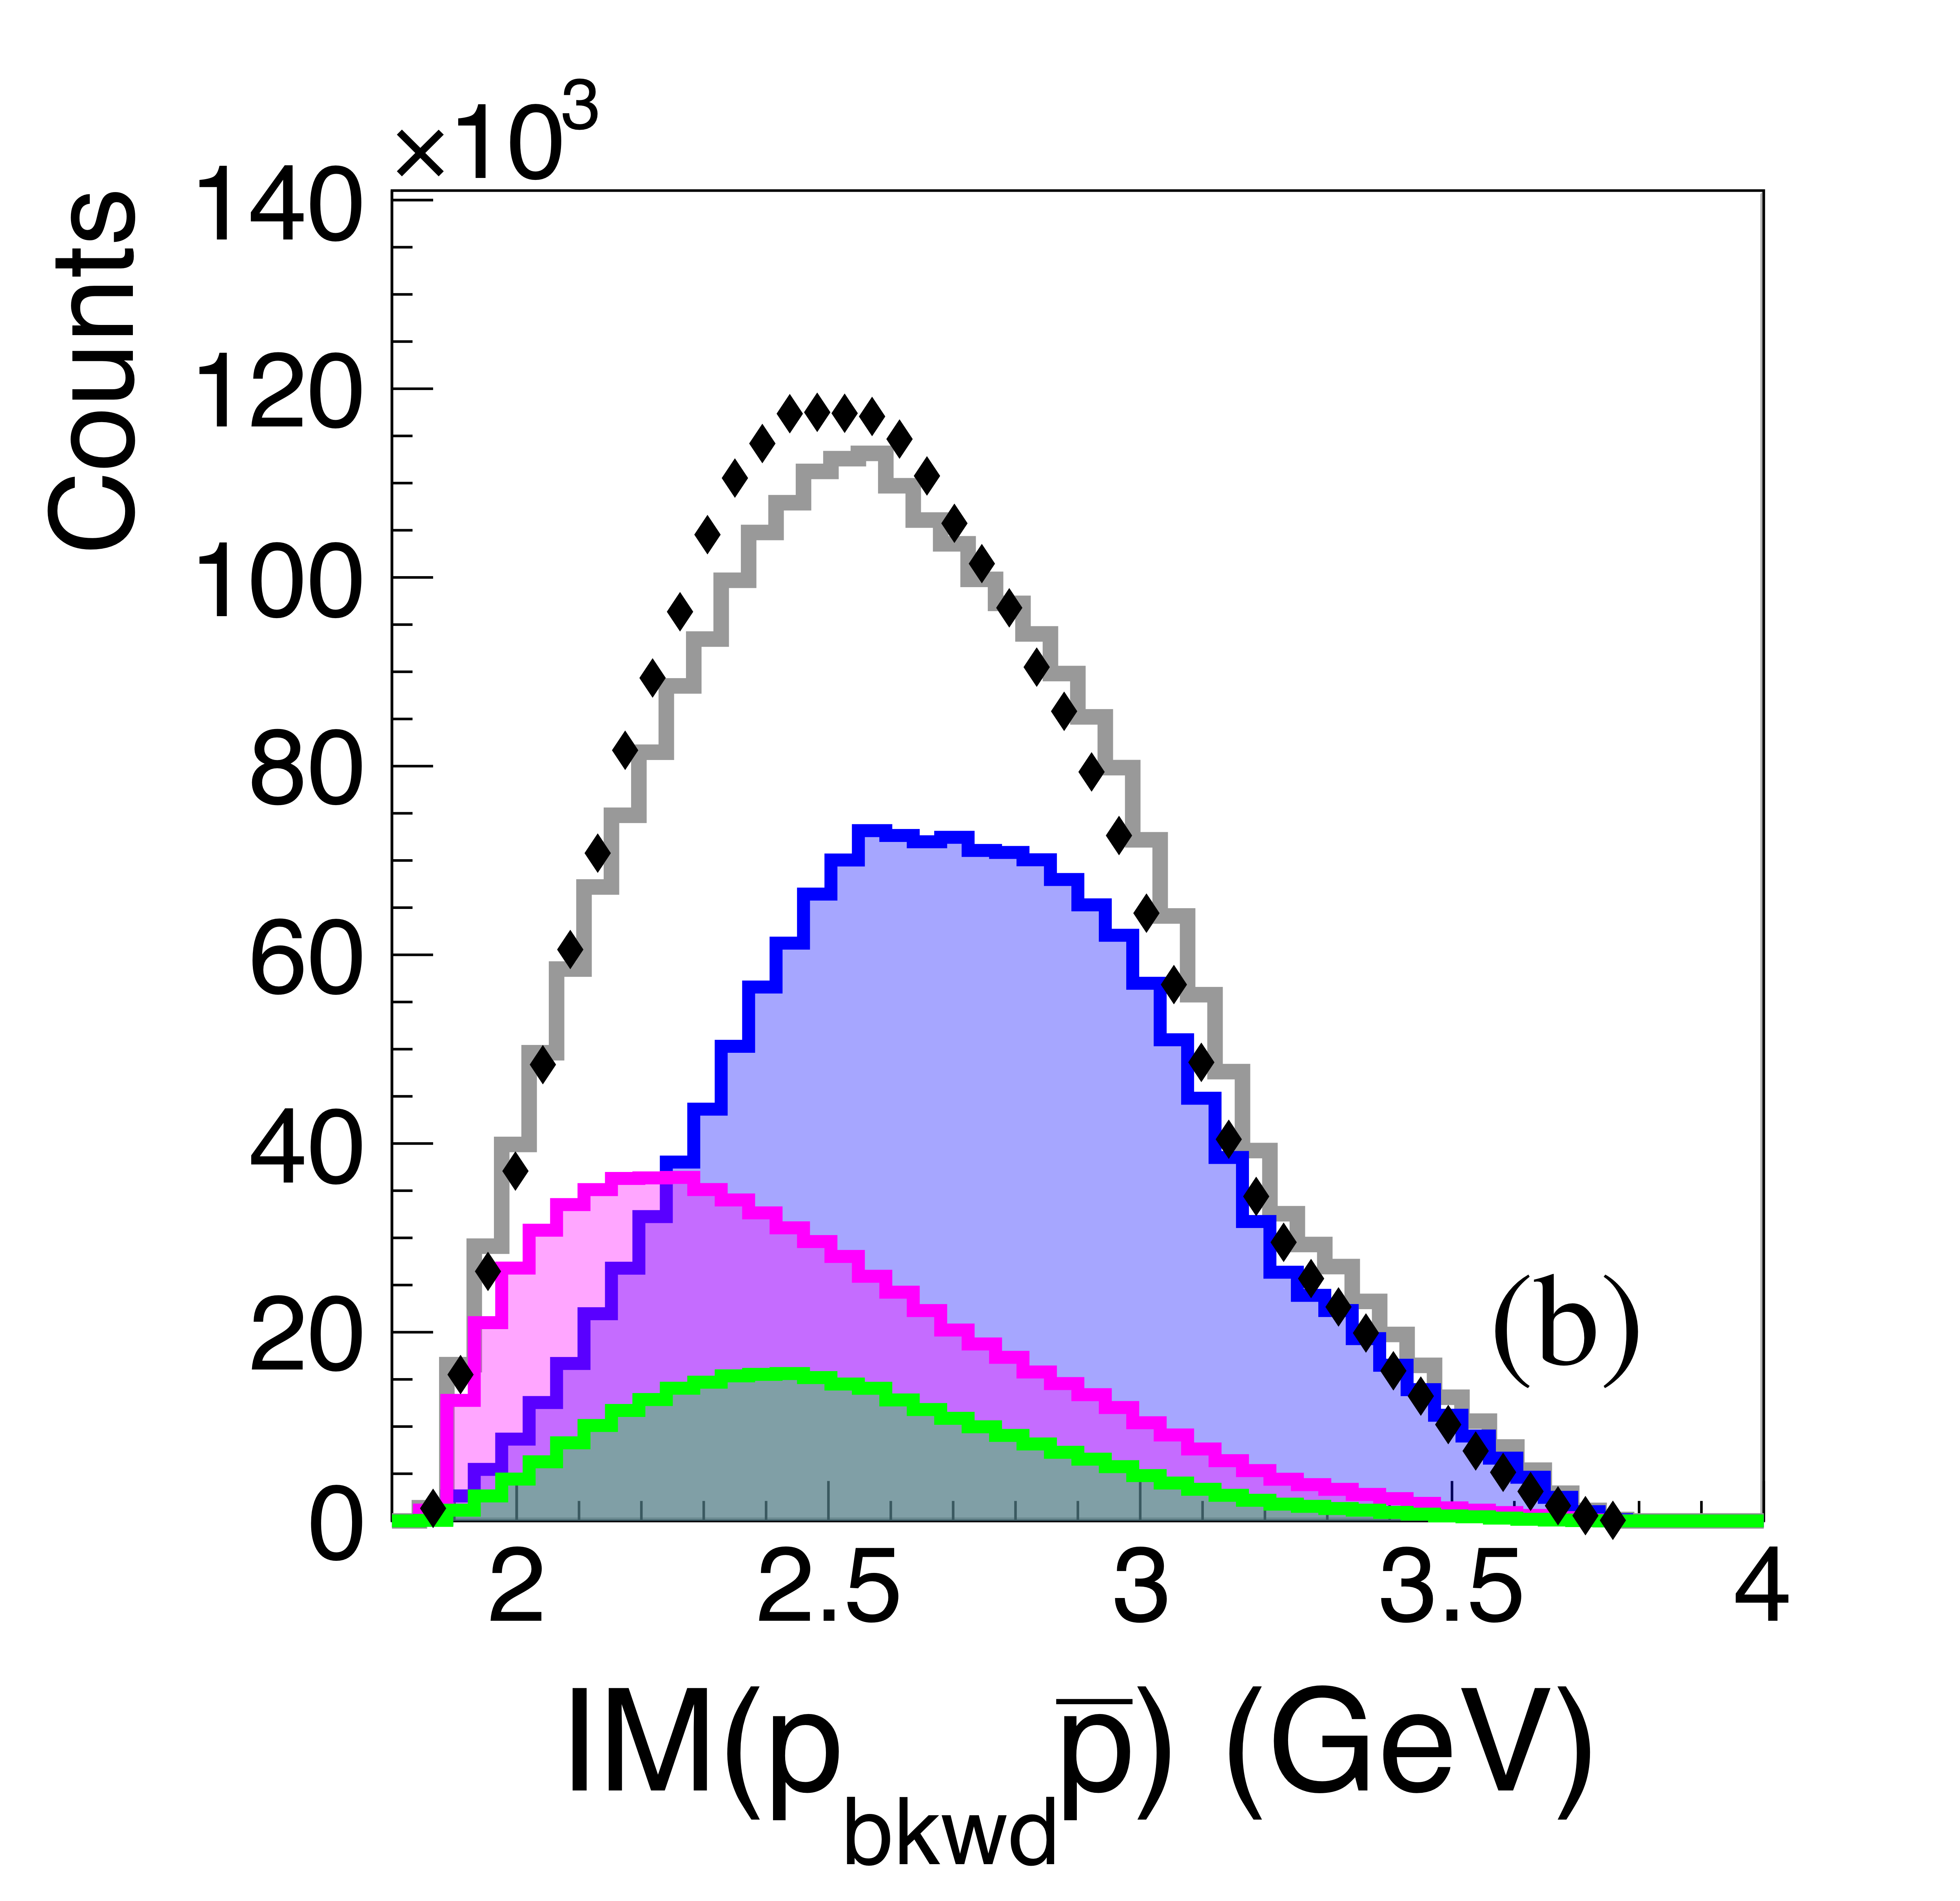
Figure 14a:
(a) Invariant mass of $p\bar{p}$ pairs for the more forward proton (black points), with model fits for the single exchange (blue) and double exchange (magenta and green) processes, totaling to the histogram (grey). (b) Pairings of the \bar{p}s with the more backward $p$. The distributions are not acceptance corrected. |
Phys. Rev. C113 (2026) 4, 045207: downloads png pdf |
Figure 14b:
(a) Invariant mass of $p\bar{p}$ pairs for the more forward proton (black points), with model fits for the single exchange (blue) and double exchange (magenta and green) processes, totaling to the histogram (grey). (b) Pairings of the \bar{p}s with the more backward $p$. The distributions are not acceptance corrected. |
Phys. Rev. C113 (2026) 4, 045207: downloads png pdf |
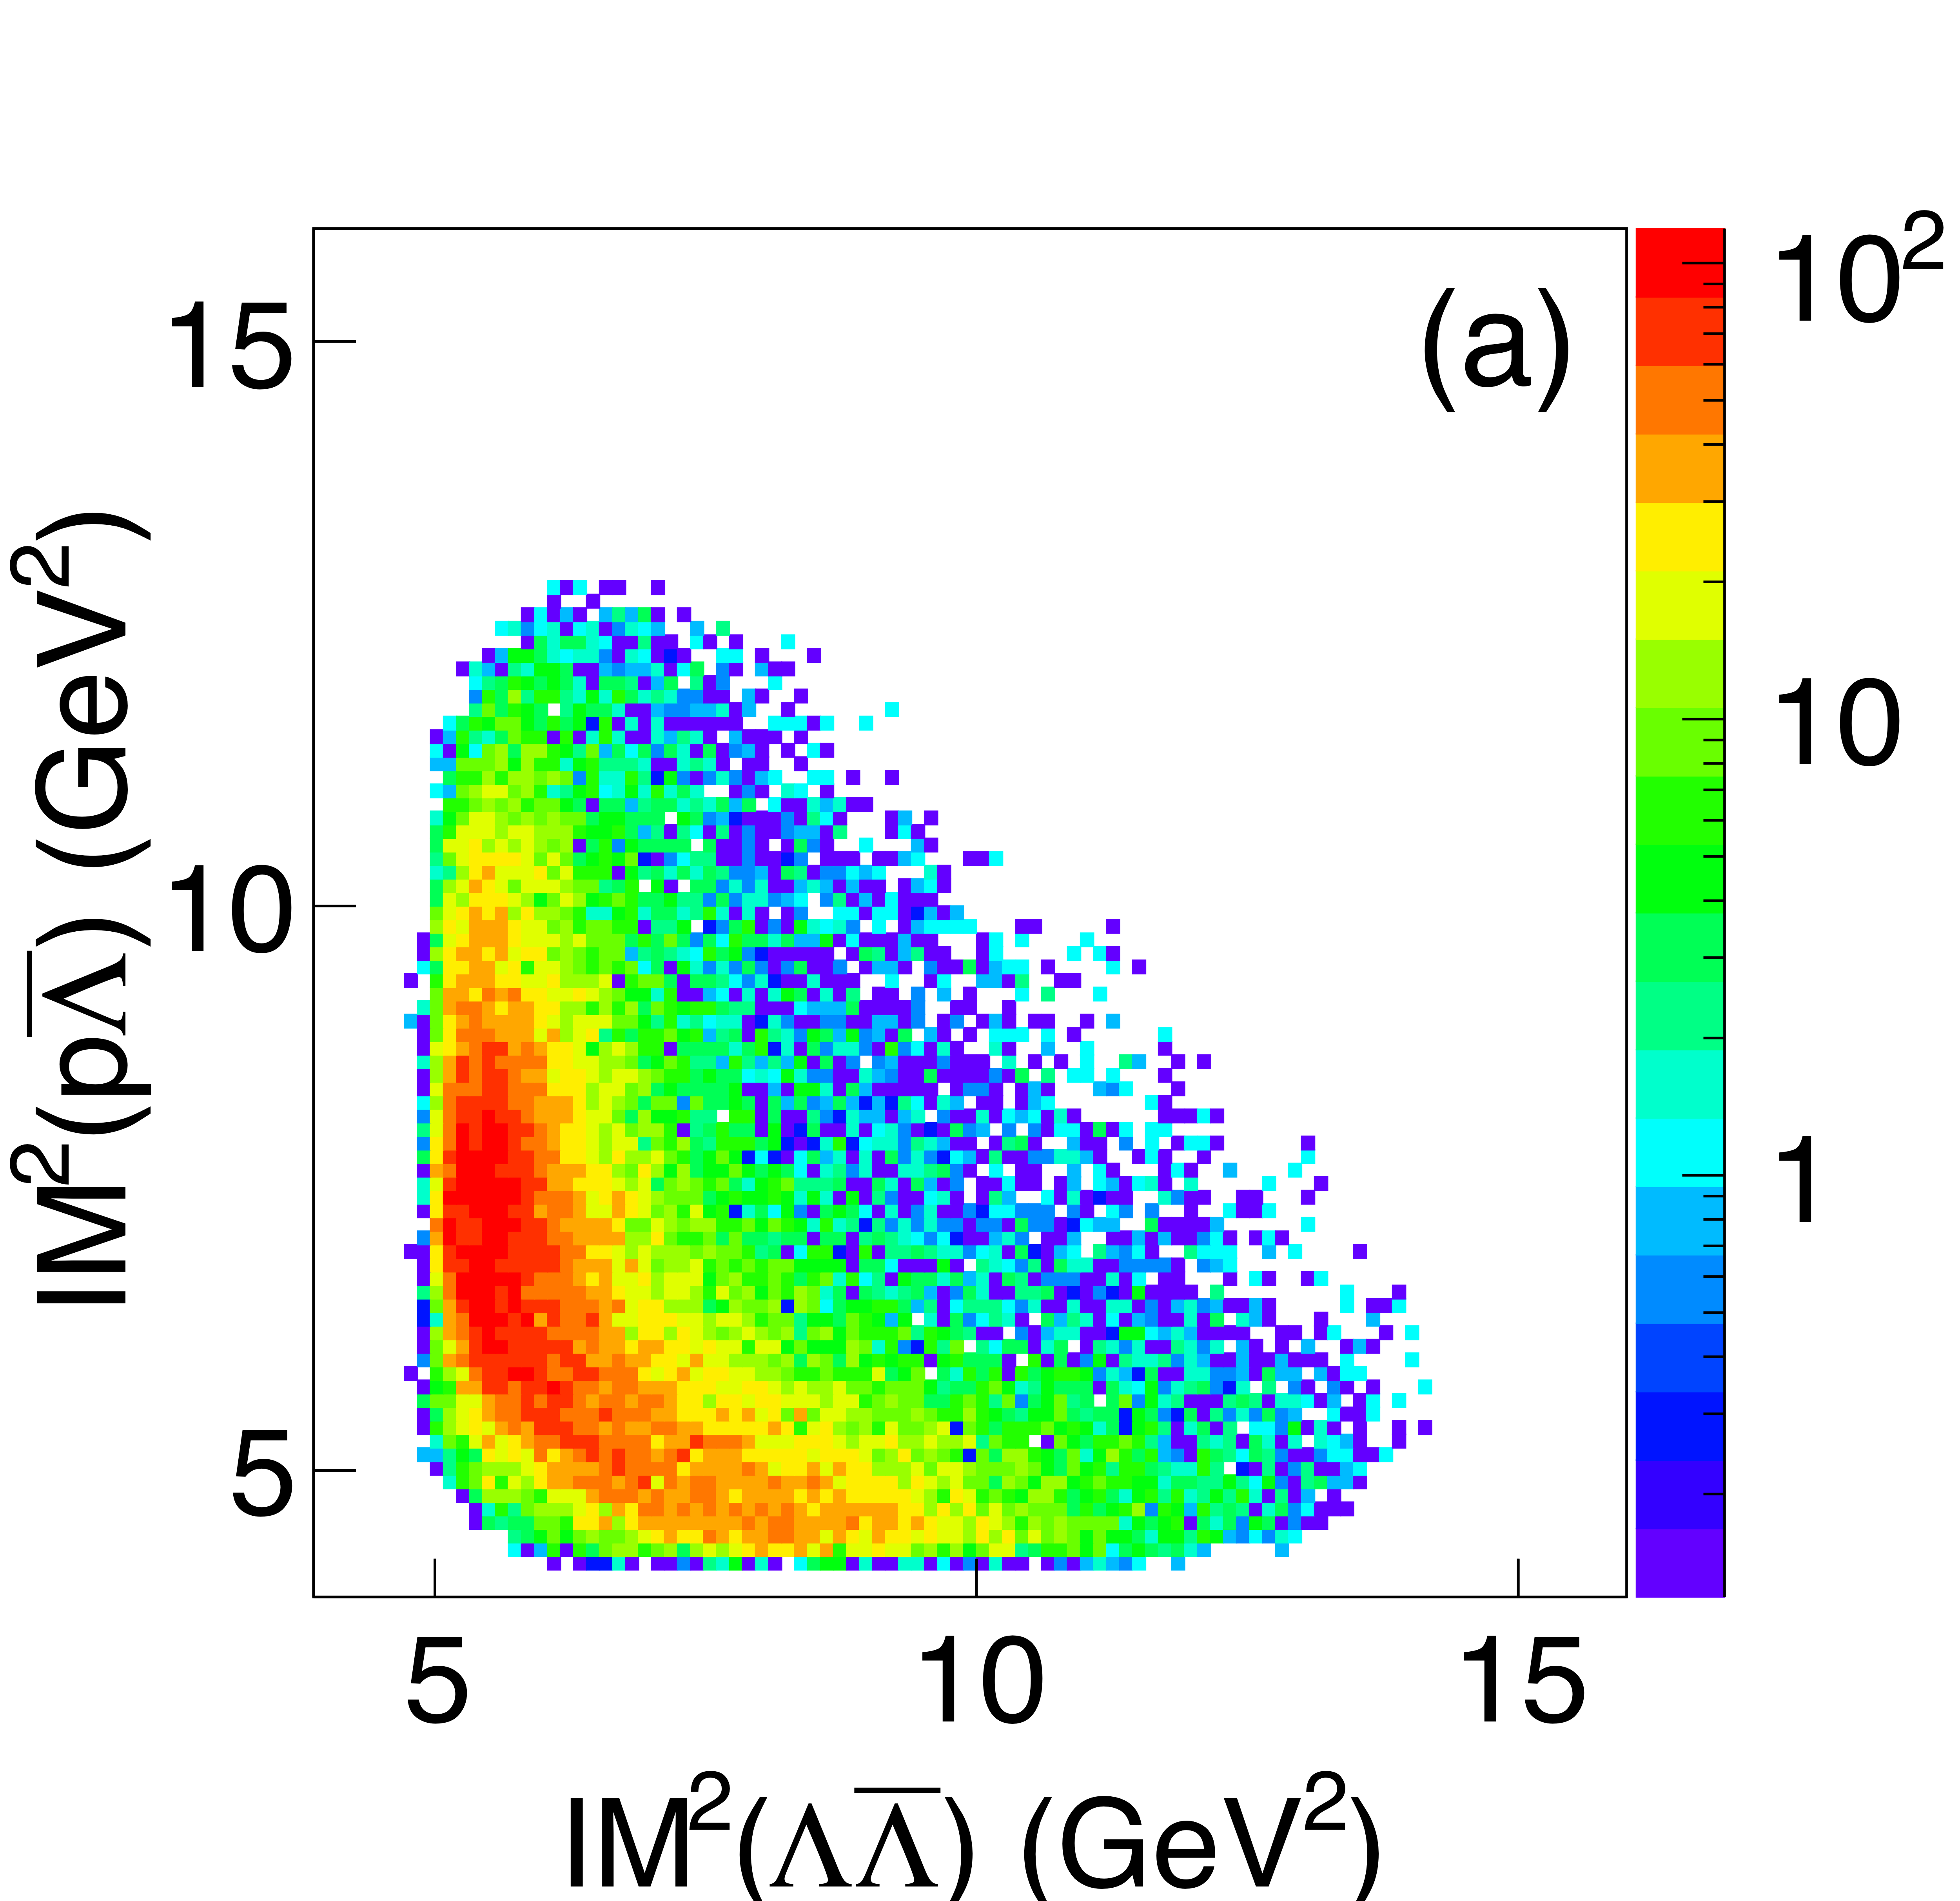
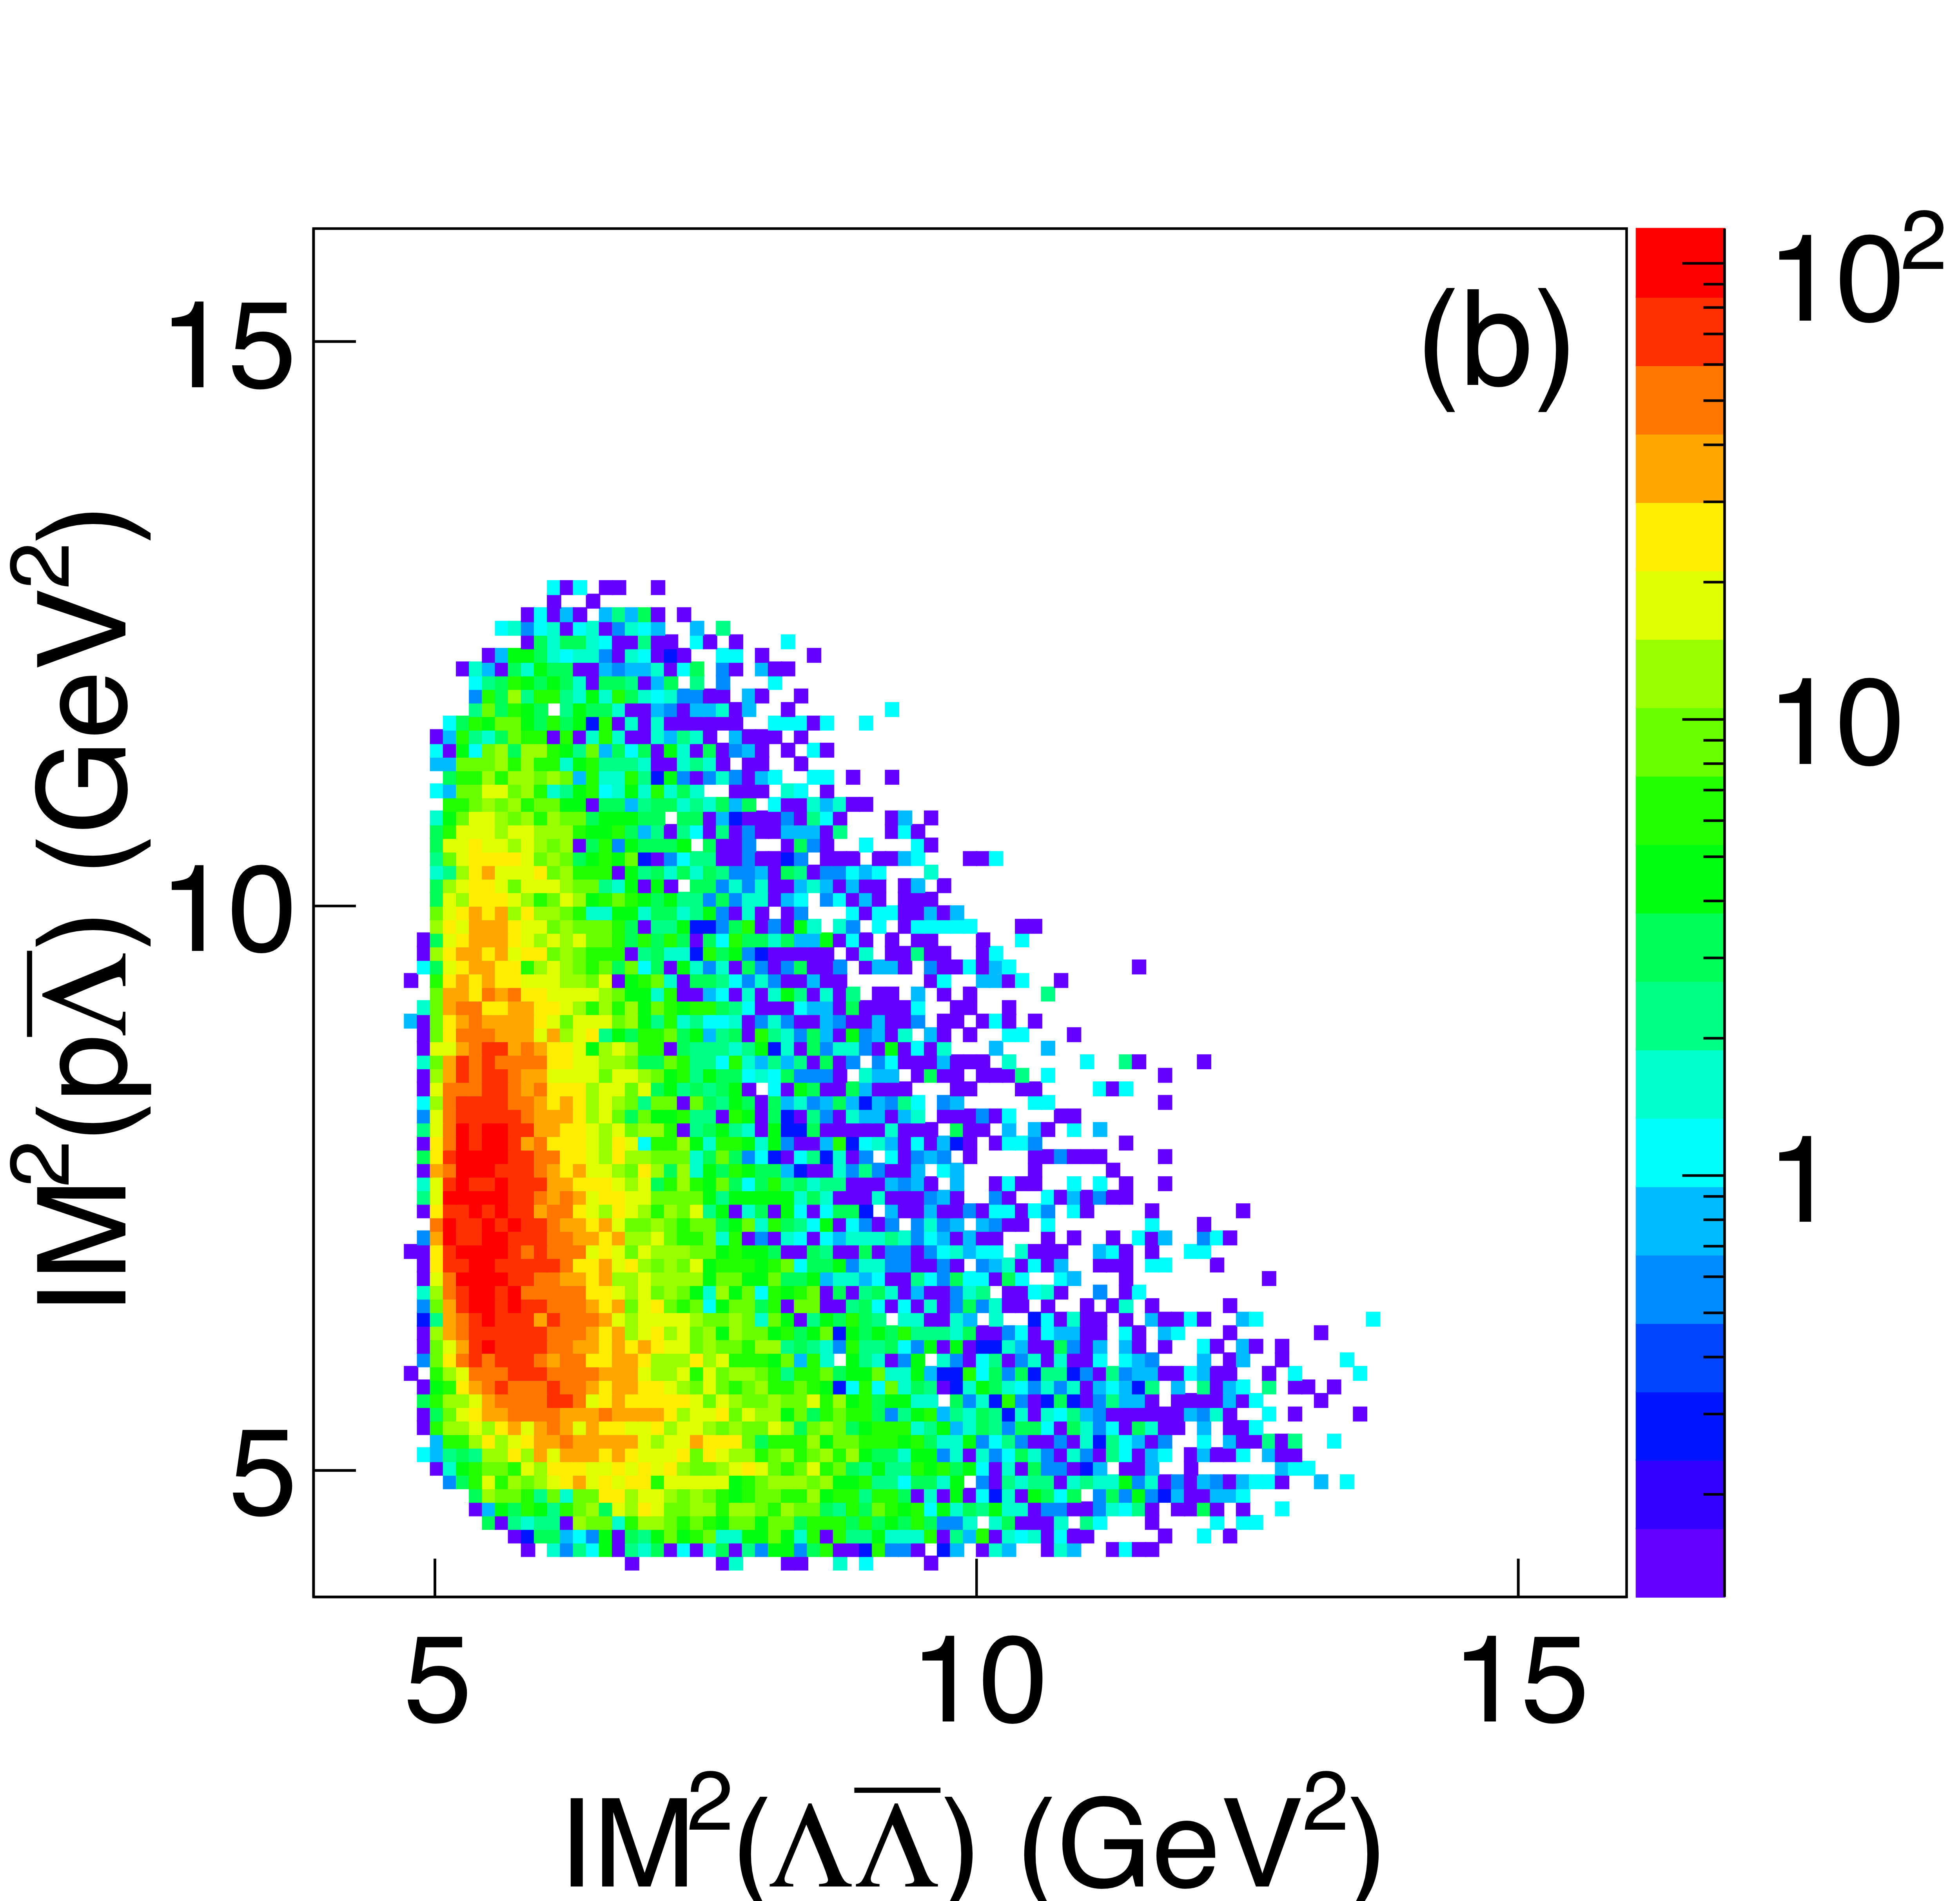
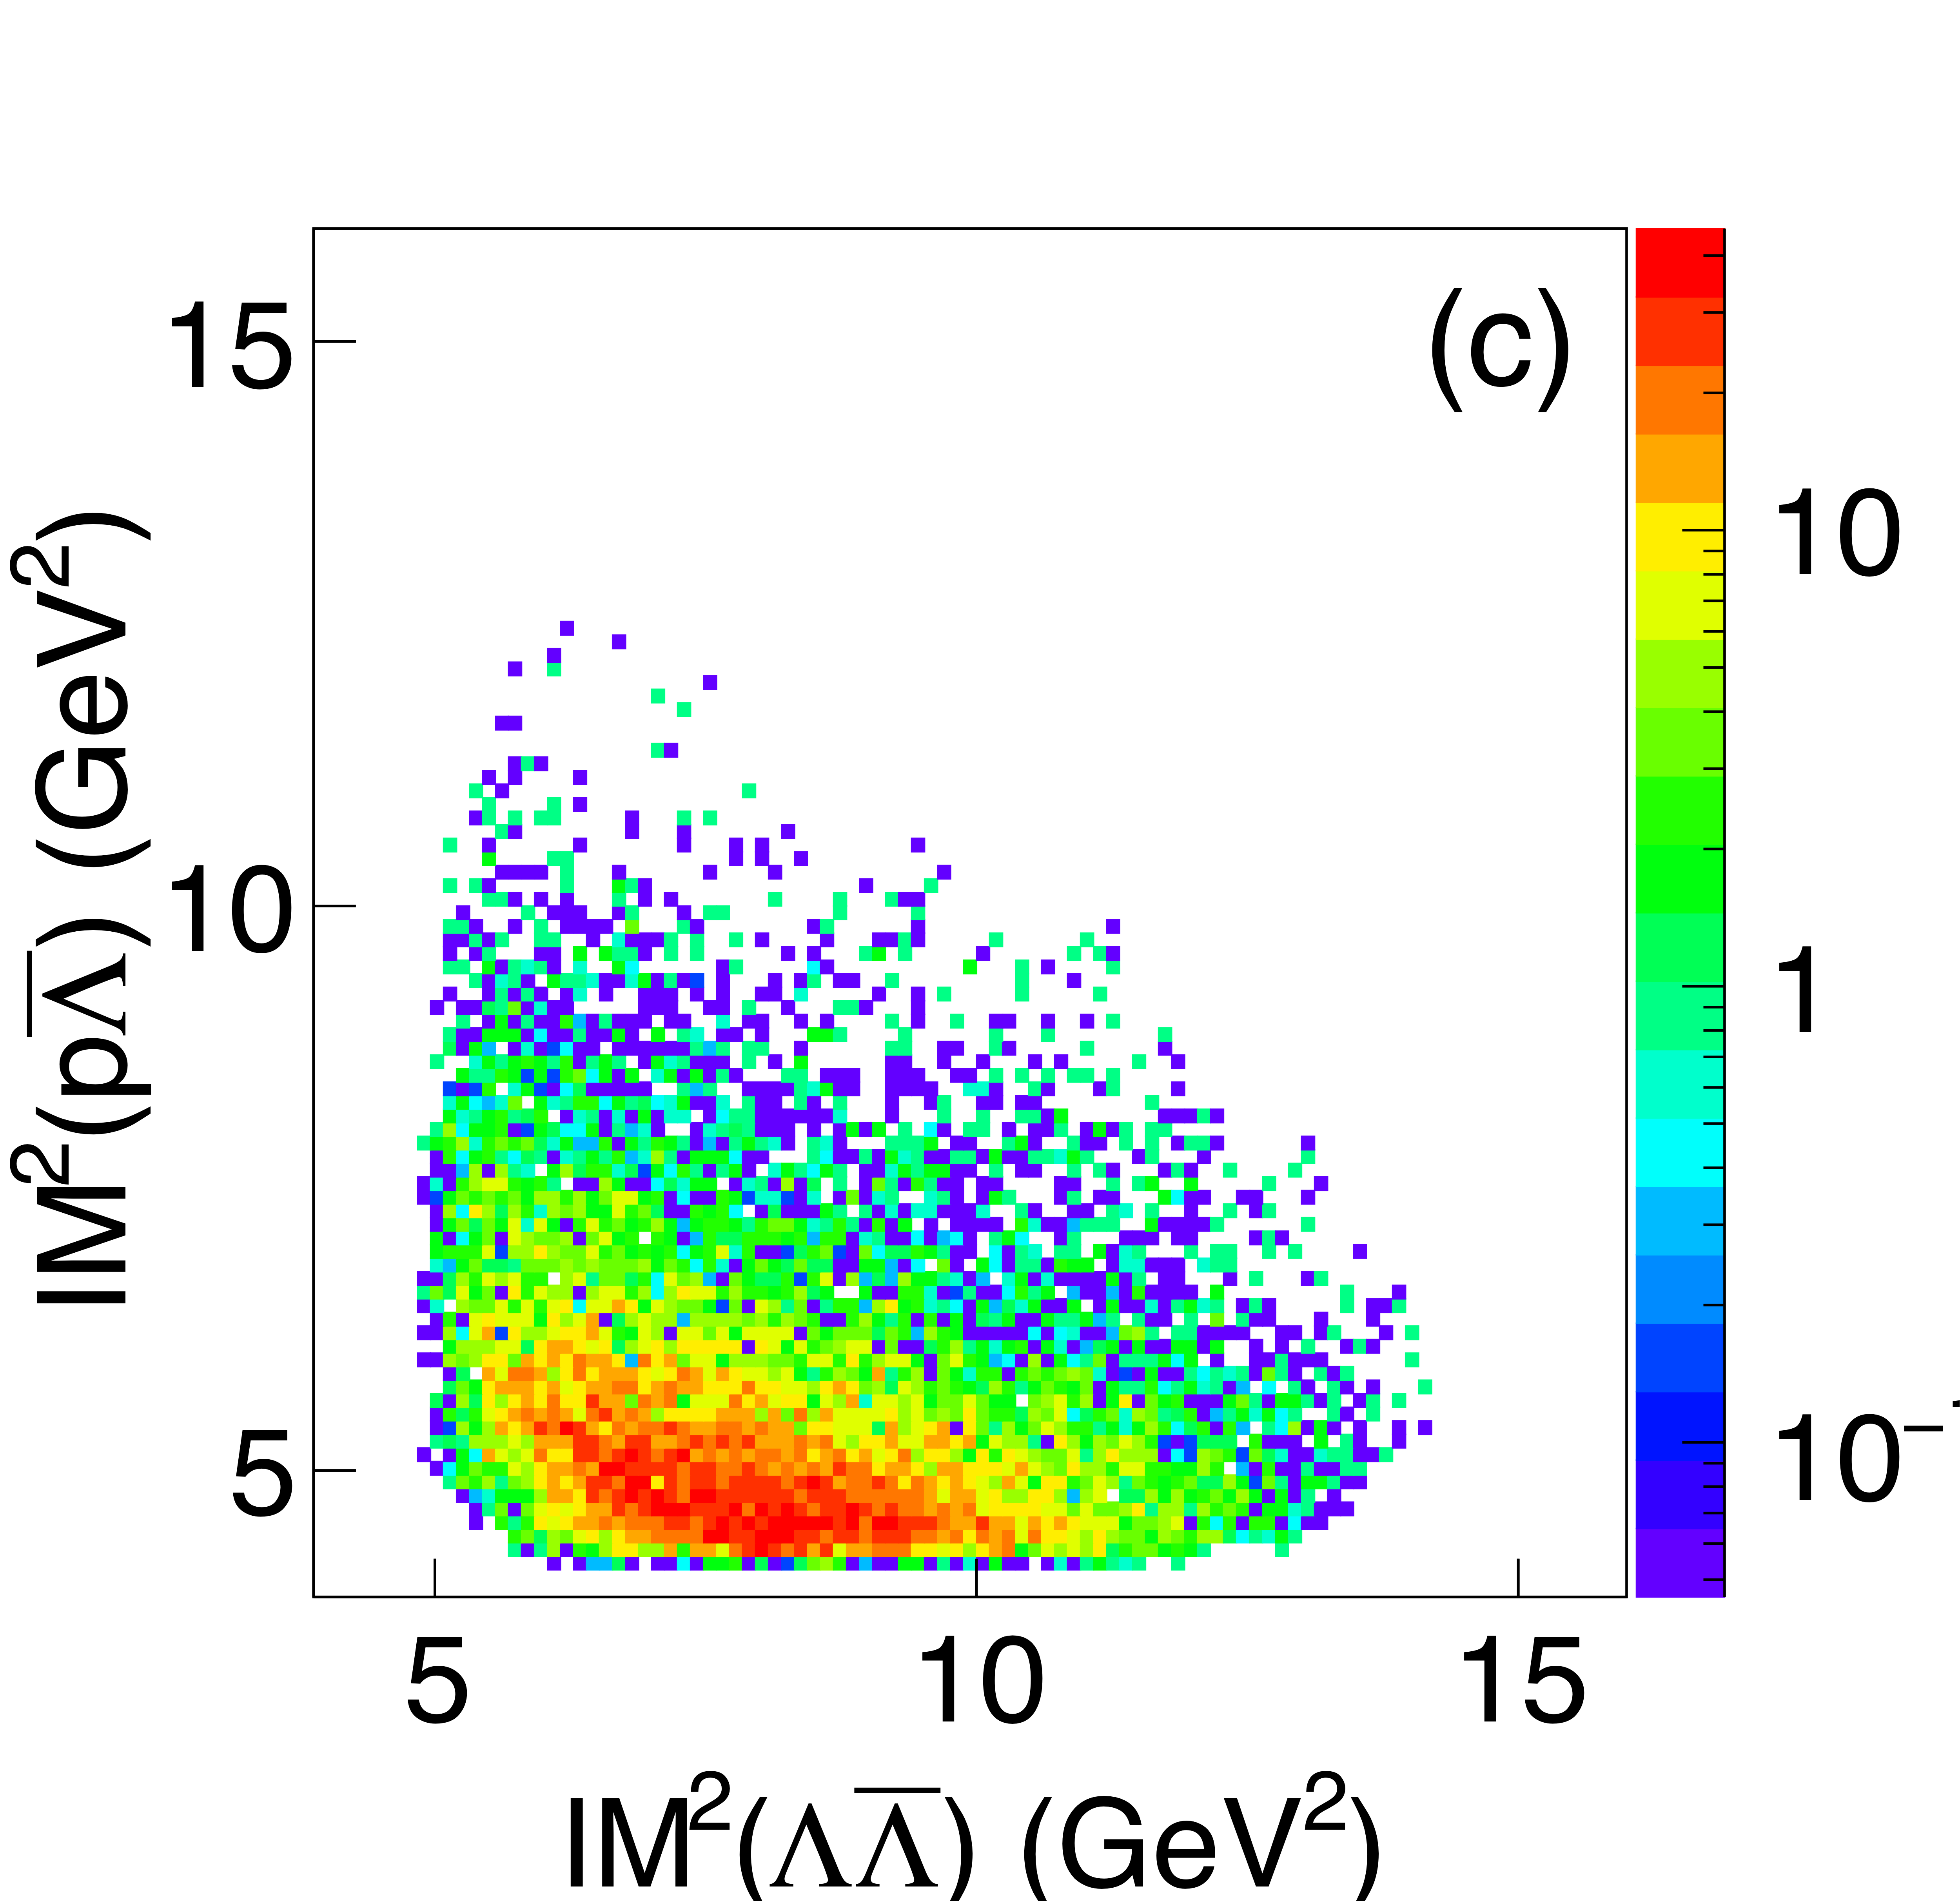
Figure 15a:
Dalitz plots for $\gamma p \rightarrow \Lambda\bar{\Lambda}p$ photoproduction for (a) GlueX data summed over the entire GlueX beam energy range, (b) data selected ($\omega<3.67$) for the case where $\Lambda\bar{\Lambda}$ system recoils against $p$, (c) data selected ($\omega>3.67$) for the case where $p\bar{\Lambda}$ system recoils against $\Lambda$ , and (d) three-body phase space MC. |
Phys. Rev. C113 (2026) 4, 045207: downloads png pdf |
Figure 15b:
Dalitz plots for $\gamma p \rightarrow \Lambda\bar{\Lambda}p$ photoproduction for (a) GlueX data summed over the entire GlueX beam energy range, (b) data selected ($\omega<3.67$) for the case where $\Lambda\bar{\Lambda}$ system recoils against $p$, (c) data selected ($\omega>3.67$) for the case where $p\bar{\Lambda}$ system recoils against $\Lambda$ , and (d) three-body phase space MC. |
Phys. Rev. C113 (2026) 4, 045207: downloads png pdf |
Figure 15c:
Dalitz plots for $\gamma p \rightarrow \Lambda\bar{\Lambda}p$ photoproduction for (a) GlueX data summed over the entire GlueX beam energy range, (b) data selected ($\omega<3.67$) for the case where $\Lambda\bar{\Lambda}$ system recoils against $p$, (c) data selected ($\omega>3.67$) for the case where $p\bar{\Lambda}$ system recoils against $\Lambda$ , and (d) three-body phase space MC. |
Phys. Rev. C113 (2026) 4, 045207: downloads png pdf |
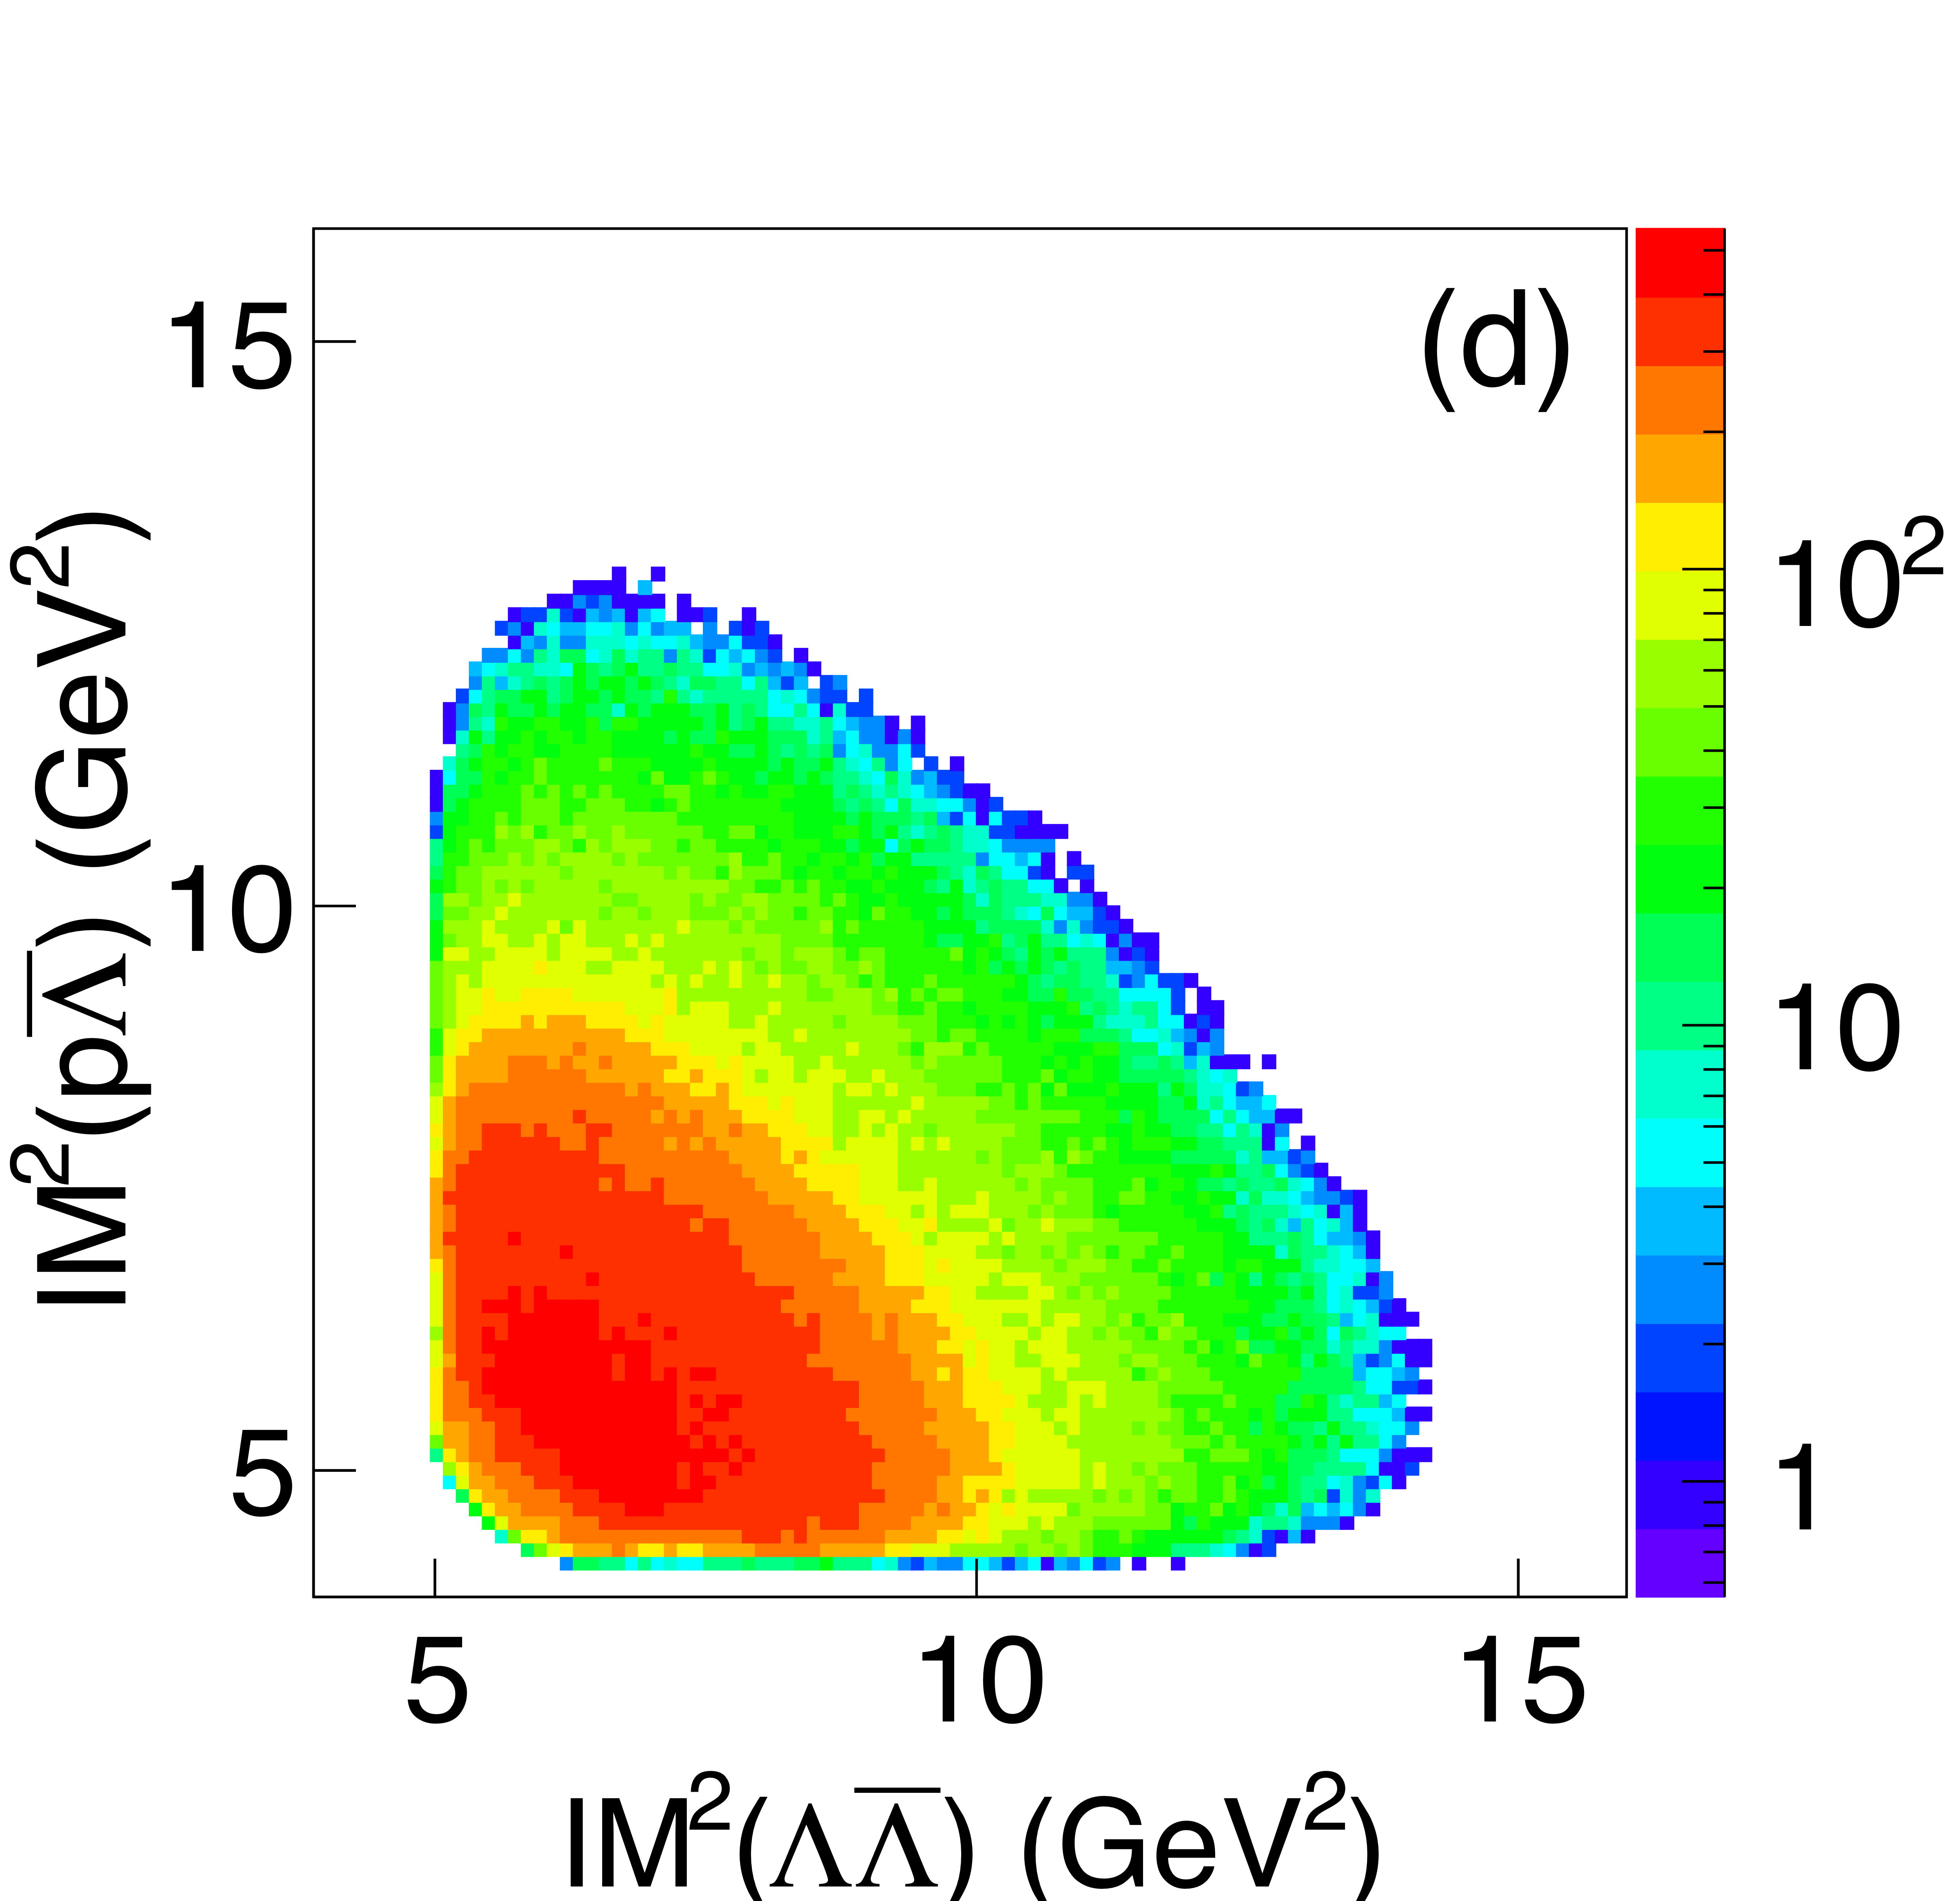
Figure 15d:
Dalitz plots for $\gamma p \rightarrow \Lambda\bar{\Lambda}p$ photoproduction for (a) GlueX data summed over the entire GlueX beam energy range, (b) data selected ($\omega<3.67$) for the case where $\Lambda\bar{\Lambda}$ system recoils against $p$, (c) data selected ($\omega>3.67$) for the case where $p\bar{\Lambda}$ system recoils against $\Lambda$ , and (d) three-body phase space MC. |
Phys. Rev. C113 (2026) 4, 045207: downloads png pdf |
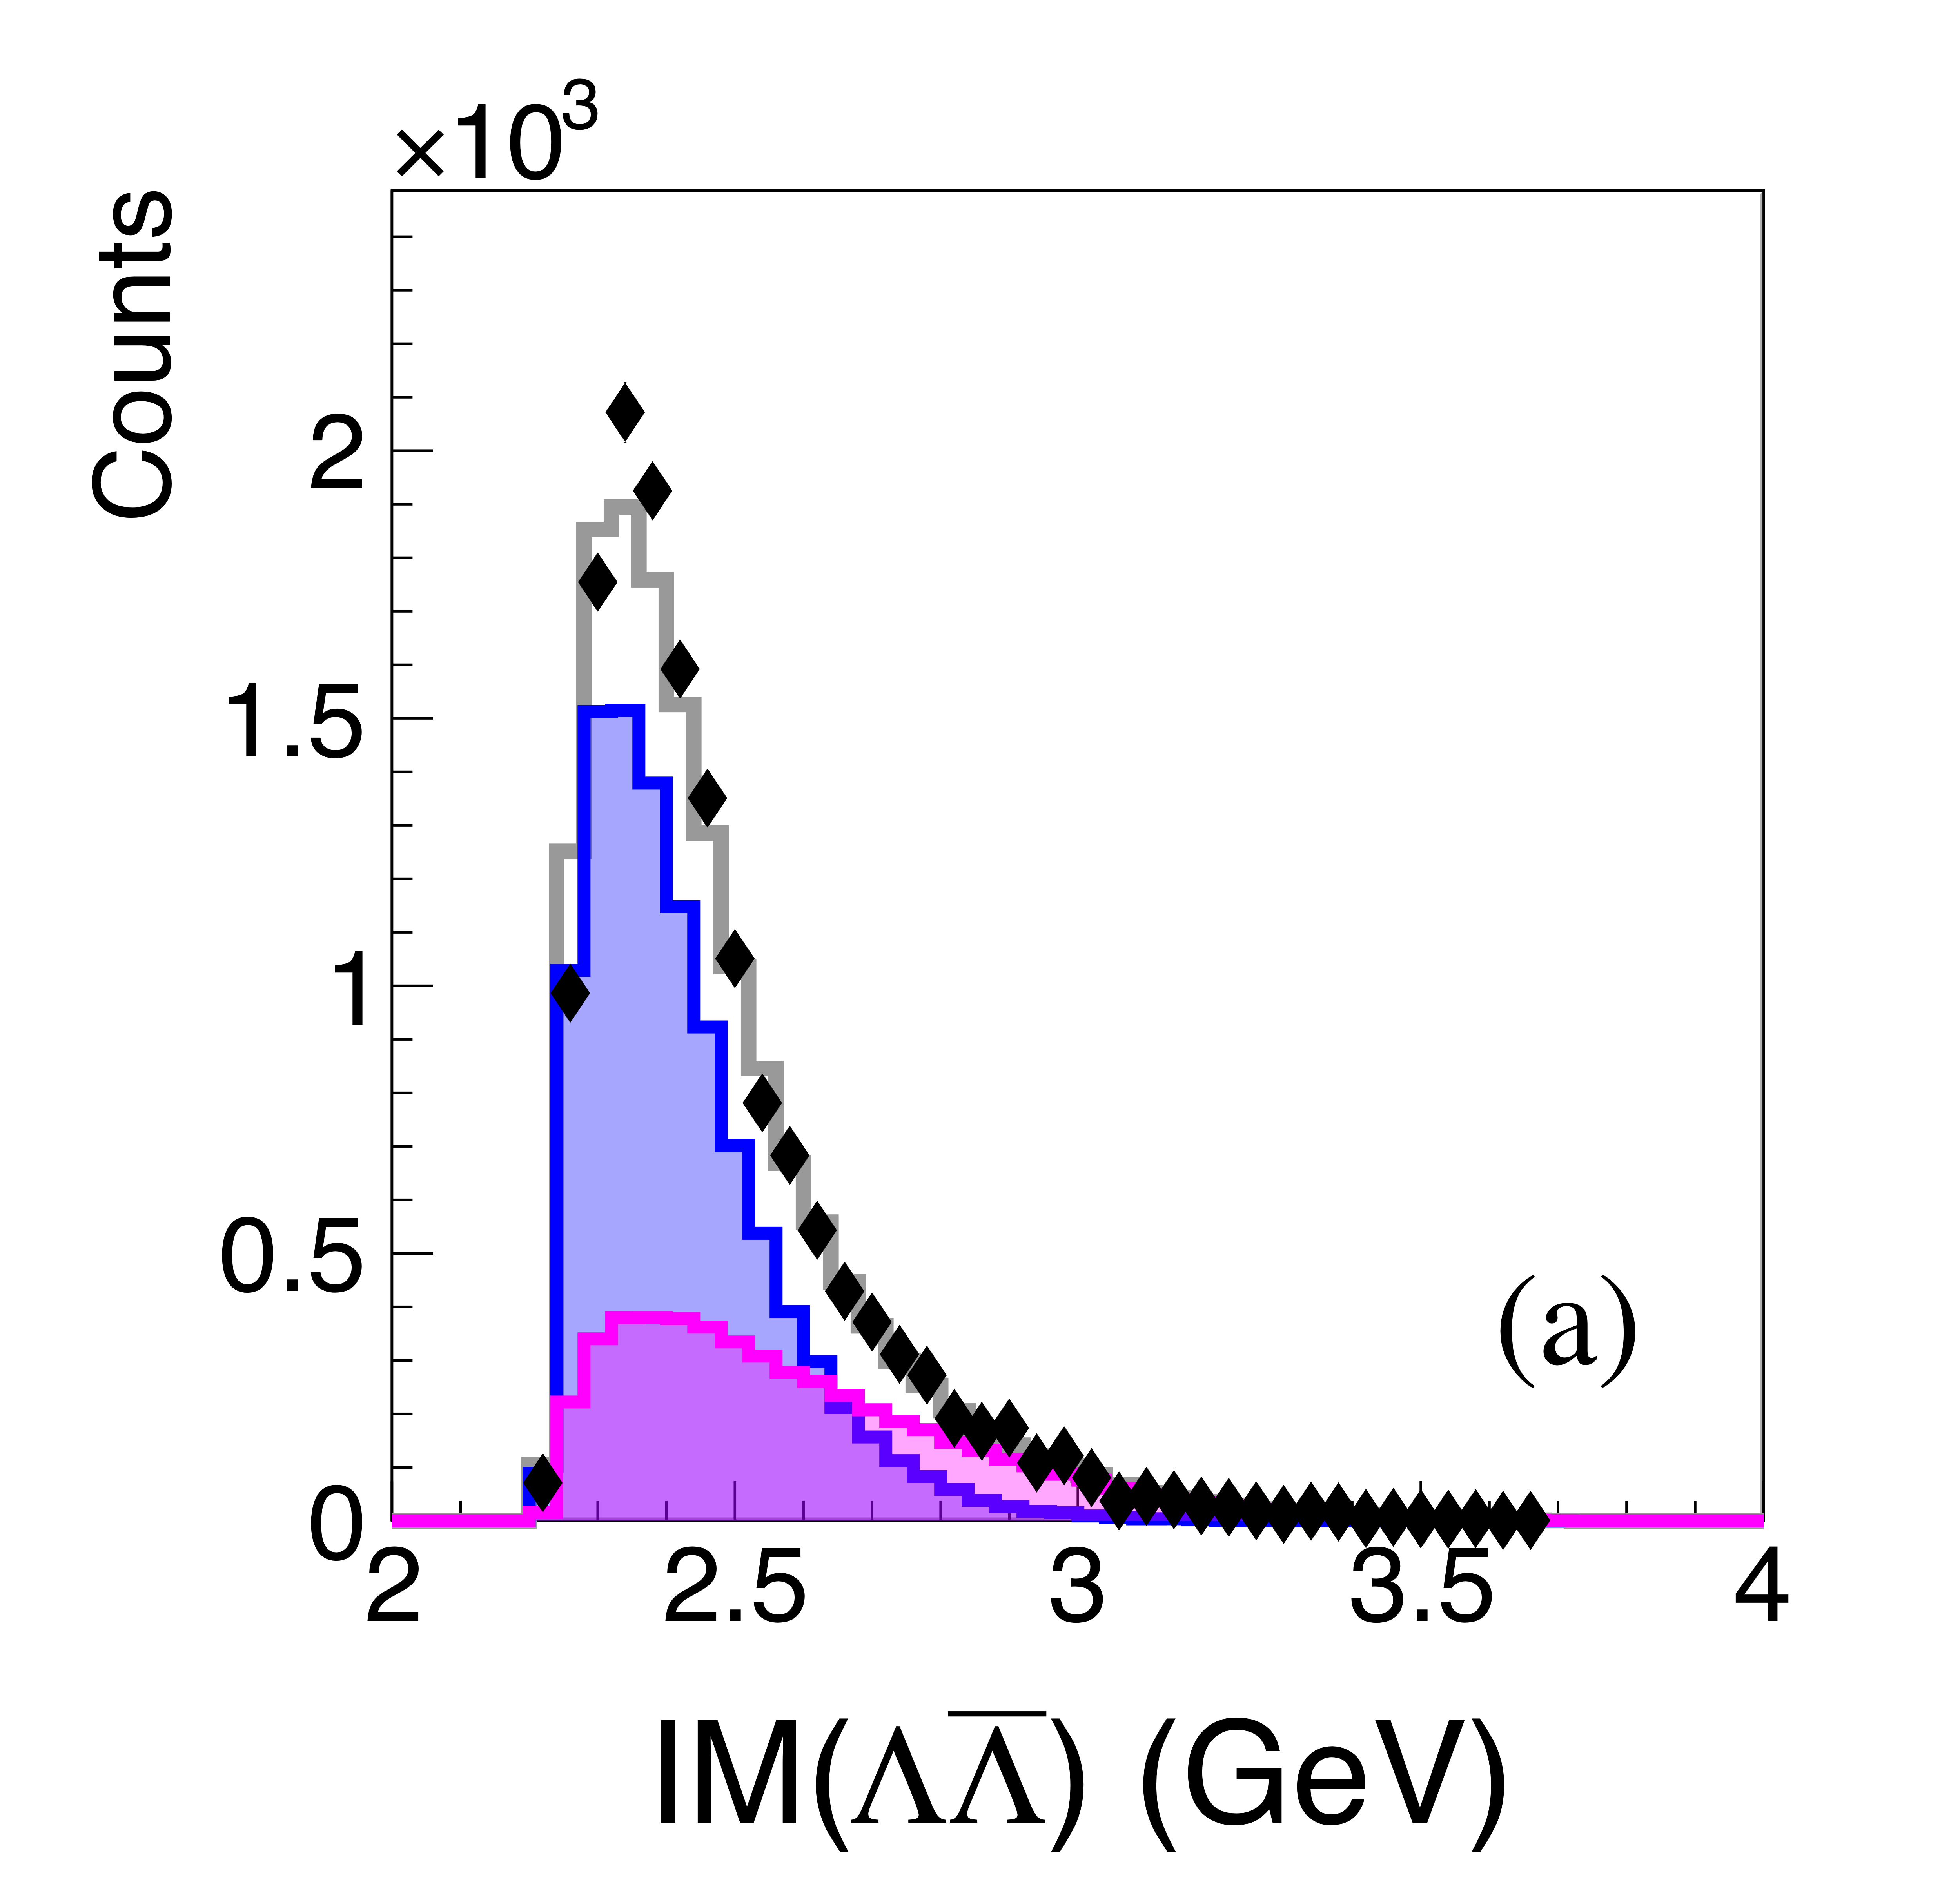
Figure 16a:
(a) Invariant mass of $\Lambda\bar{\Lambda}$ pairs for forward-going hyperon pairs (black points), together with model fits for the single exchange (blue) and double exchange (magenta) processes. (b) Pairings of the \bar{\Lambda} with the recoil proton. The distributions are not acceptance corrected. |
Phys. Rev. C113 (2026) 4, 045207: downloads png pdf |
Figure 16b:
(a) Invariant mass of $\Lambda\bar{\Lambda}$ pairs for forward-going hyperon pairs (black points), together with model fits for the single exchange (blue) and double exchange (magenta) processes. (b) Pairings of the \bar{\Lambda} with the recoil proton. The distributions are not acceptance corrected. |
Phys. Rev. C113 (2026) 4, 045207: downloads png pdf |
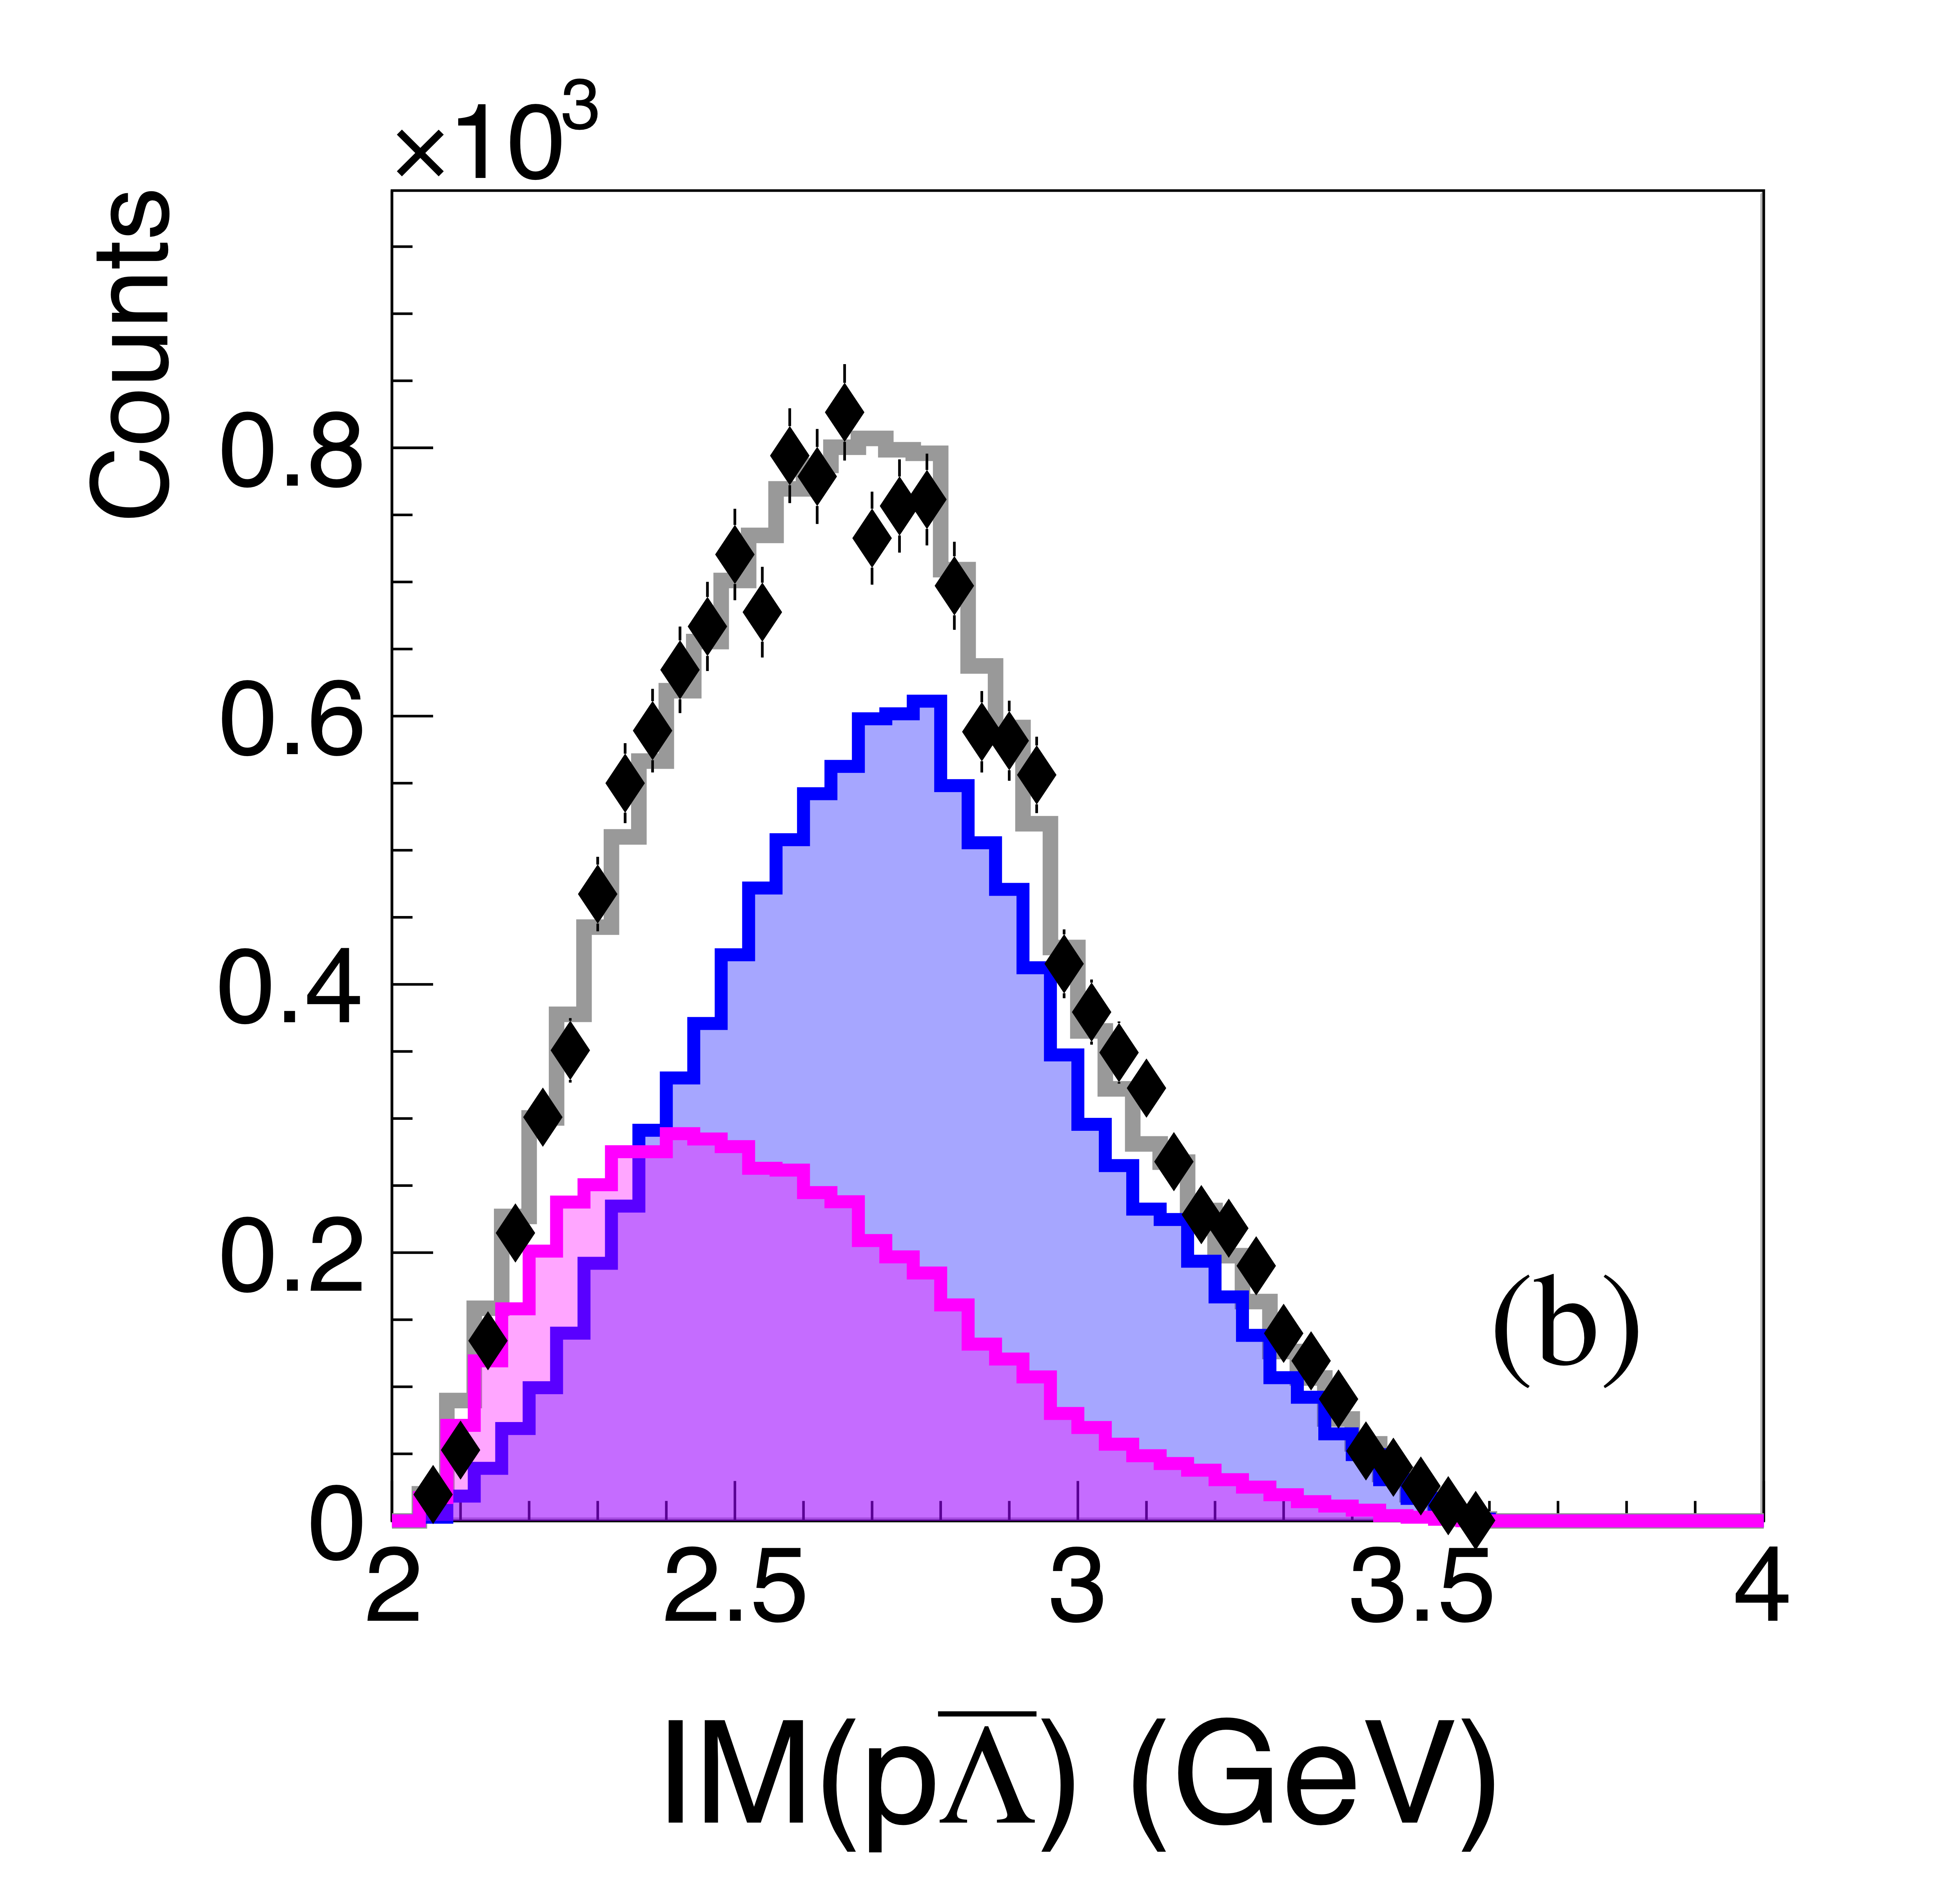
Figure 17a:
(a) Invariant mass of $p\bar{\Lambda}$ pairs for the more forward proton (black points), together with model fits for the single exchange (blue) and double exchange (magenta) processes. (b) Pairings with the more backward proton. The distributions are not acceptance corrected. |
Phys. Rev. C113 (2026) 4, 045207: downloads png pdf |
Figure 17b:
(a) Invariant mass of $p\bar{\Lambda}$ pairs for the more forward proton (black points), together with model fits for the single exchange (blue) and double exchange (magenta) processes. (b) Pairings with the more backward proton. The distributions are not acceptance corrected. |
Phys. Rev. C113 (2026) 4, 045207: downloads png pdf |
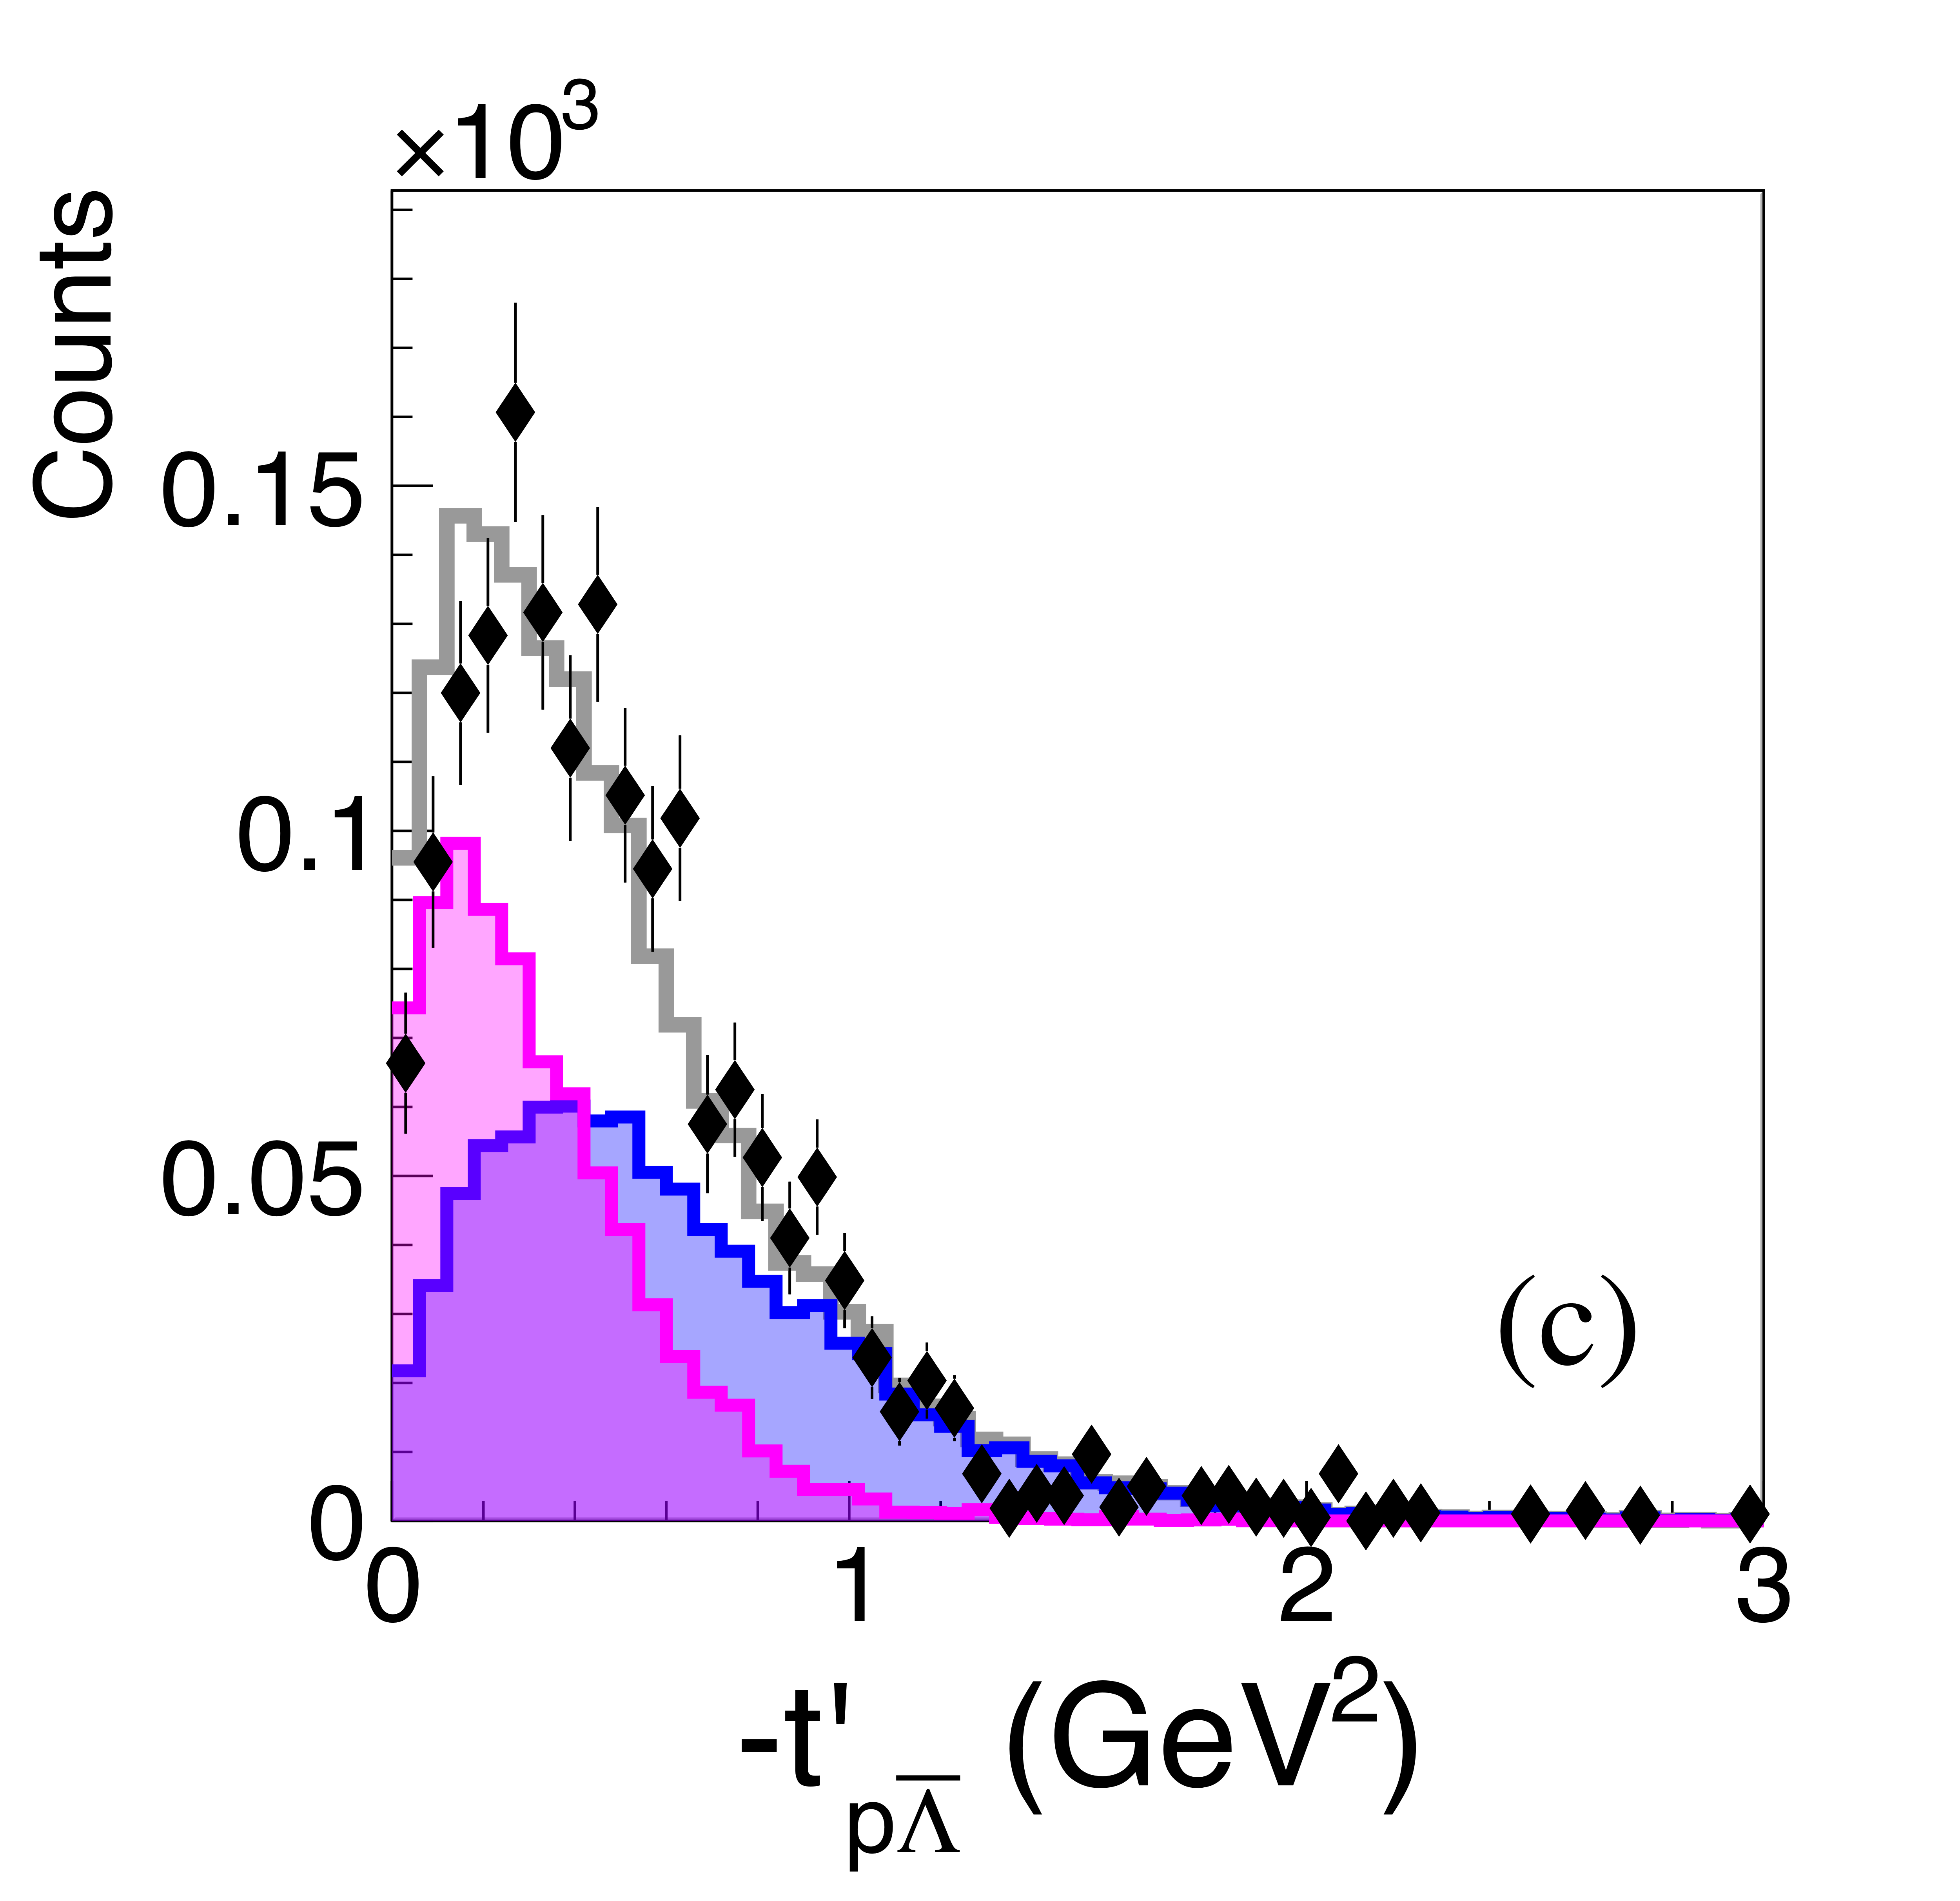
Figure 18a:
io Comparison between data and model distributions of the reduced 4-momentum transfer, $t^{\prime}$, from beam photon to the target proton (Eq. 16), summed over all beam energies. (a) $p\bar{p}$ pairs recoiling against $p$, (b) $\Lambda\bar{\Lambda}$ pairs recoiling against $p$, and (c) $p\bar{\Lambda}$ pairs recoiling against $\Lambda$. The model component colors are as in Fig. 7 These distributions are not acceptance corrected. |
Phys. Rev. C113 (2026) 4, 045207: downloads png pdf |
Figure 18b:
io Comparison between data and model distributions of the reduced 4-momentum transfer, $t^{\prime}$, from beam photon to the target proton (Eq. 16), summed over all beam energies. (a) $p\bar{p}$ pairs recoiling against $p$, (b) $\Lambda\bar{\Lambda}$ pairs recoiling against $p$, and (c) $p\bar{\Lambda}$ pairs recoiling against $\Lambda$. The model component colors are as in Fig. 7 These distributions are not acceptance corrected. |
Phys. Rev. C113 (2026) 4, 045207: downloads png pdf |
Figure 18c:
io Comparison between data and model distributions of the reduced 4-momentum transfer, $t^{\prime}$, from beam photon to the target proton (Eq. 16), summed over all beam energies. (a) $p\bar{p}$ pairs recoiling against $p$, (b) $\Lambda\bar{\Lambda}$ pairs recoiling against $p$, and (c) $p\bar{\Lambda}$ pairs recoiling against $\Lambda$. The model component colors are as in Fig. 7 These distributions are not acceptance corrected. |
Phys. Rev. C113 (2026) 4, 045207: downloads png pdf |
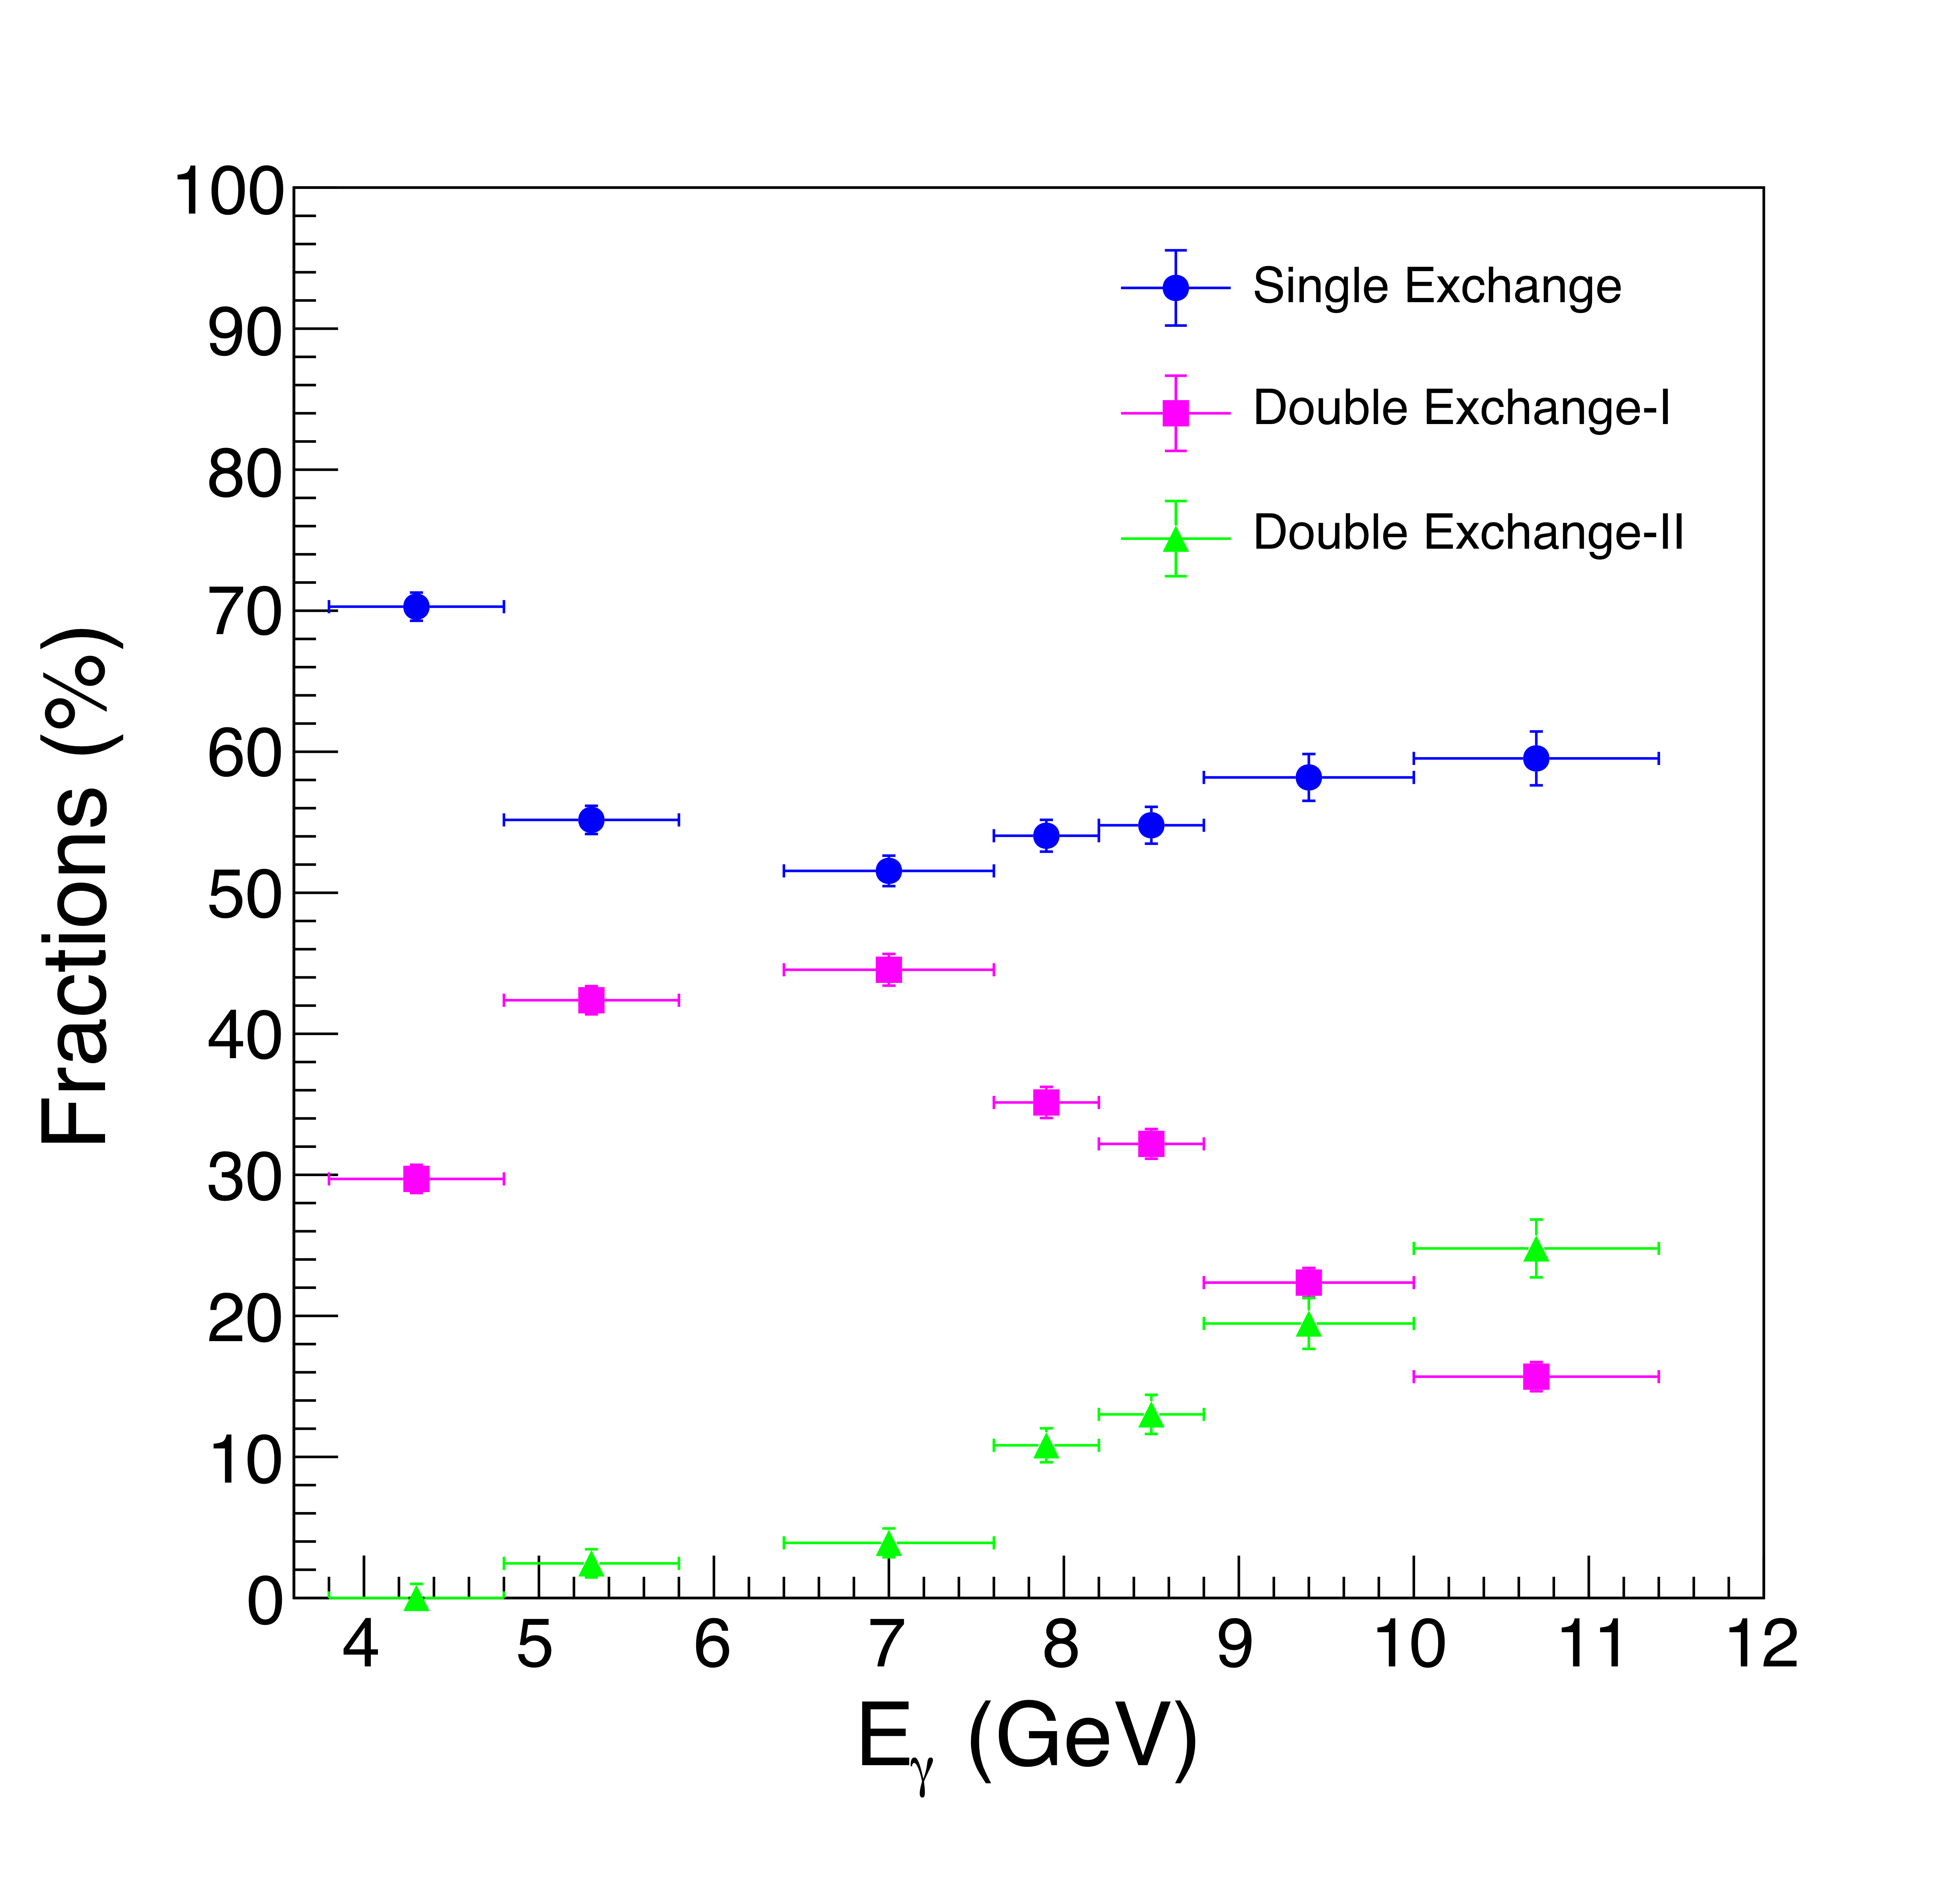
Figure 19:
The proportions of the reaction mechanism components describing the $p\bar{p}$ photoproduction reaction as a function of beam energy, Single Exchange (blue), Double Exchange-I (magenta), and Double Exchange-II (green). |
Phys. Rev. C113 (2026) 4, 045207: downloads png pdf |
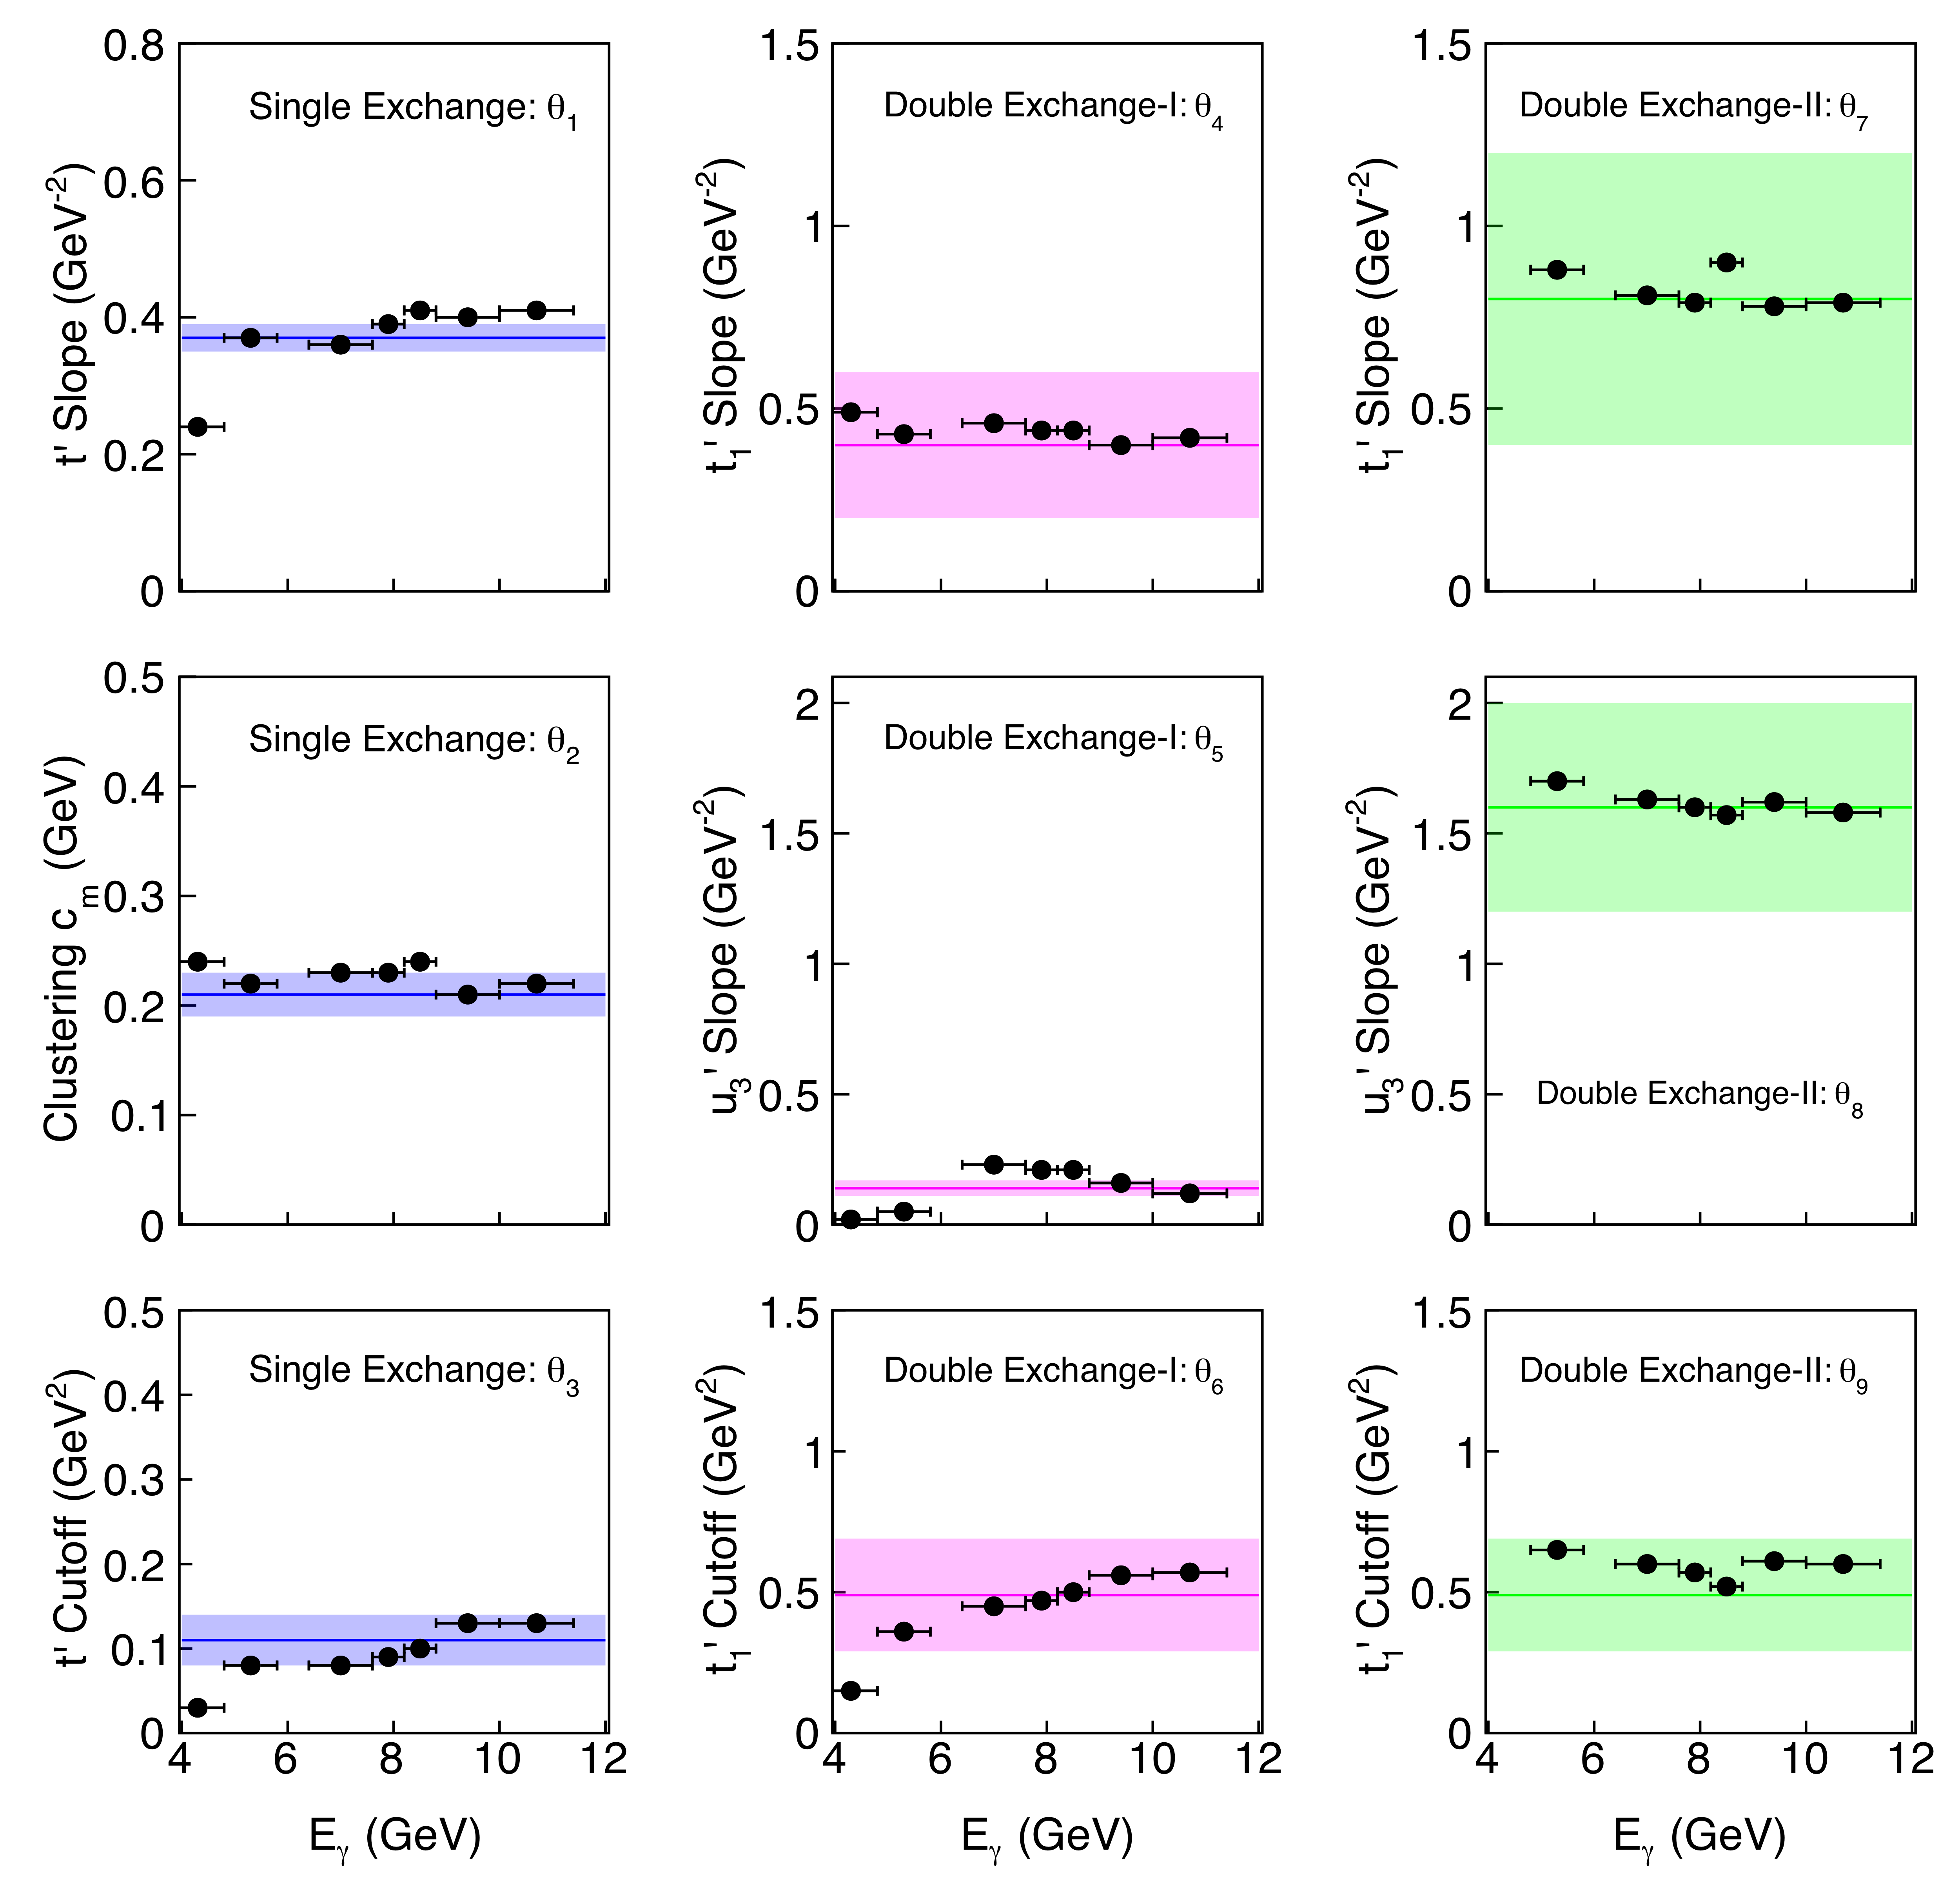
Figure 20:
Beam energy dependence of the nine $p\bar{p}$ combined model parameters. Left column, ($\theta_1$, $\theta_2$, $\theta_3$) for the single exchange component, depicted in black solid circle markers. Middle column, Double Exchange-I ($\theta_4$, $\theta_5$, $\theta_6$). Right column, Double Exchange-II ($\theta_7$, $\theta_8$, $\theta_9$). The colored bands summarize the global fit values and the estimated global fit uncertainties from Table I for the whole GlueX energy range. |
Phys. Rev. C113 (2026) 4, 045207: downloads png pdf |
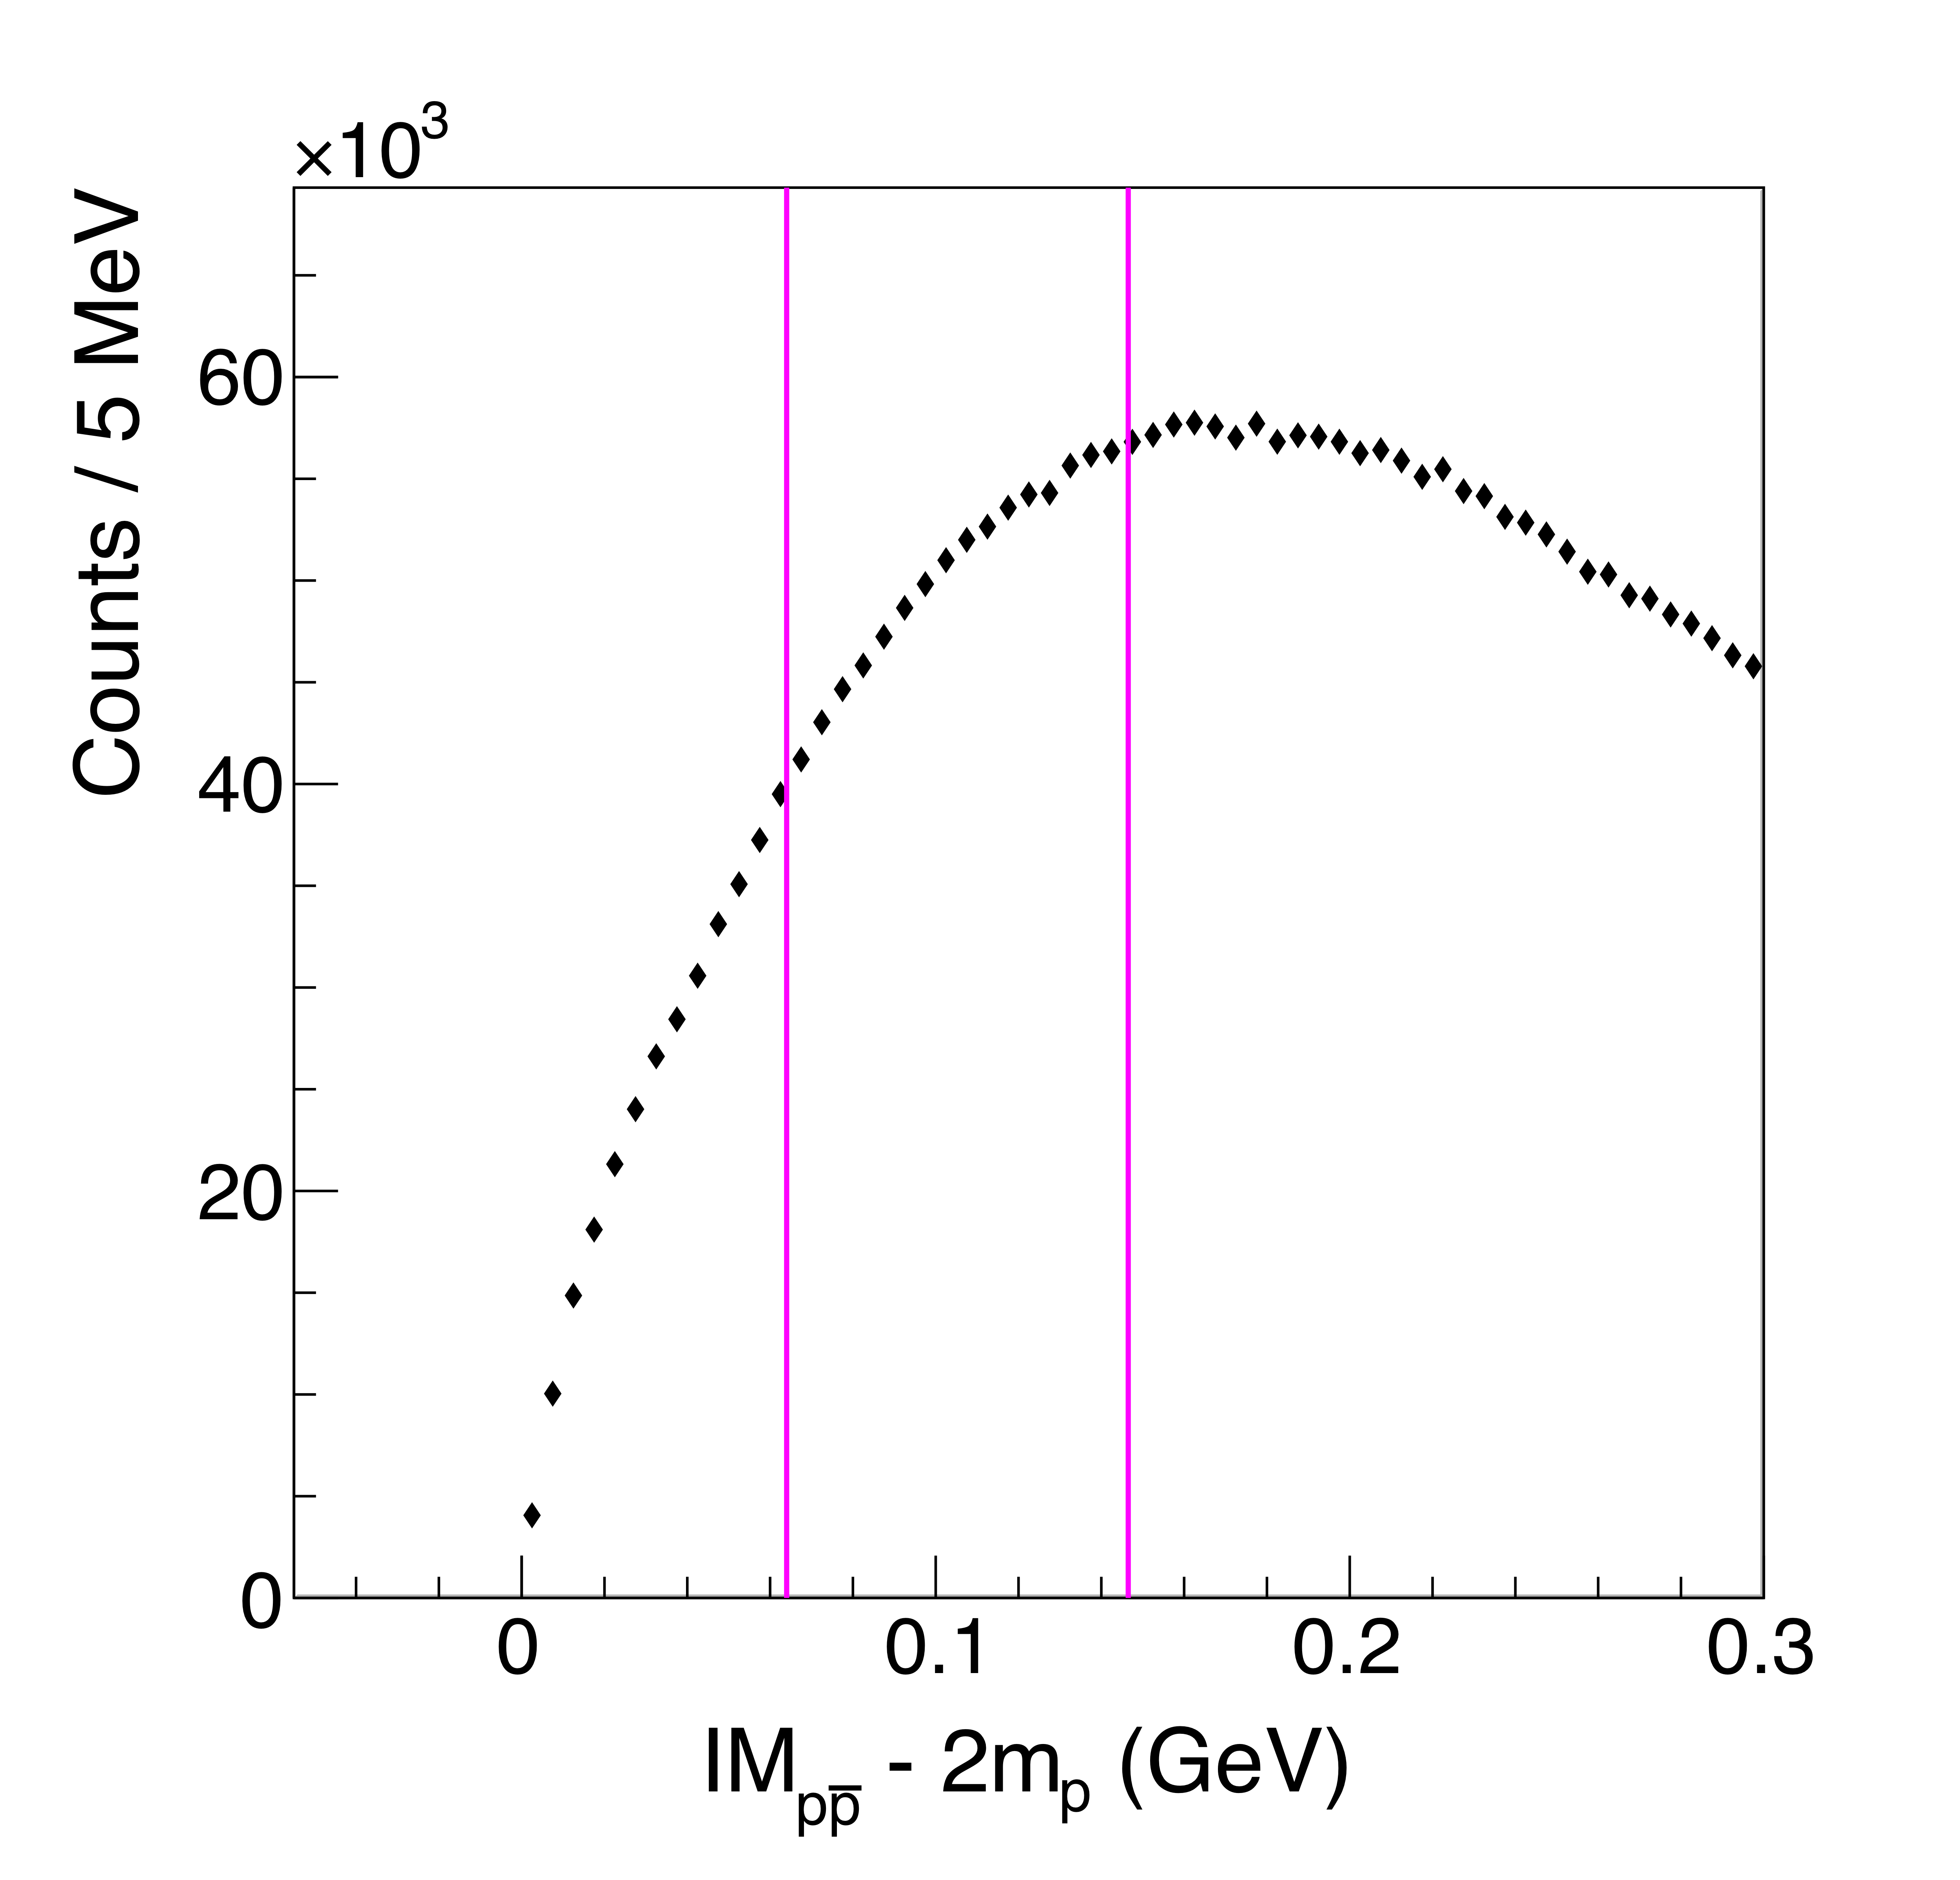
Figure 21:
Events per 5 MeV mass bin versus $p\bar{p}$ invariant mass for diffractively created pairs. The GlueX mass resolution for the forward-going $p\bar{p}$ system is $3-5$ MeV in this region. The threshold mass of $2m_p$ is subtracted. The vertical magenta lines indicate where previous measurements (DESY \cite{Bodenkamp,1984dg}) suggested that narrow peaks may occur. |
Phys. Rev. C113 (2026) 4, 045207: downloads png pdf |
Figure 22:
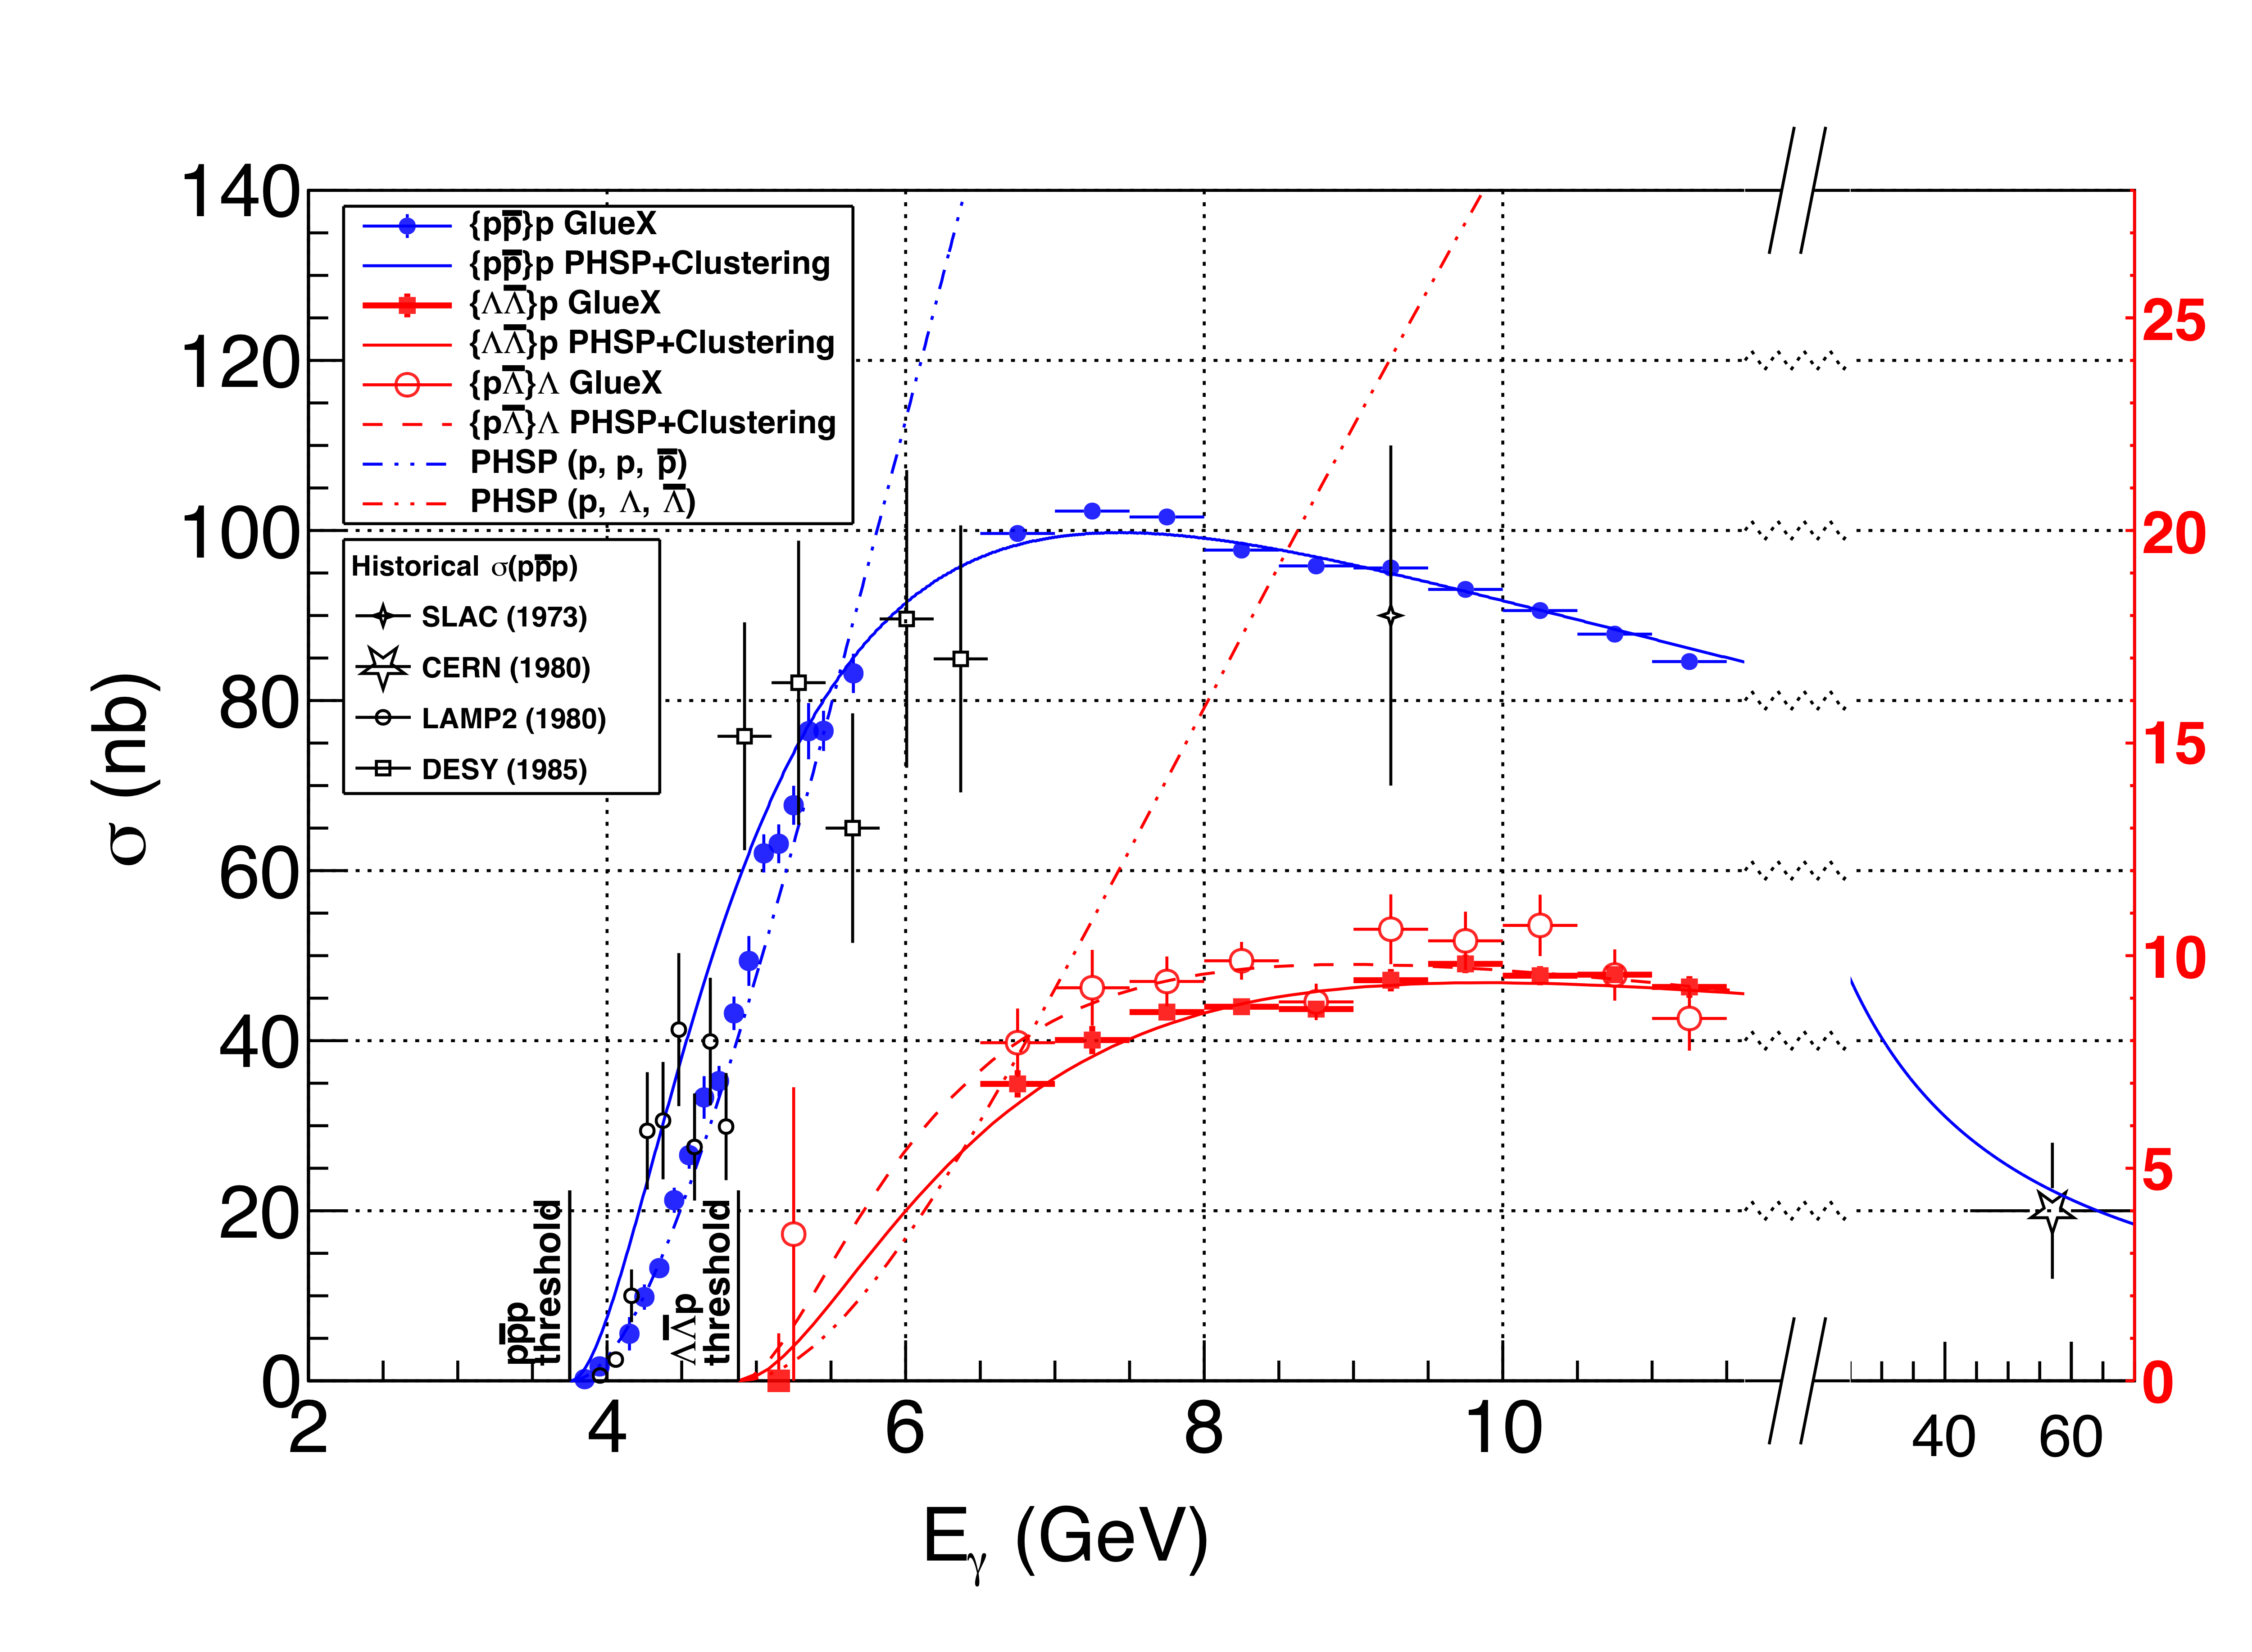
Total photoproduction cross sections off the proton, as a function of beam energy, for the $\{$p\bar{p}$\}$ (blue circles), $\{ \Lambda\bar{\Lambda} \}$(red squares), and $\{p \bar{\Lambda}\}$ (open red circles) systems. The red axis on the right corresponds to the red data points and curves in the figure, while the black axis on the left corresponds to all other data points and curves. The error bars show the statistical uncertainties only. Comparison is made to a selection of previous $\{$p\bar{p}$\}$ measurements from Daresbury (open circles) \cite{Barber,1979ah}, DESY \cite{Bodenkamp,1984dg} (open squares), SLAC \cite{Bingham,1973fu} (4-point star) and CERN \cite{Aston,1980gri} (5-point star). The curves represent the behavior of the total cross section modeled with the simplified picture (Eq. 16), for each reaction channel, $p\bar{p}$ (solid blue), $\Lambda\bar{\Lambda}$ (solid red), and ${p \bar{\Lambda}}$ (dashed red). The blue model curve for the $p\bar{p}$ channel also includes an extrapolation to the high energy datum from CERN. As a reference, the dotted-dashed curves illustrate integrated 3-body phase space (Eq. A13) for the $pp\bar{p}$ (blue) and $p\Lambda\bar{\Lambda}$ (red) final states. |
Phys. Rev. C113 (2026) 4, 045207: downloads png pdf |
Figure 23:
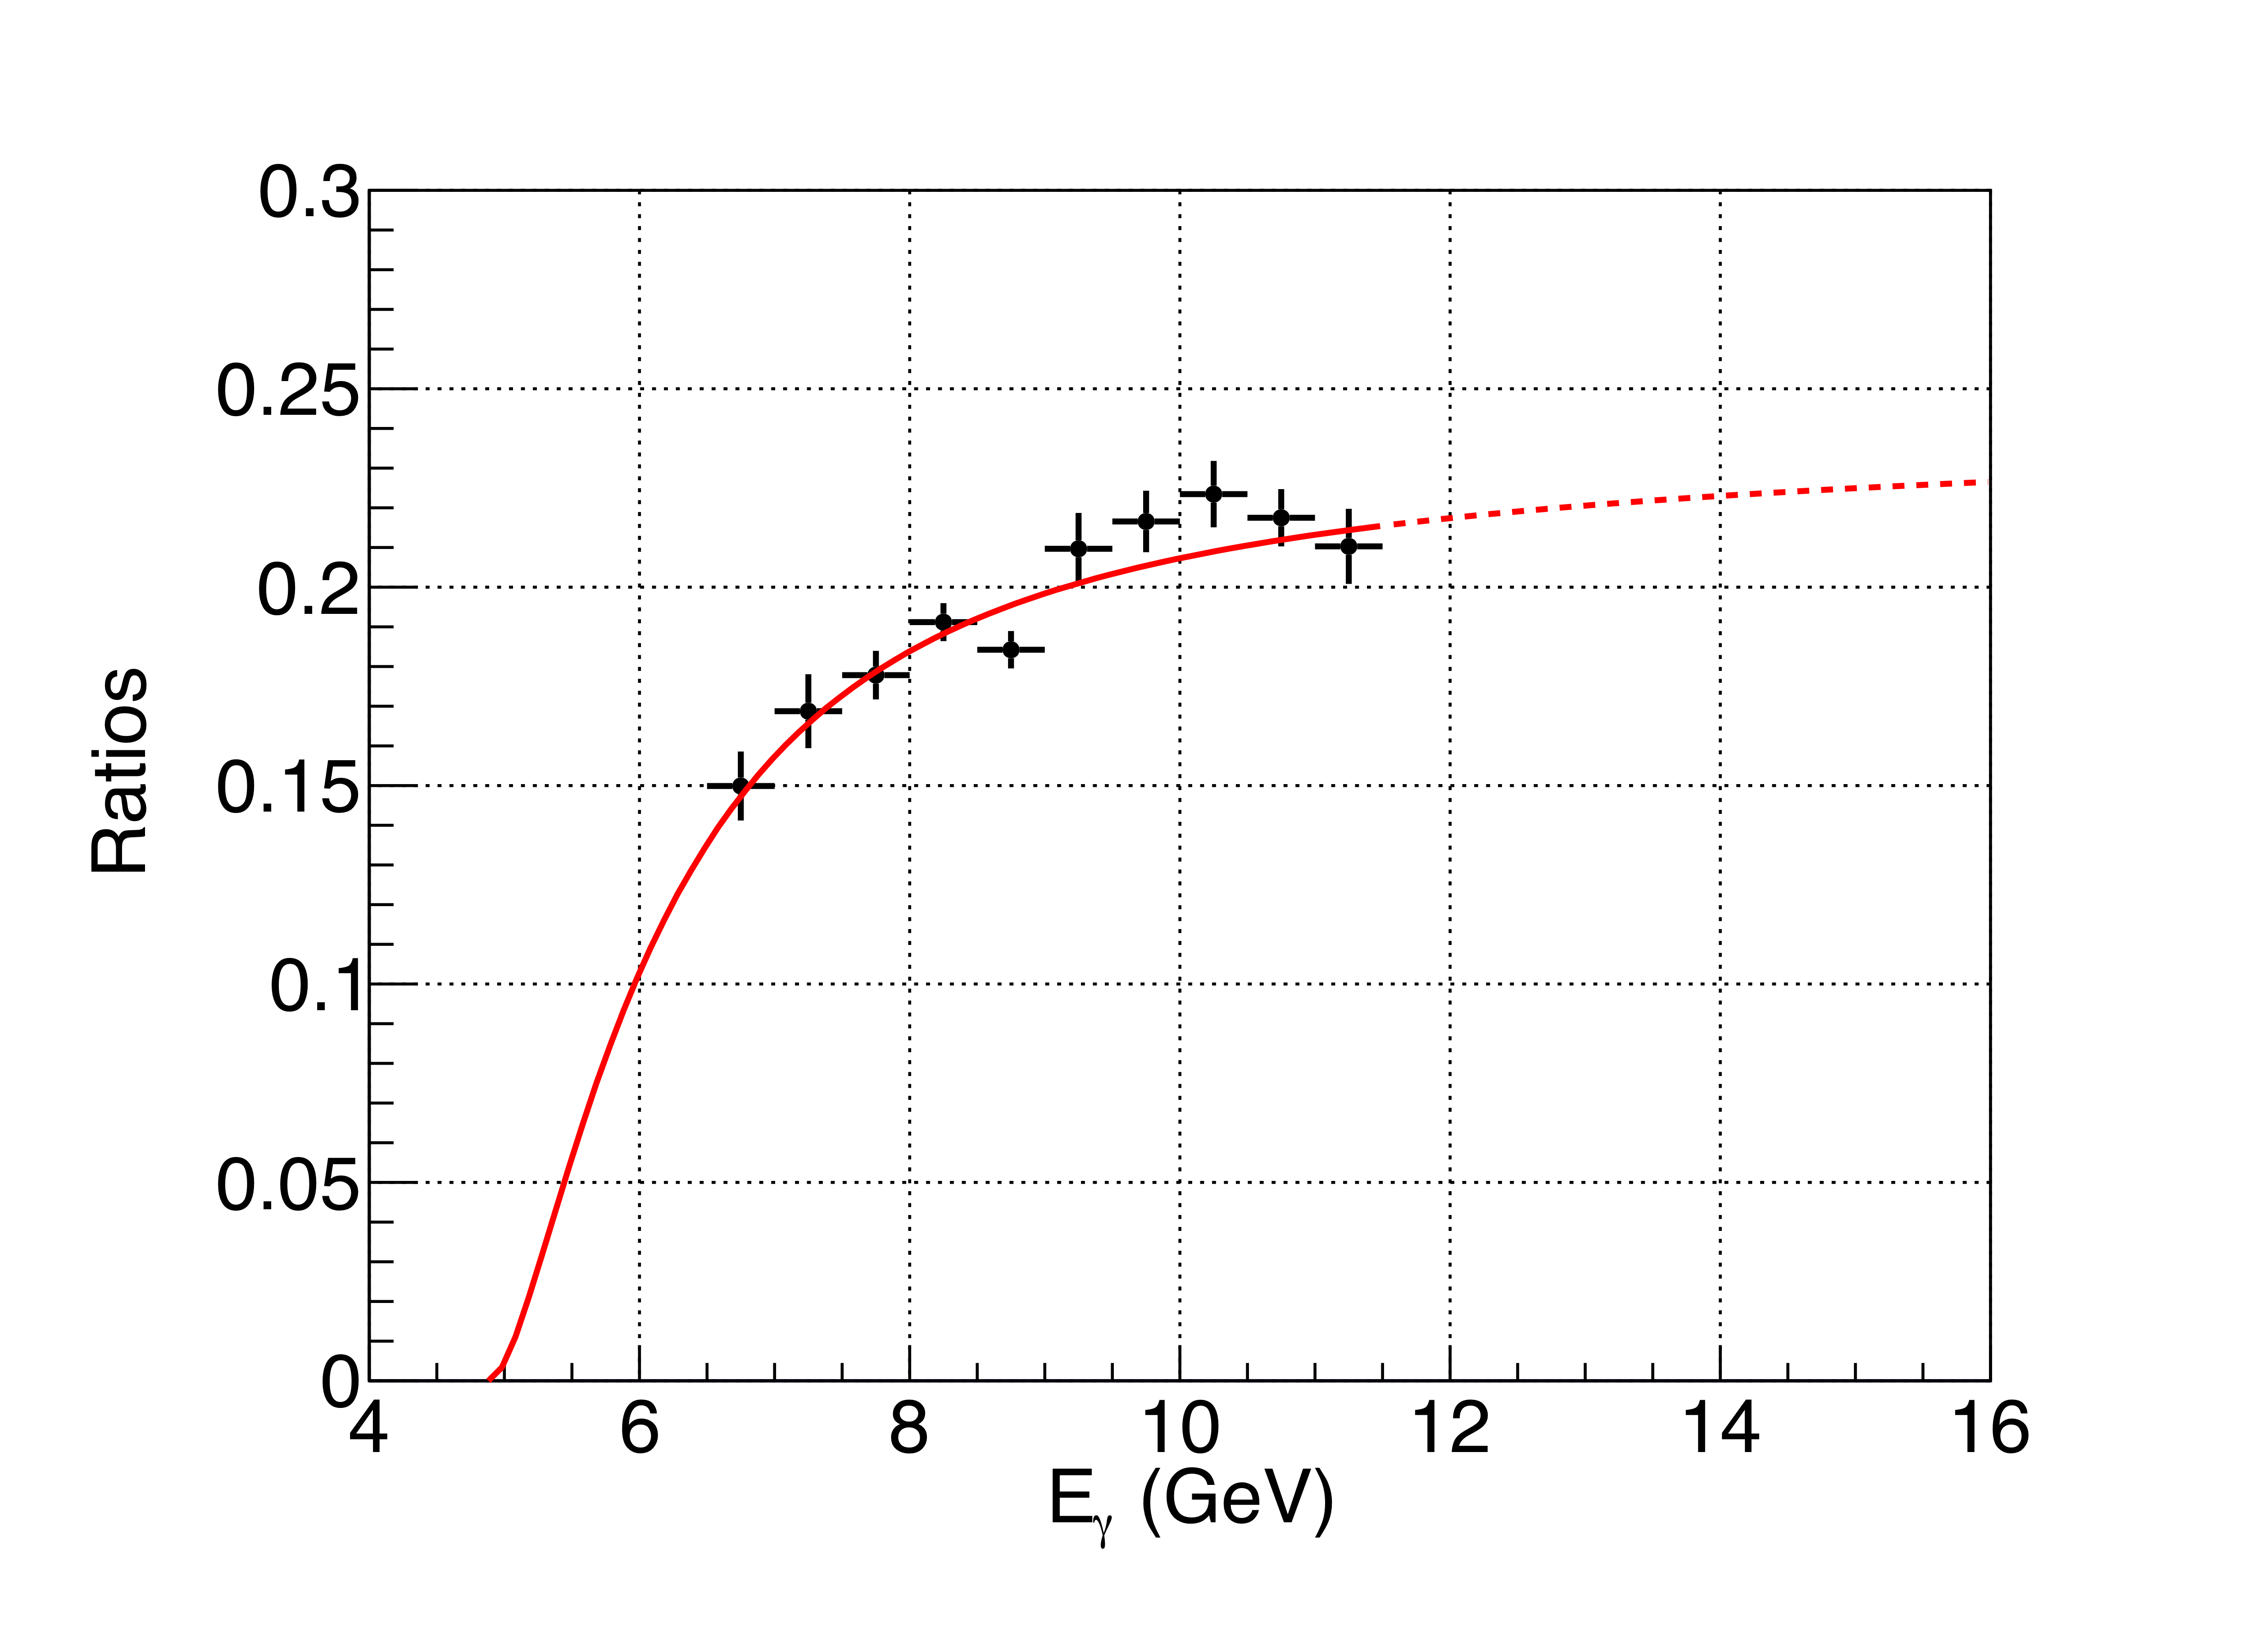
Comparison of the total cross section measurement ratios. Data points show the ratio between strange (sum of the $\Lambda\bar{\Lambda}$ and $p\bar{\Lambda}$ production) and non-strange ($p\bar{p}$) production cross sections; the red line depicts the computed ratio using our total cross section calculations. The dotted line is an extrapolation to unmeasured energies. |
Phys. Rev. C113 (2026) 4, 045207: downloads png pdf |
Figure 24:
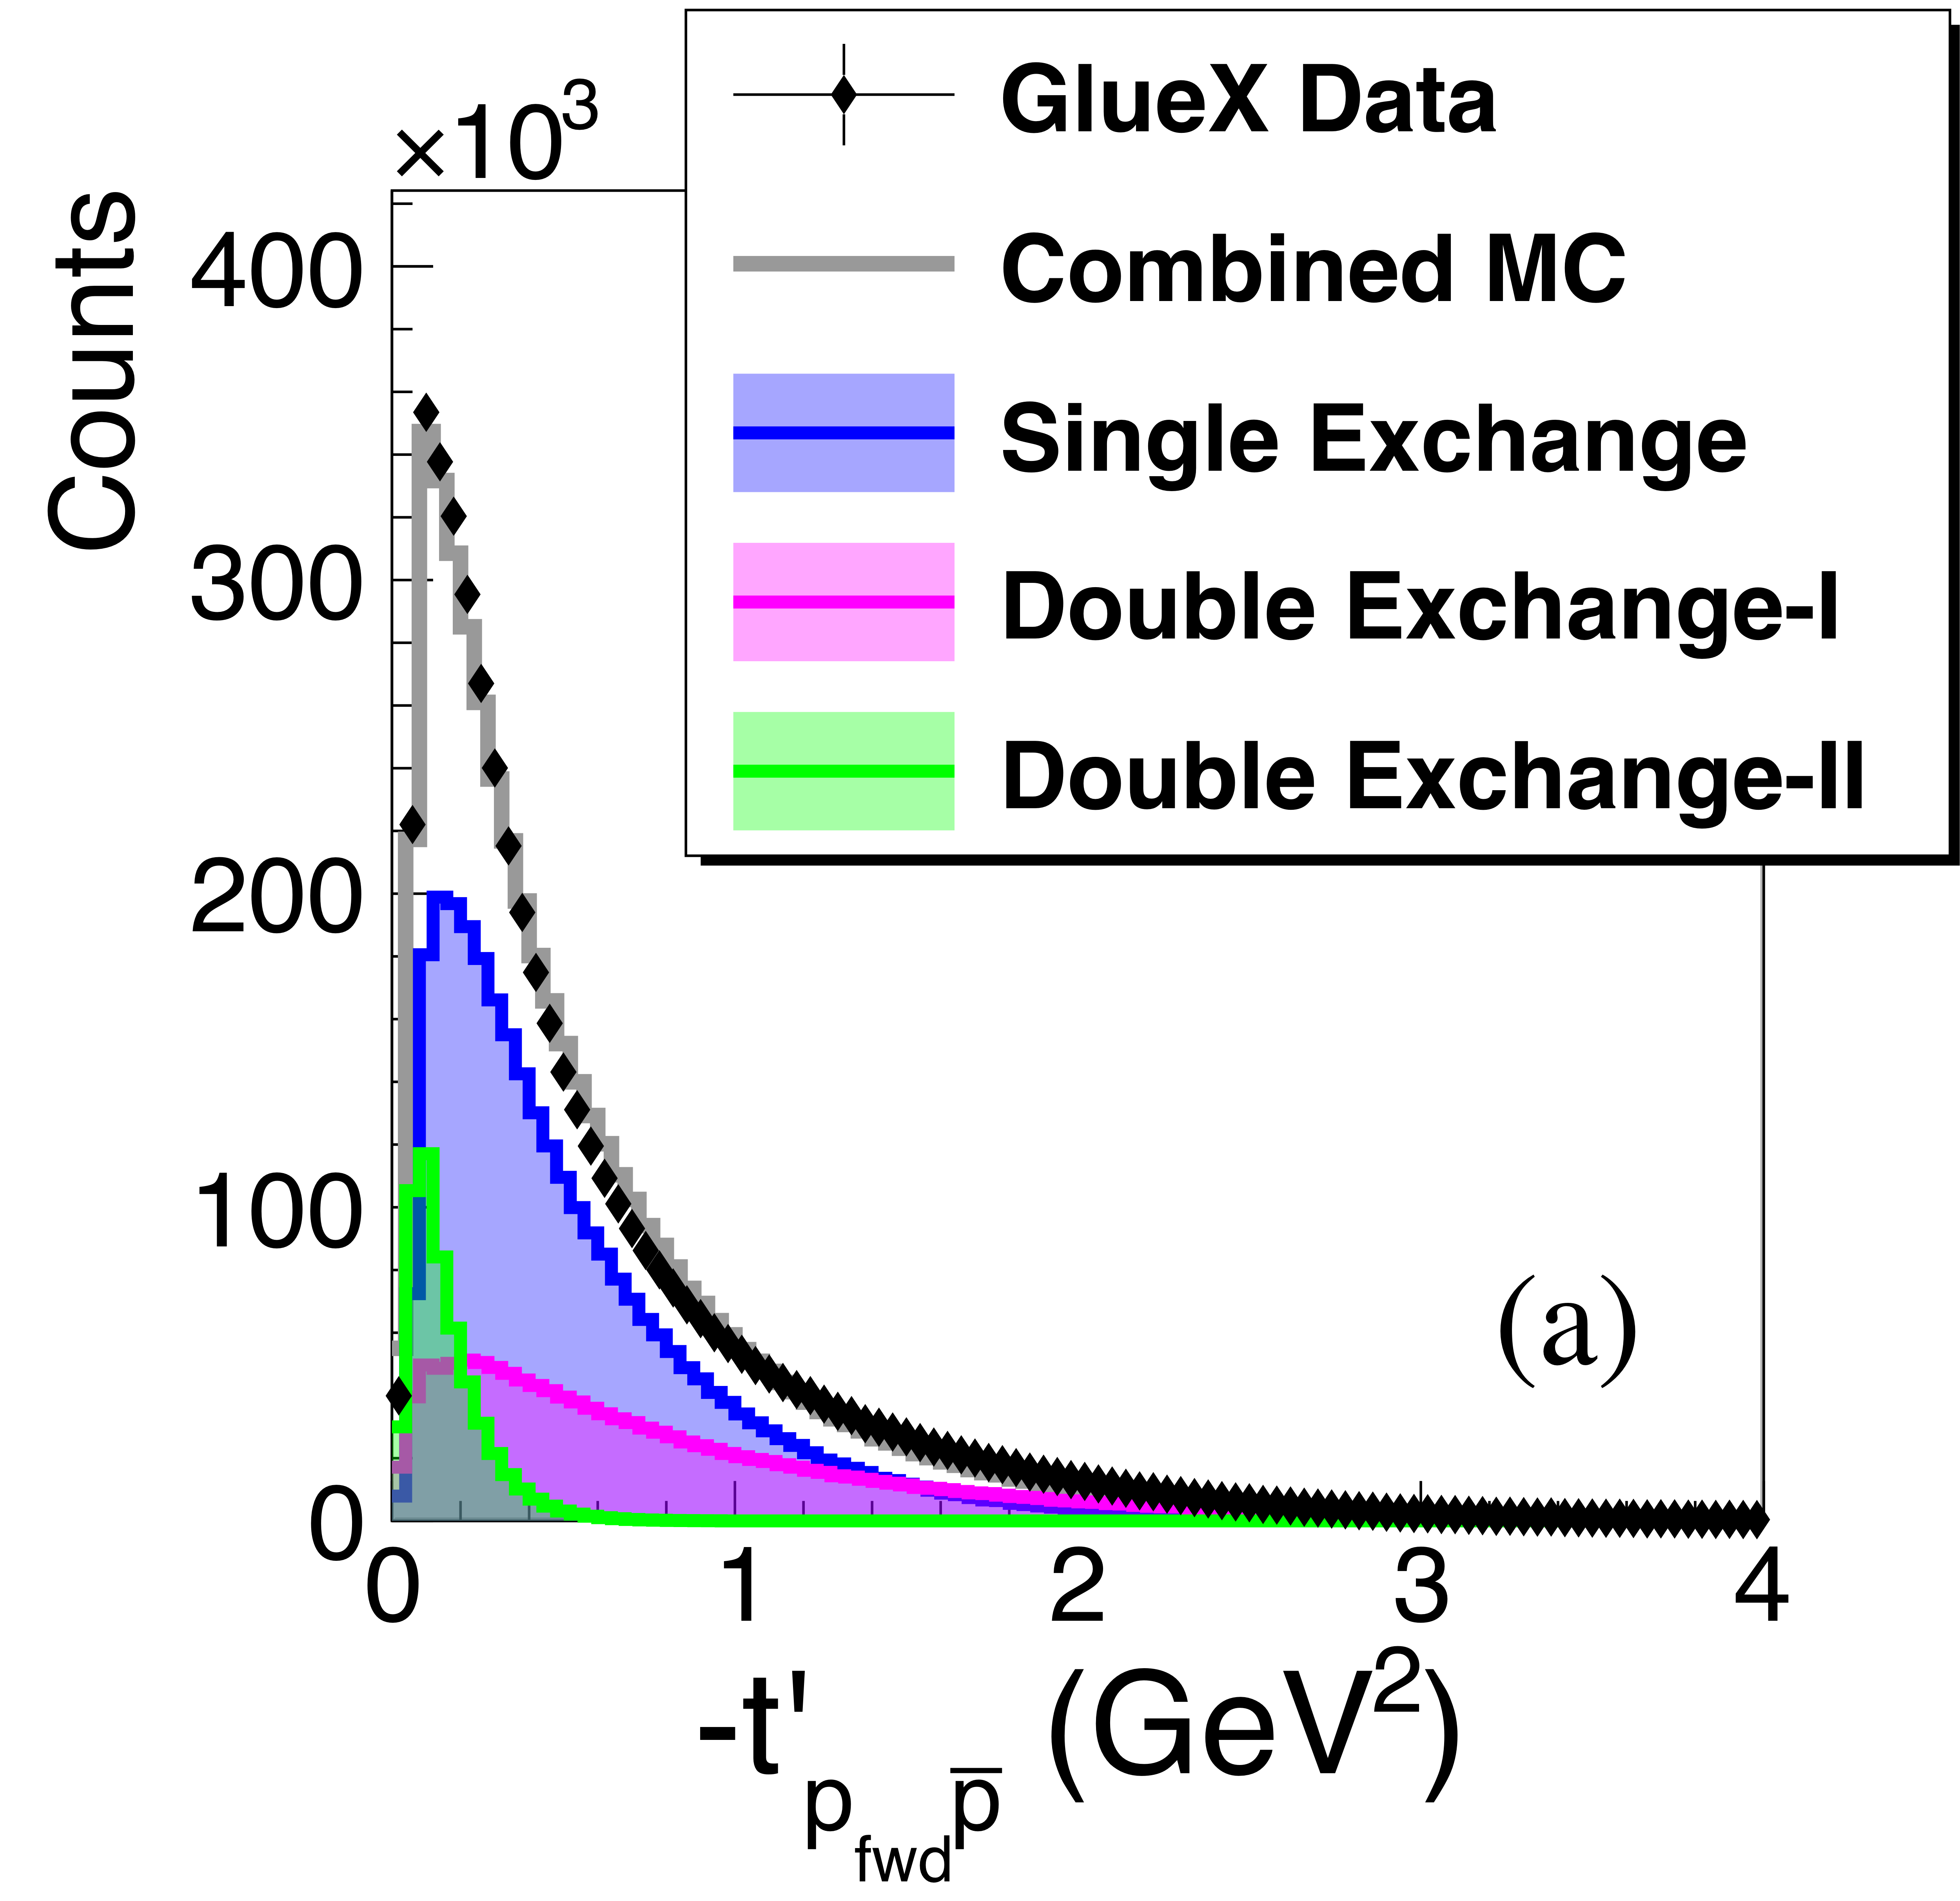
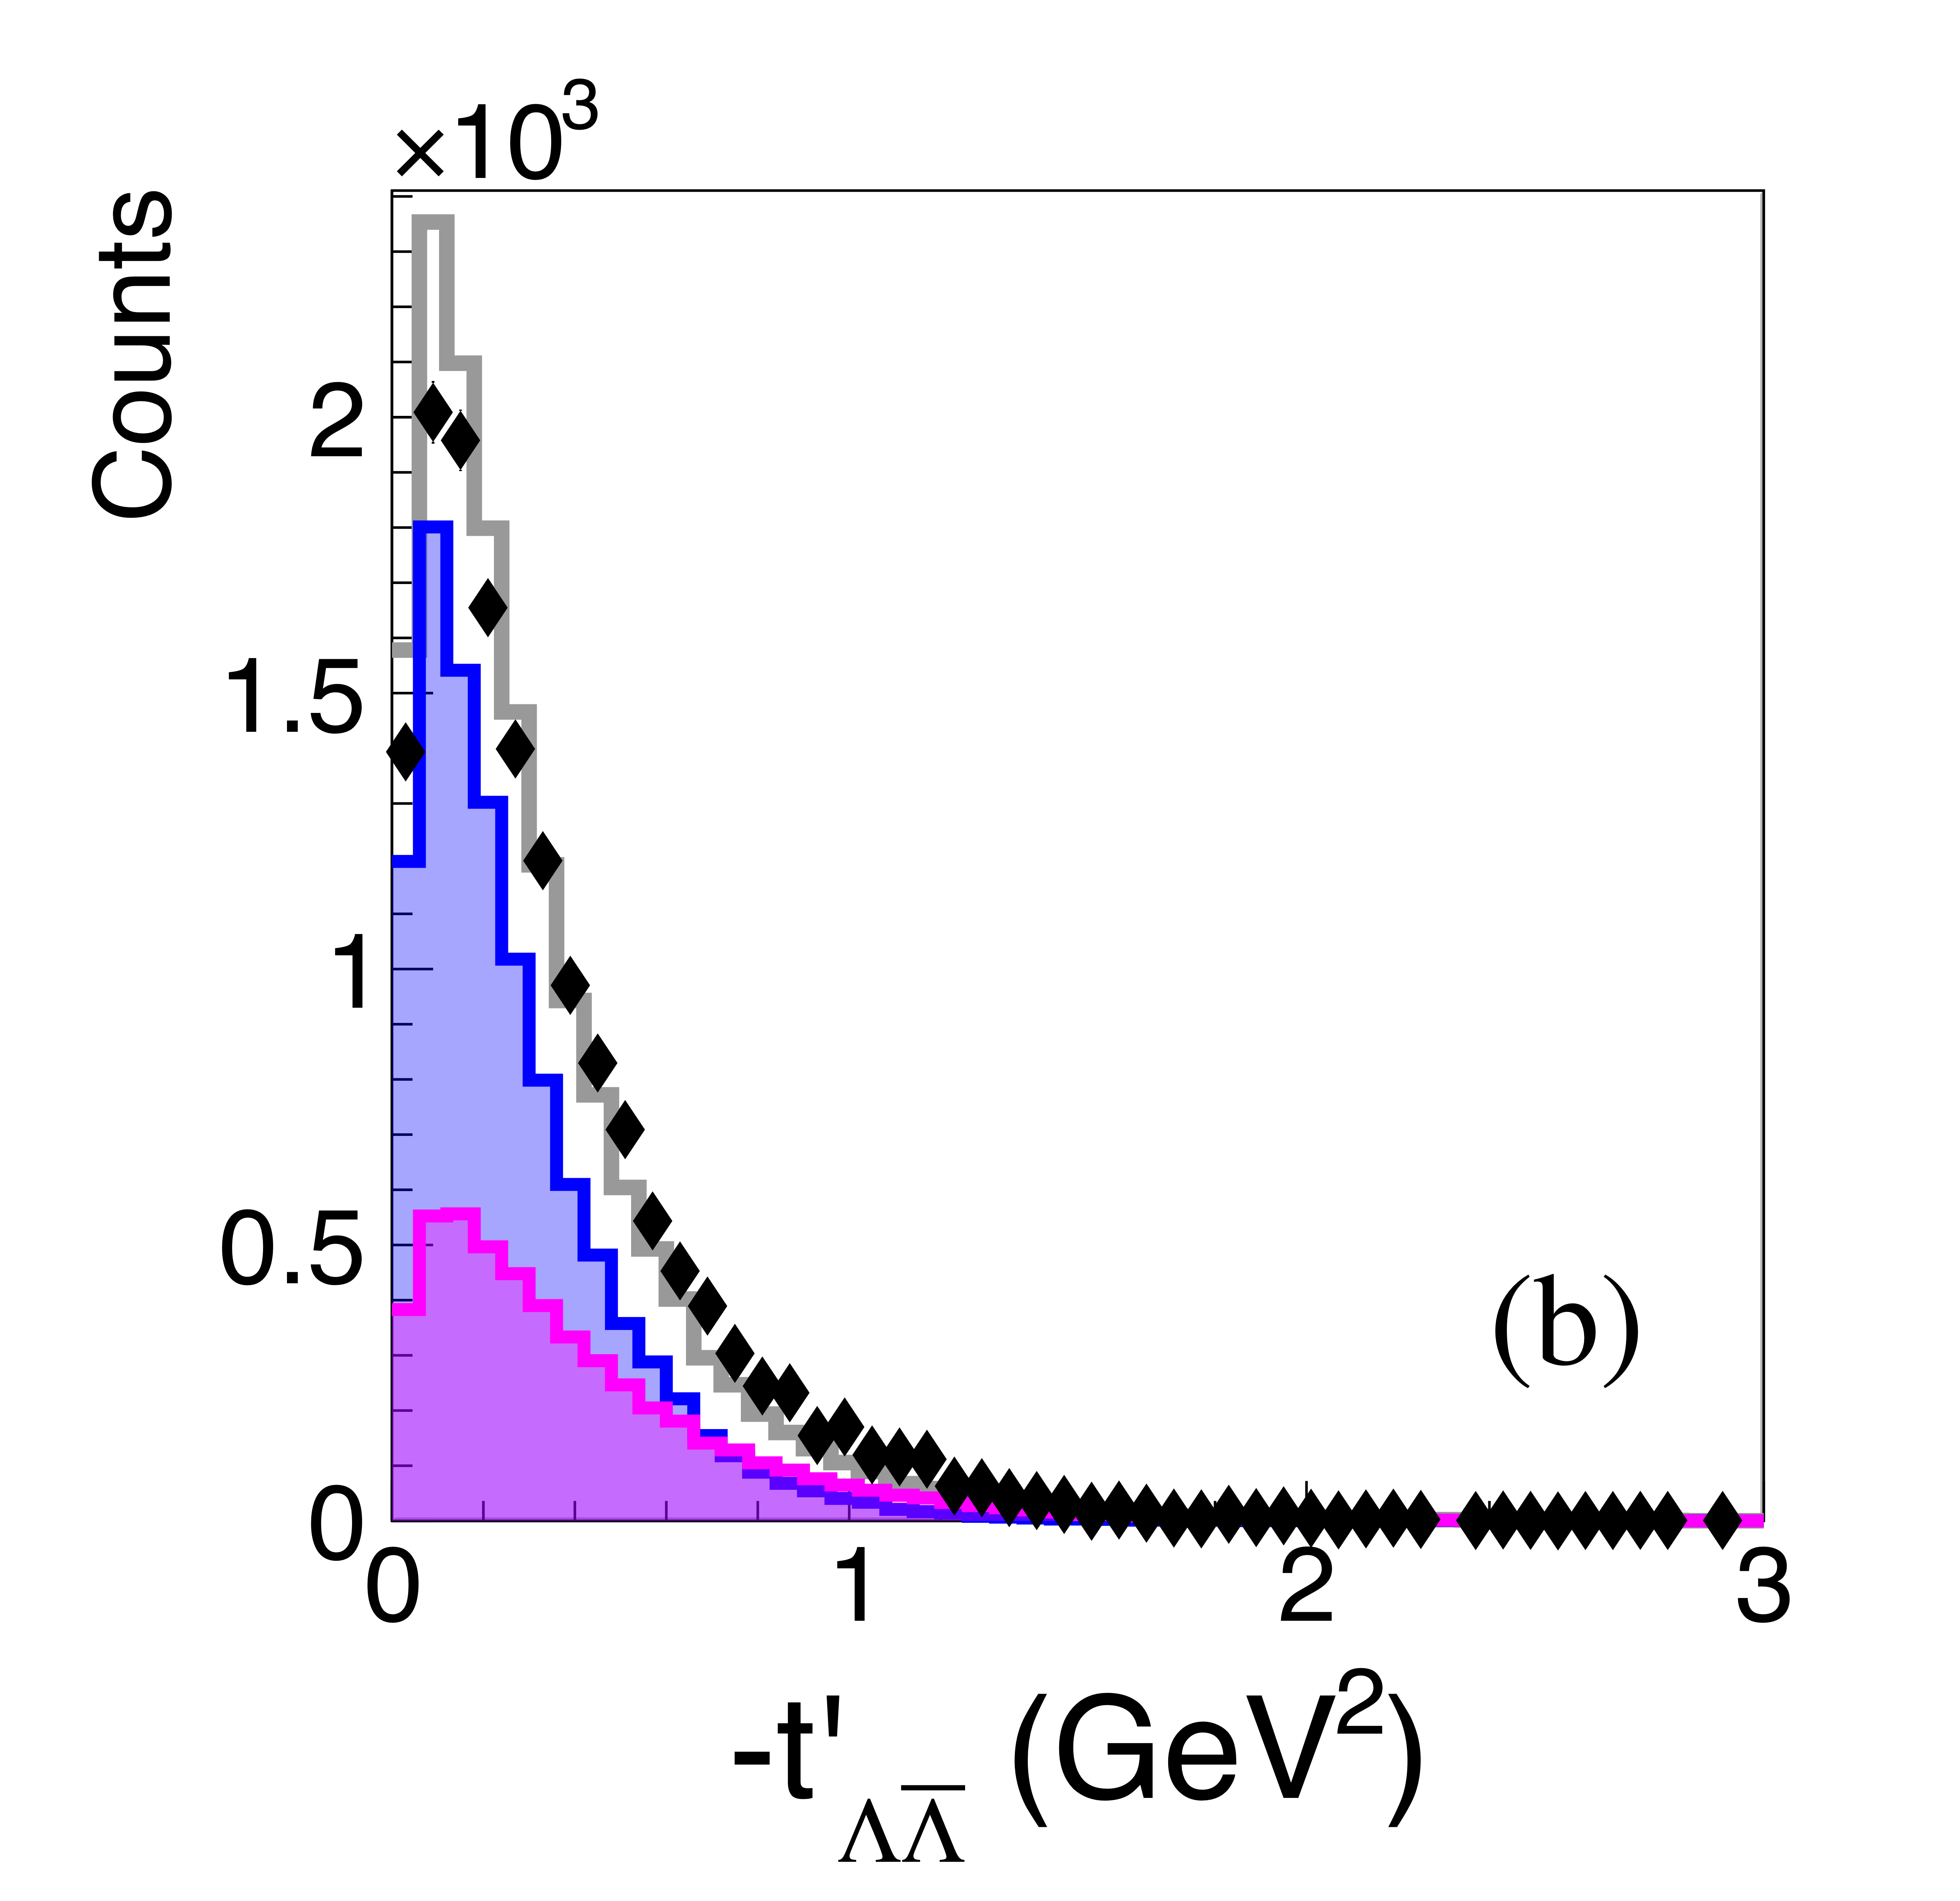
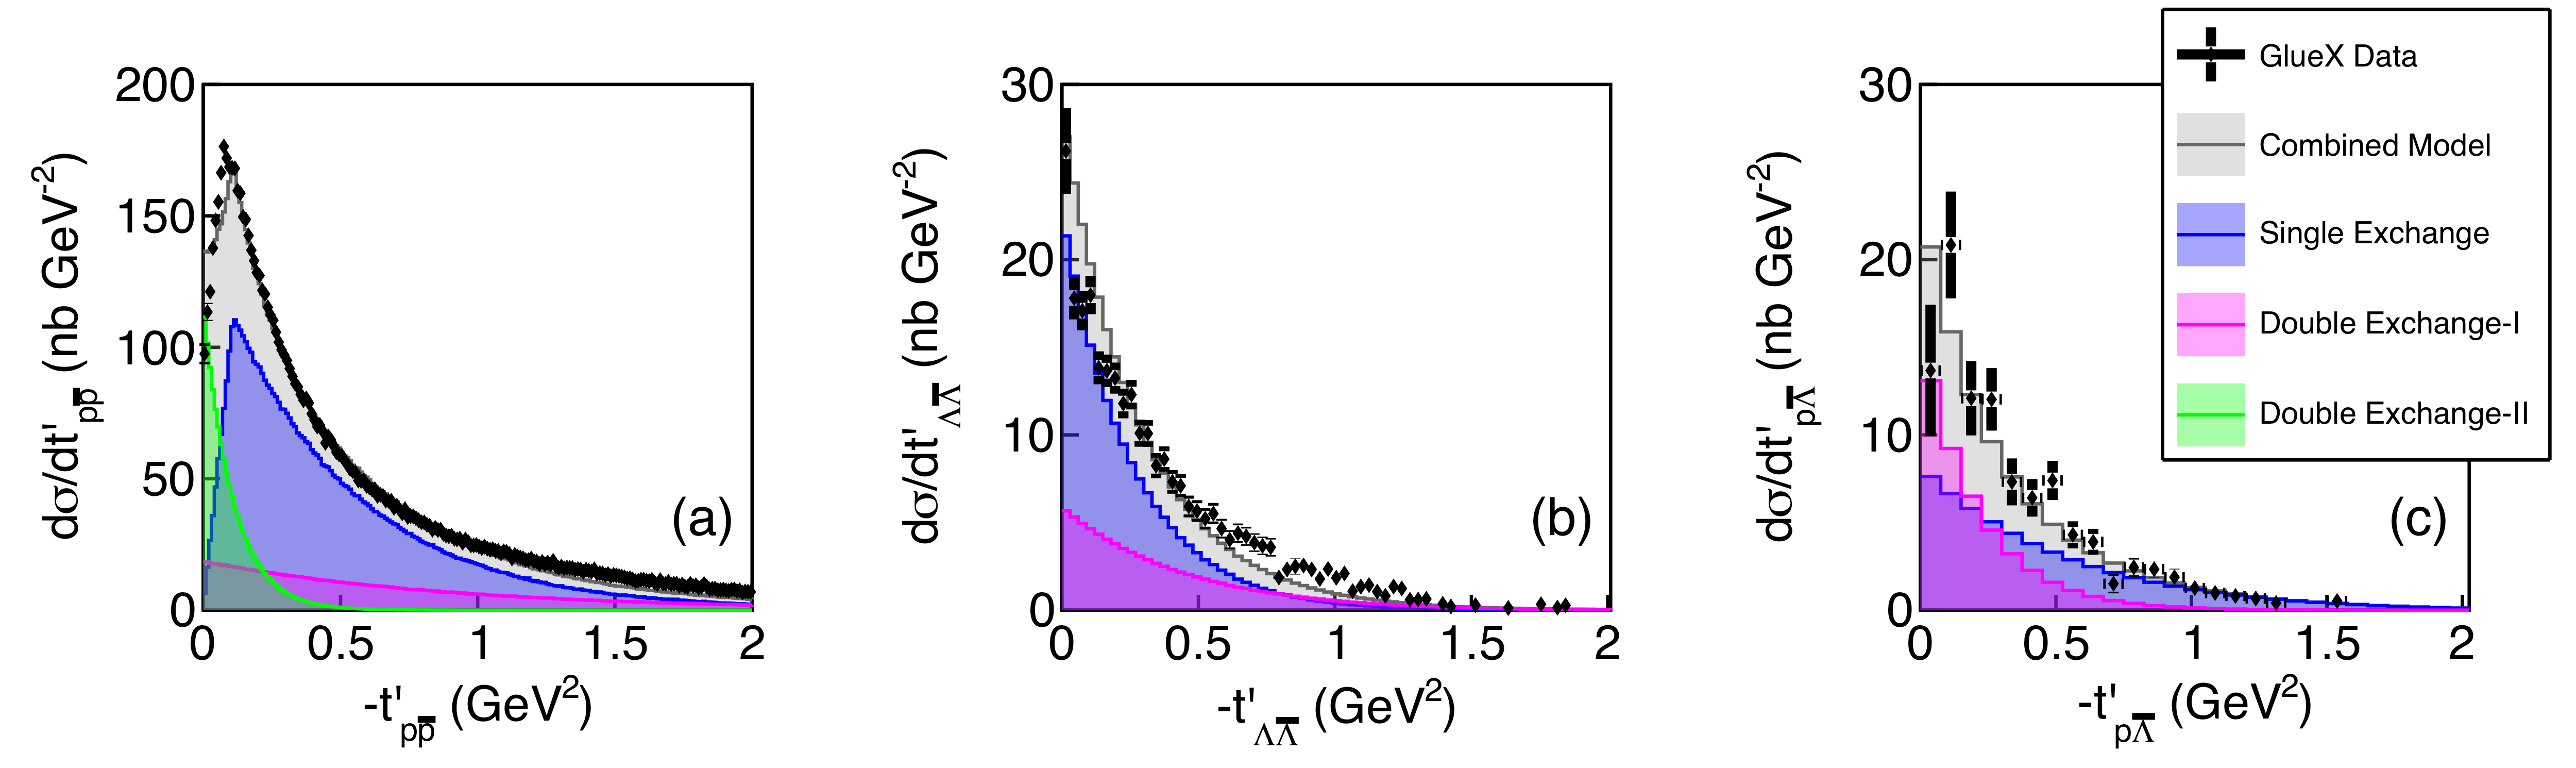
The differential cross section with respect to reduced four-momentum transfer $-t^\prime$ to the created pair, (a) $p\bar{p}$, (b) $\Lambda\bar{\Lambda}$, and (c) $p\bar{\Lambda}$. The events are selected for the beam photon energy range $8.5-9.0$ GeV. Data points (black markers) are shown with statistical uncertainties only. The combined model (gray filled histograms) is normalized to the measured differential cross section. Intensity distributions for each model component are depicted with the color scheme in the legend. Results for the full set of photon energy bins are presented in Fig. 29. |
Phys. Rev. C113 (2026) 4, 045207: downloads png pdf |
Figure 25:
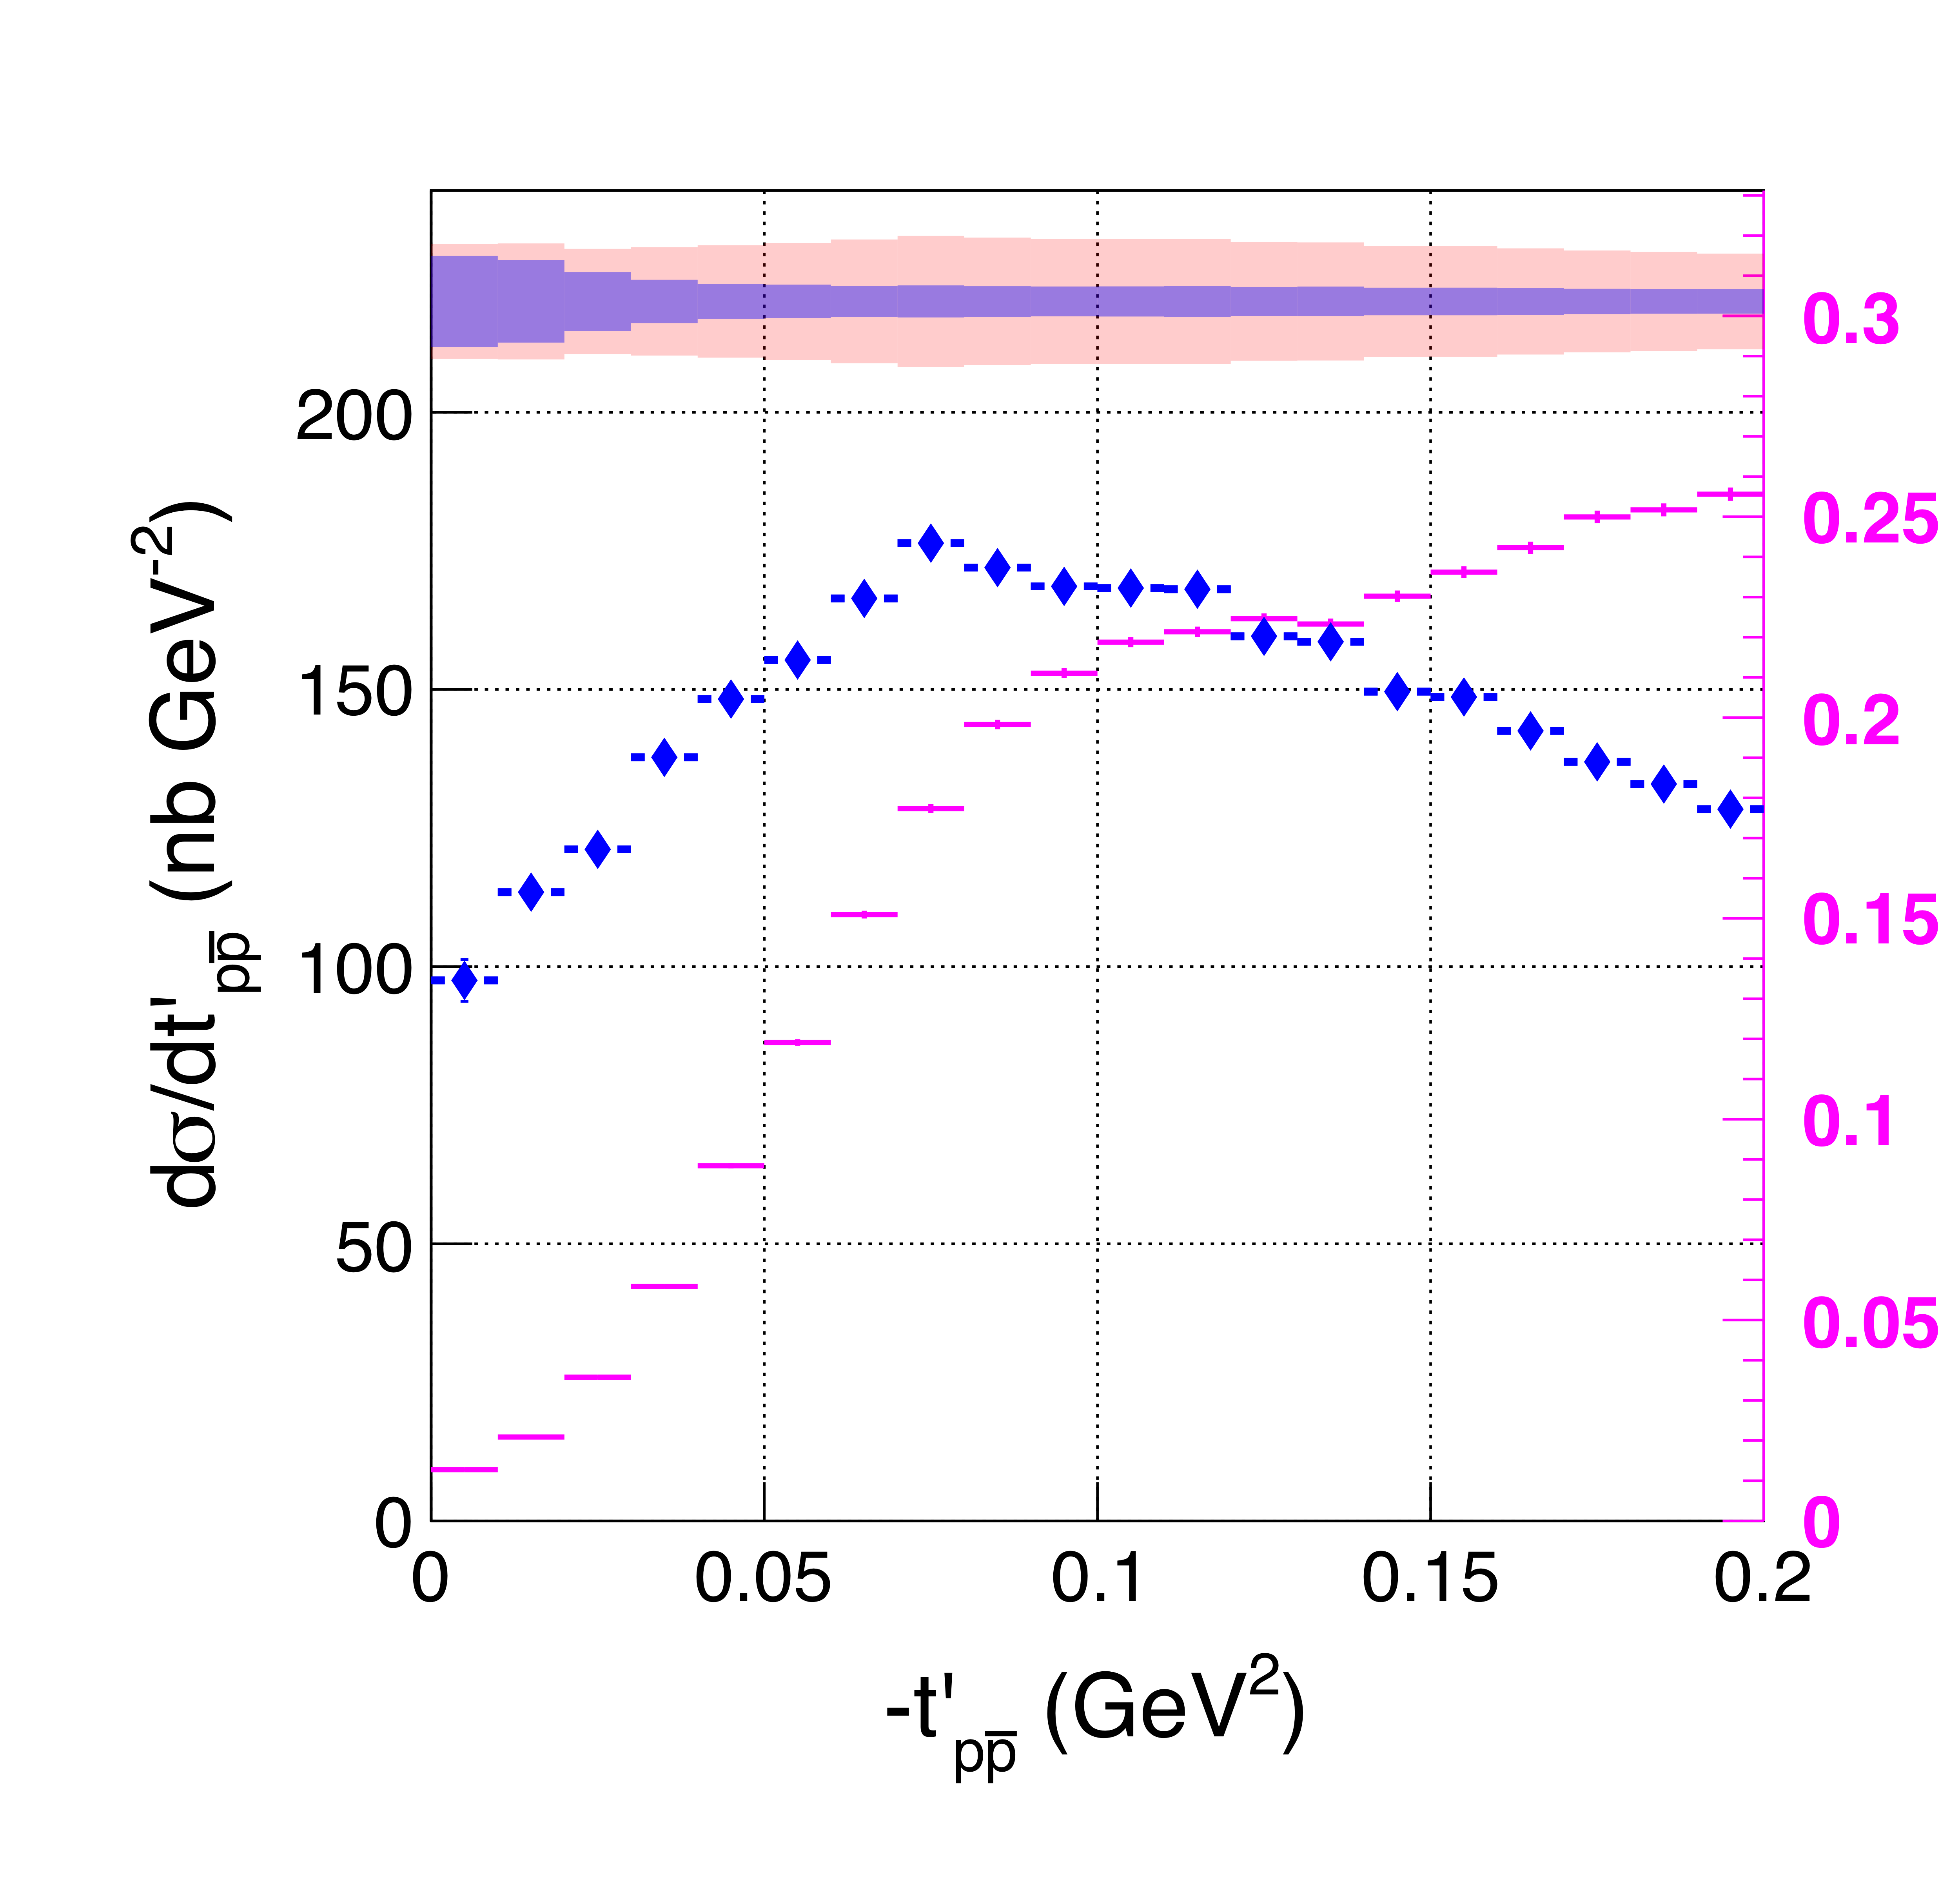
The differential cross section for the $p\bar{p}$ channel with respect to the reduced four-momentum transfer to the pair, emphasizing the low $t^\prime$ region for data in the slice of beam photon energy $8.5-9.0$ GeV with $0.01$ GeV$^2$ binning. The magenta points show the acceptance as a function of $-t^\prime$, with the right-hand magenta axis. The light blue band depicts the model-dependent systematic uncertainty and the pink band is the total uncertainty of the cross section. |
Phys. Rev. C113 (2026) 4, 045207: downloads png pdf |
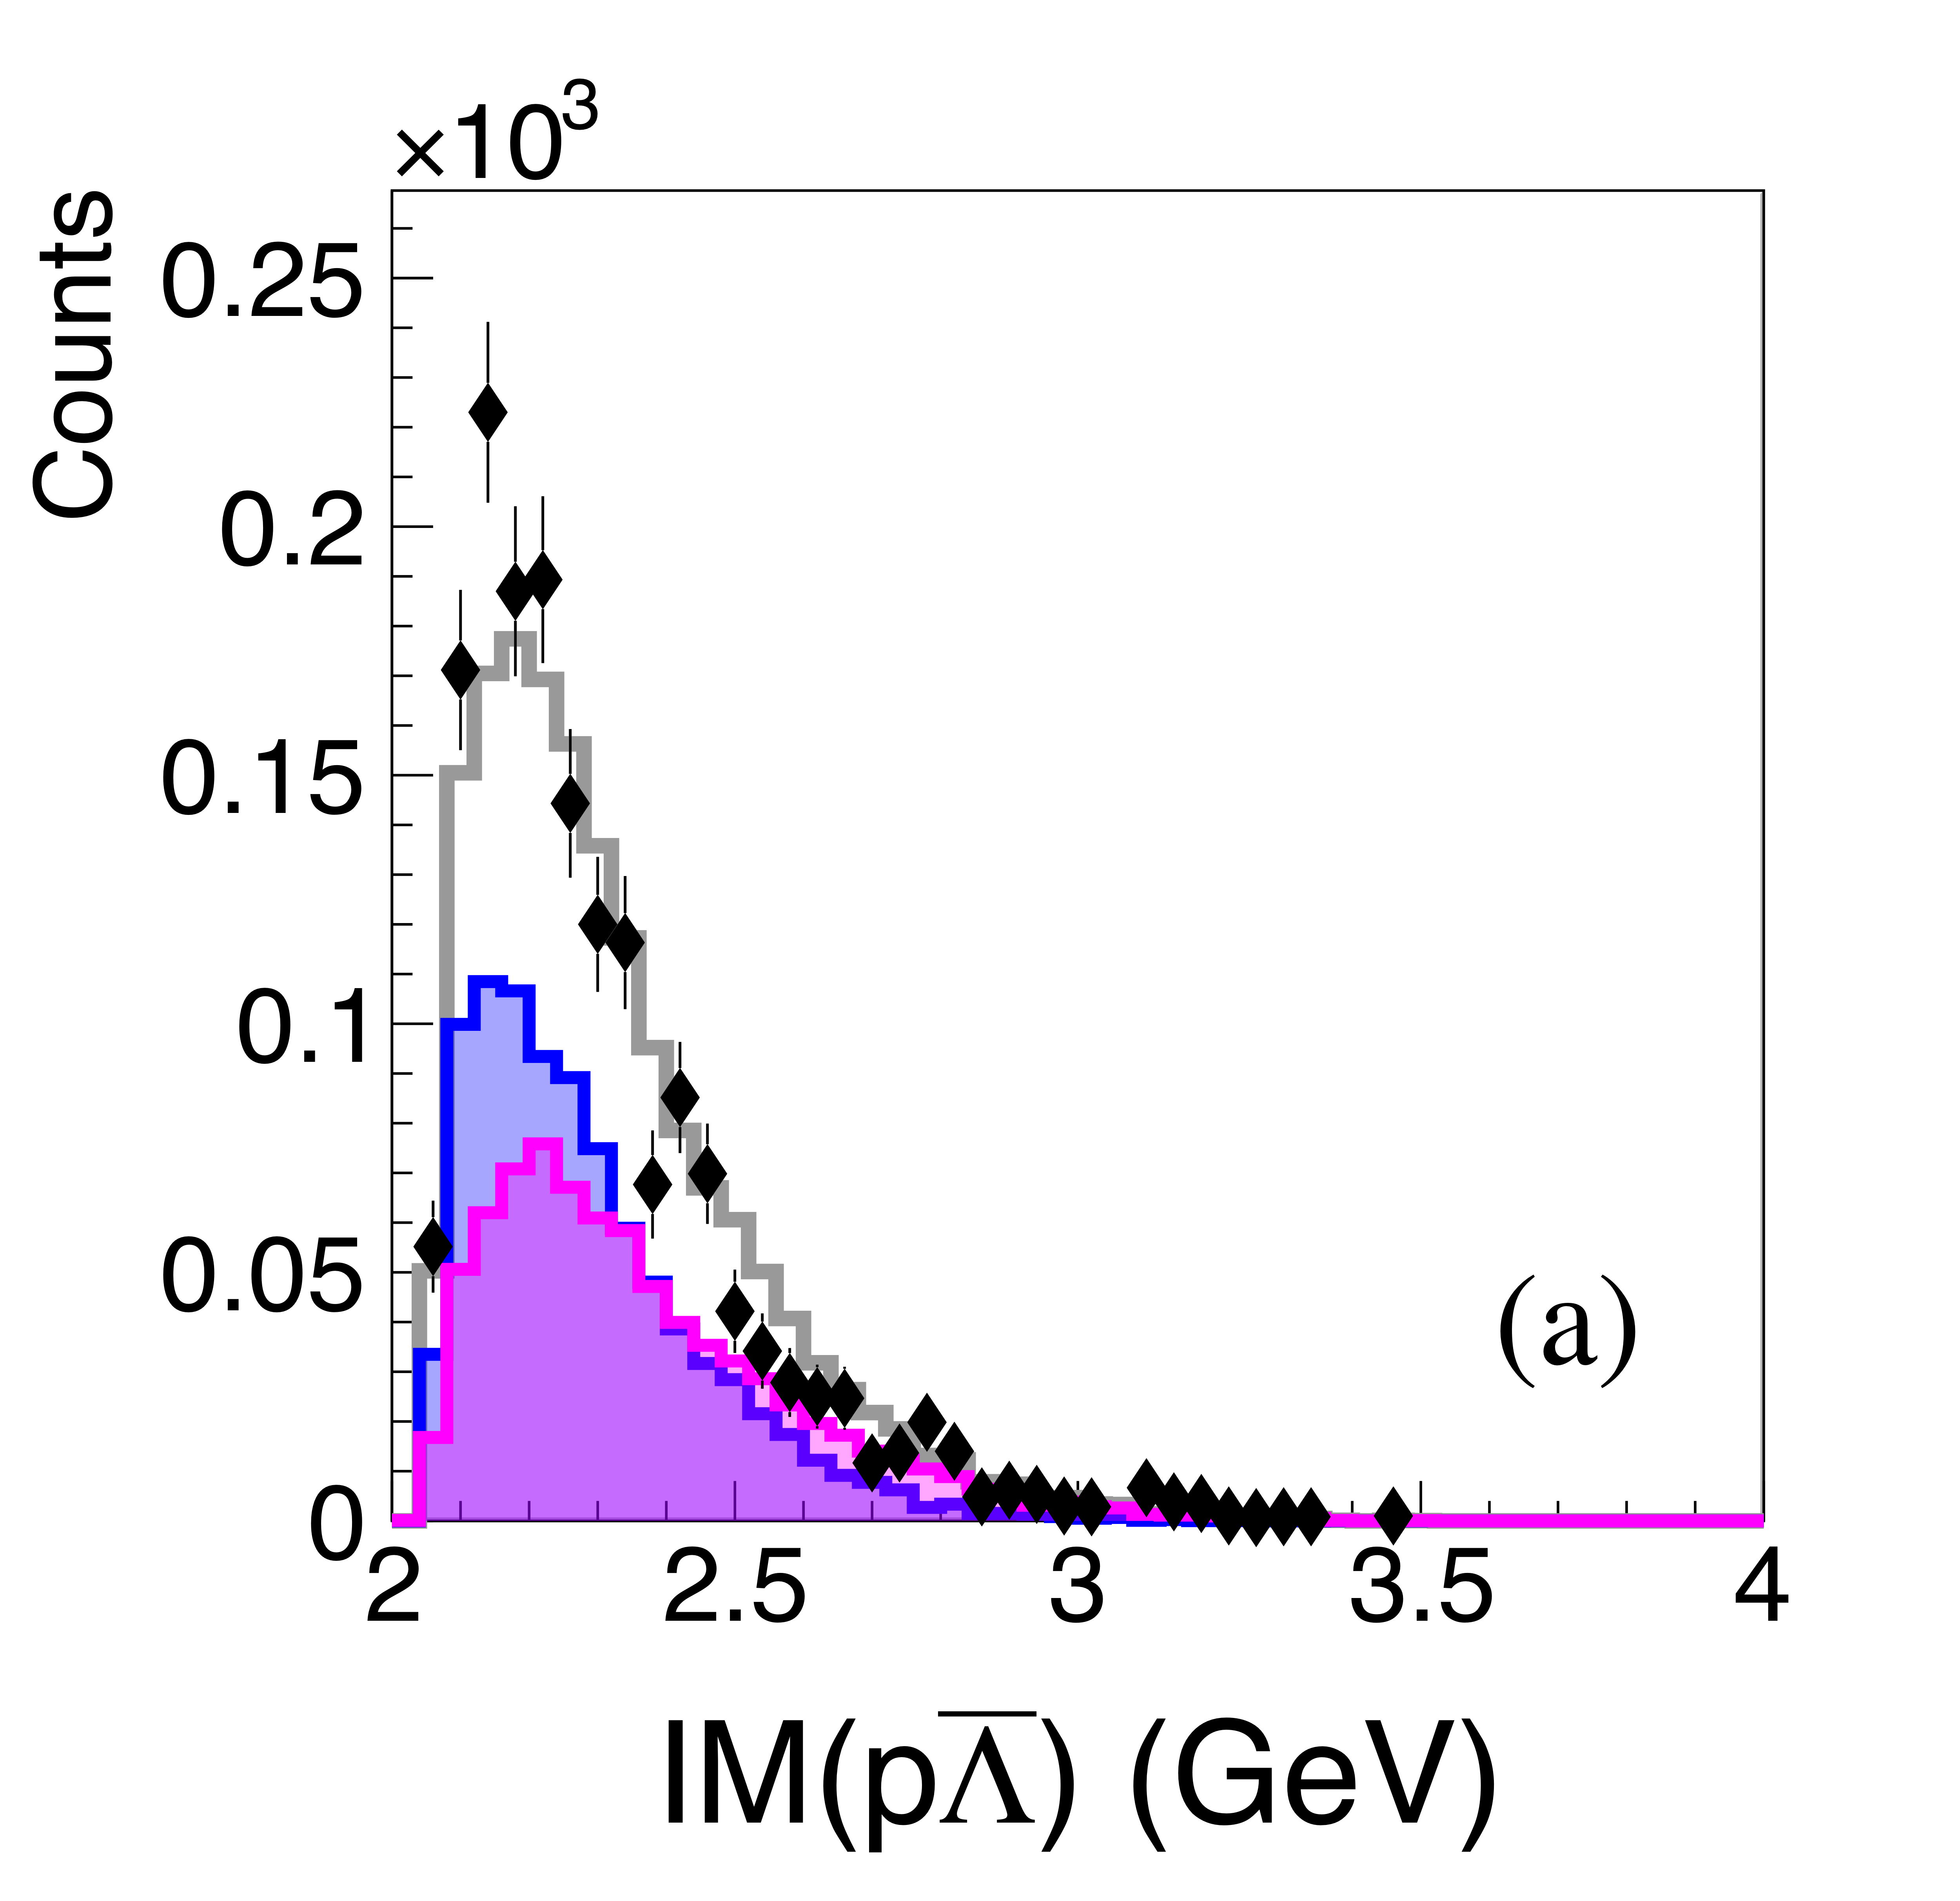
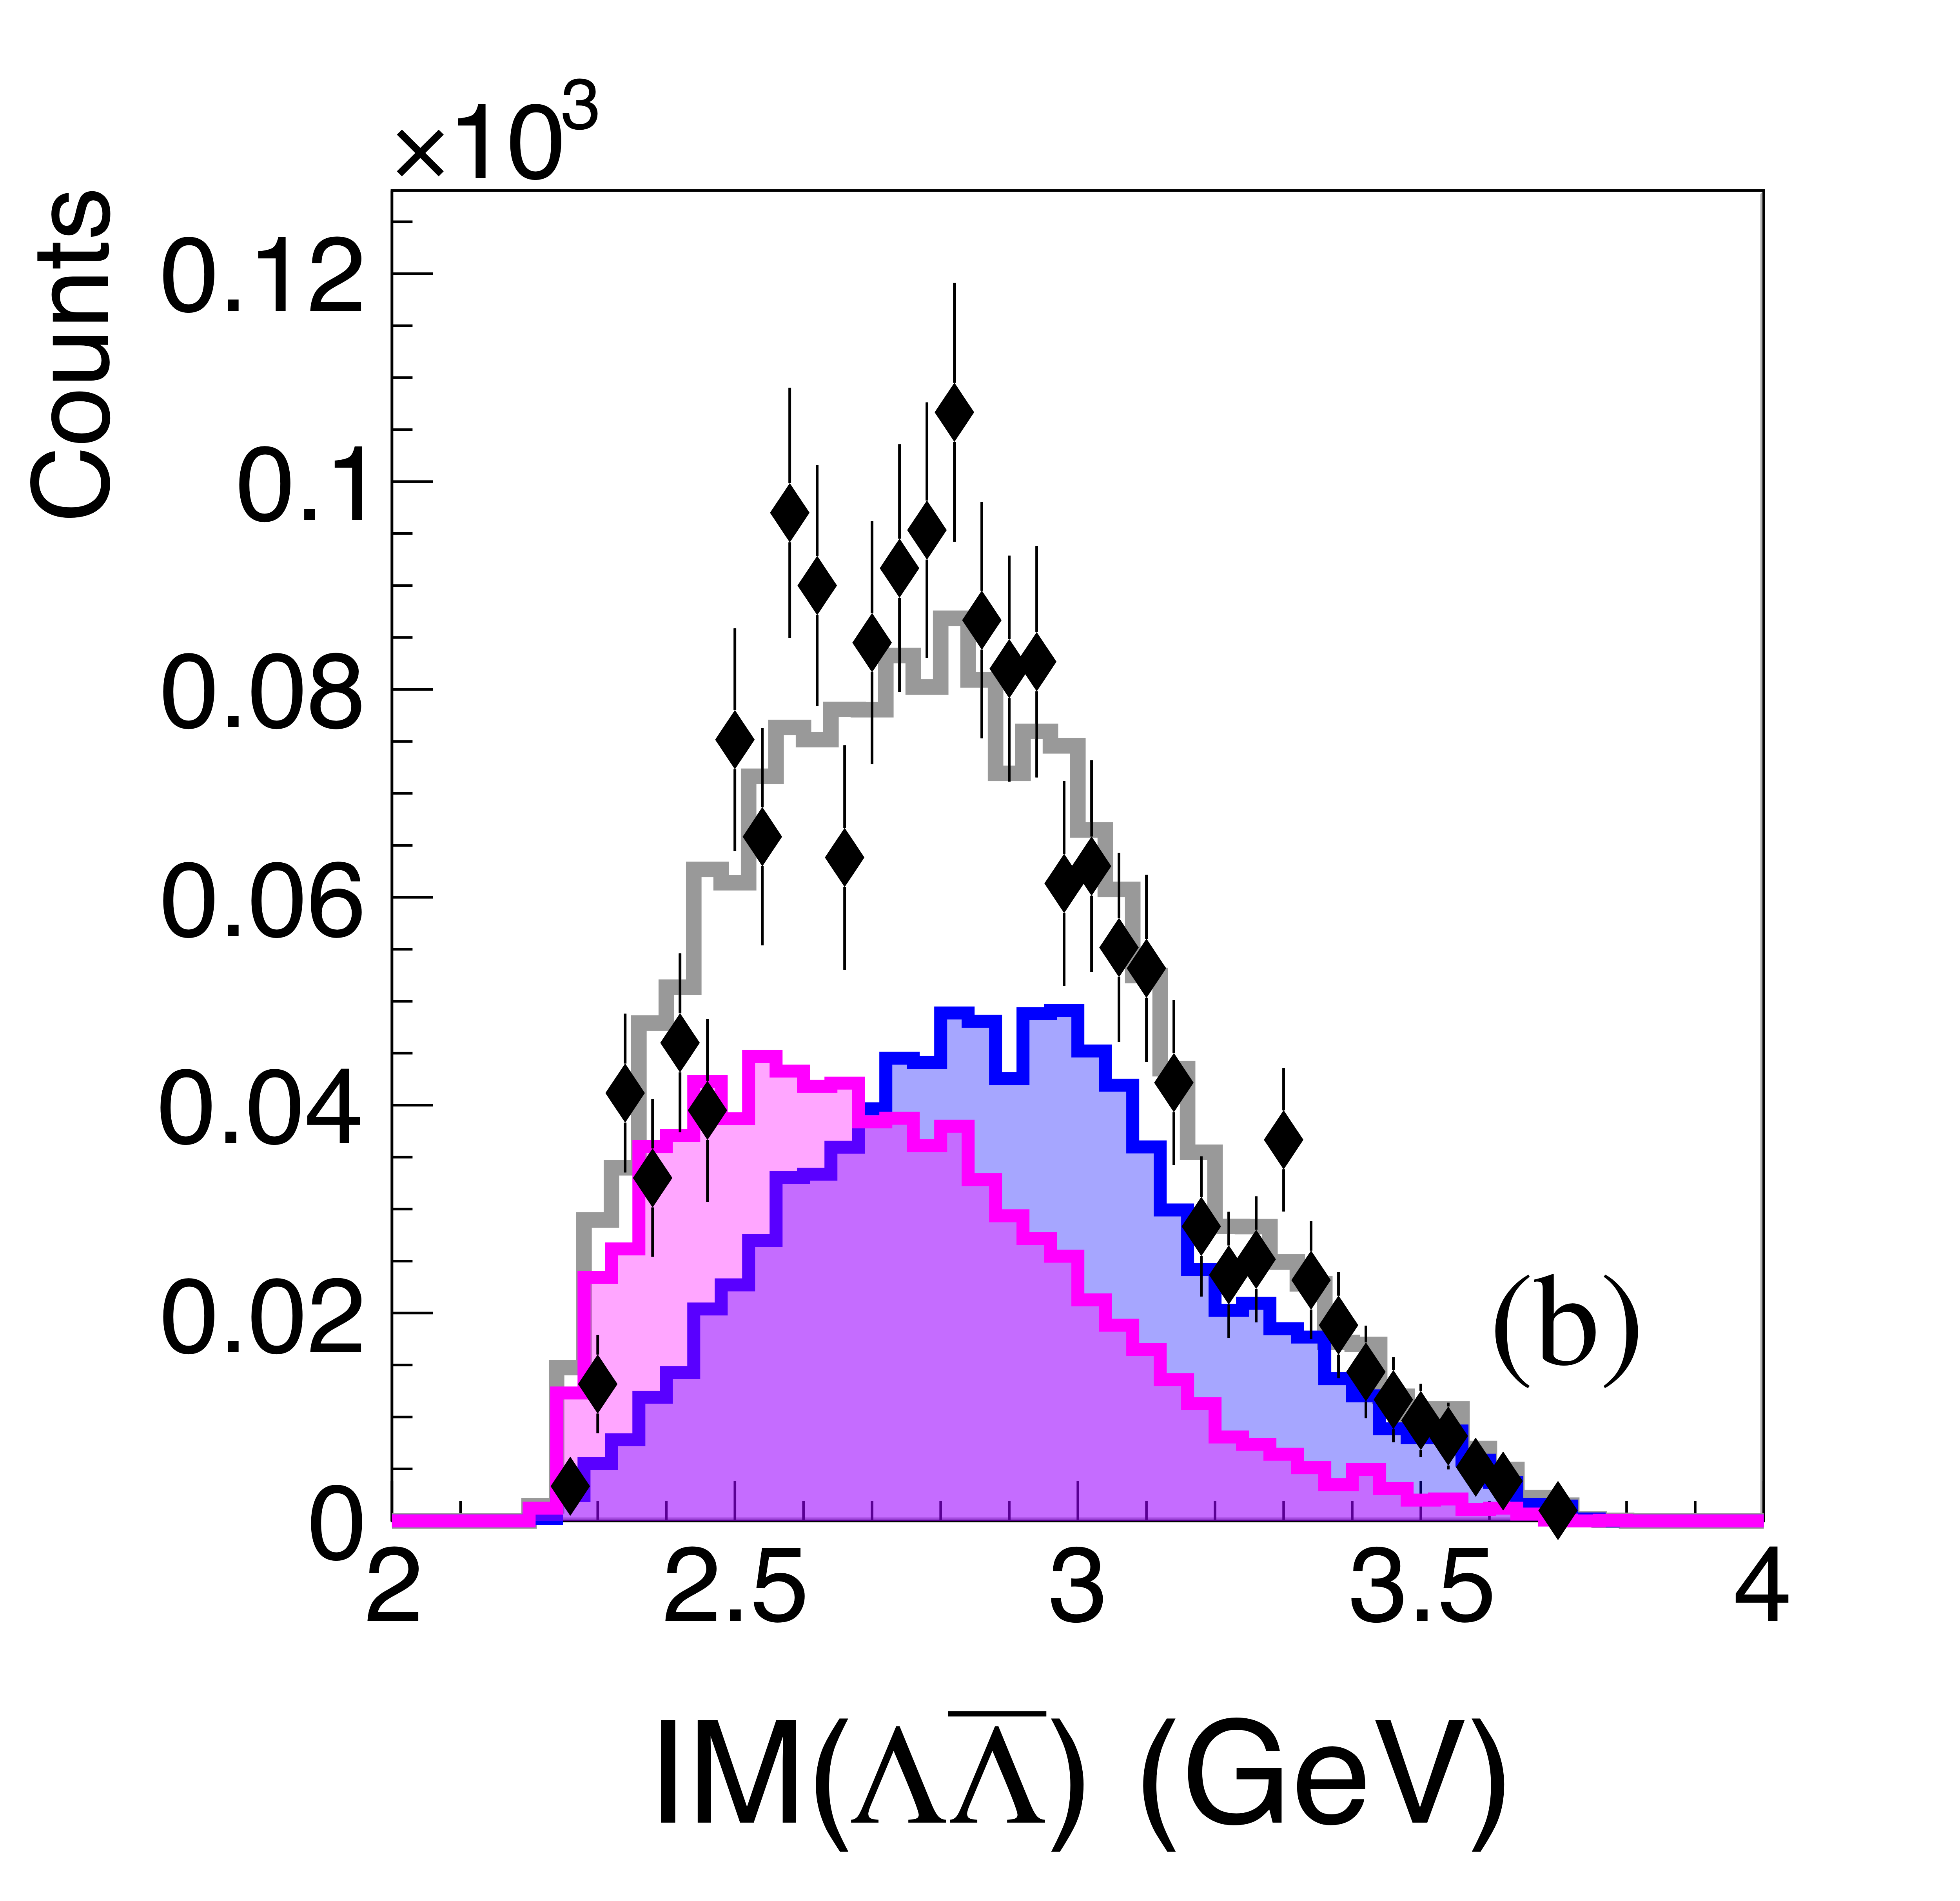
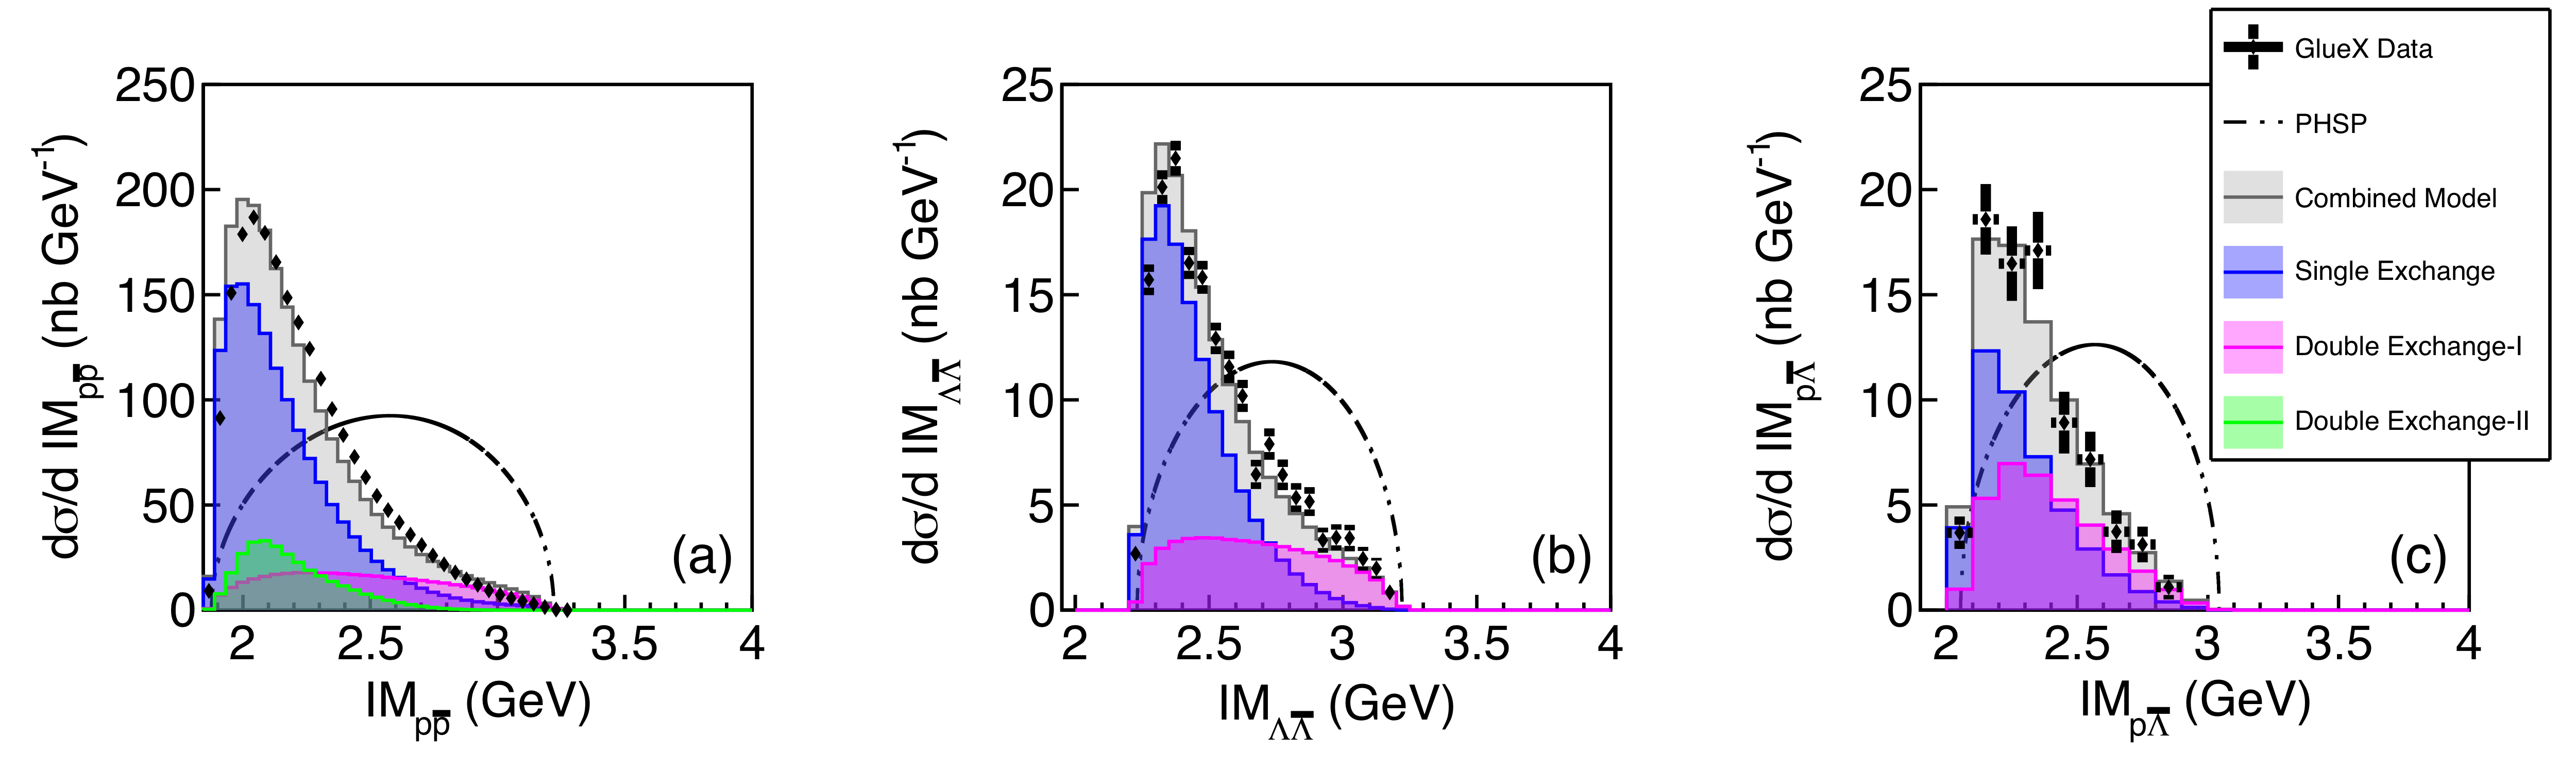
Figure 26:
The measured differential cross section with respect to the invariant mass of the baryon-anti-baryon systems (a) $p\bar{p}$, (b) $\Lambda\bar{\Lambda}$, and (c) $p\bar{\Lambda}$. The events are selected for the beam photon energy range $8.5-9.0$ GeV. Data points (black markers) are shown with statistical uncertainties only. Phase space distributions (black dot-dashed curves) are normalized to the combined model (gray filled histograms) for comparison. Model components are depicted with the color scheme in the legend. Results for all photon energy bins are presented in Fig. 30. |
Phys. Rev. C113 (2026) 4, 045207: downloads png pdf |
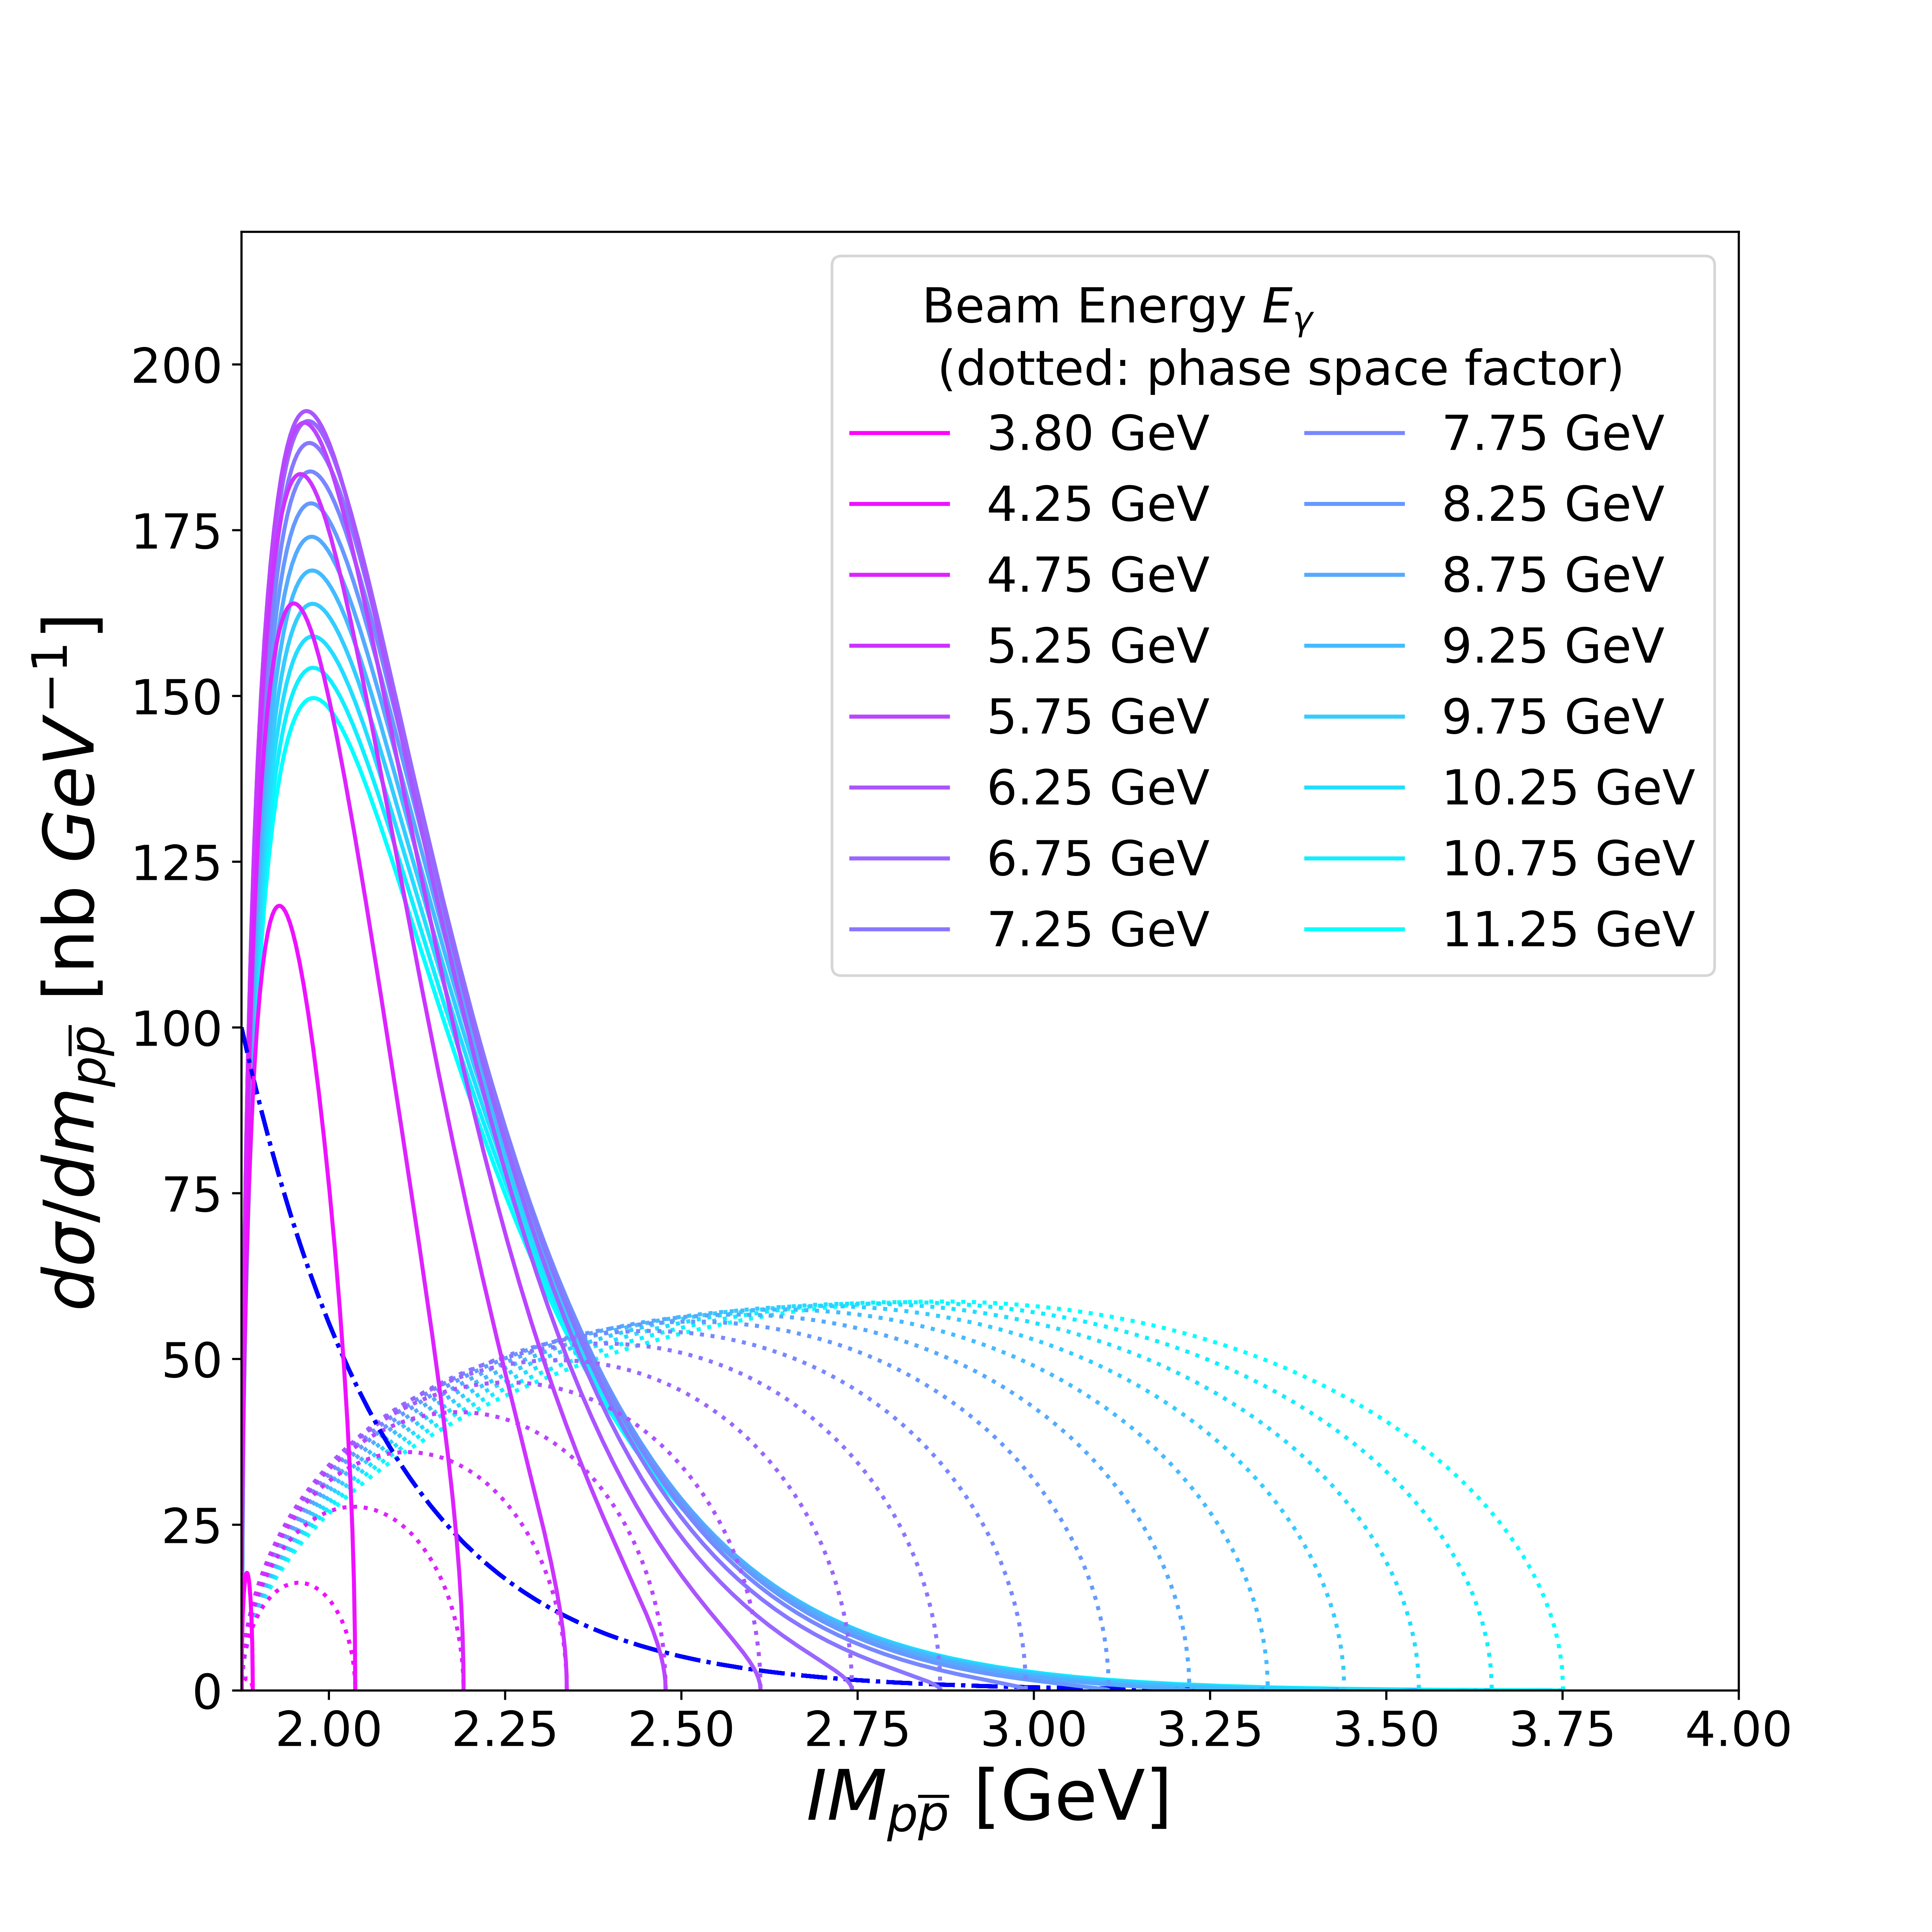
Figure 27:
Components of the beam-energy dependent clustering model of the $p\bar{p}$ mass distribution. A single exponential mass profile of the $p\bar{p}$ system before folding in three-body phase space is shown by the blue dash-dot curve. The phase space factors (Eq. 6) across beam energies are the light blue dotted lines. The resultant invariant mass distributions (Eq. 14) at different beam energies are shown as solid lines of various shades. Compare to Fig. 30. |