Measurement of Spin-Density Matrix Elements in $\phi(1020)\to K_S^0K_L^0$ Photoproduction with a Linearly Polarized Photon Beam at $E_\gamma=8.2-8.8$ GeV
Abstract:
We measure the spin-density matrix elements (SDMEs) for the photoproduction of $\phi(1020)$ off of a proton and decaying to $K_S^0K_L^0$ using 105 pb$^{-1}$ of data collected with a linearly polarized photon beam using the GlueX experiment. The SDMEs are measured in nine bins of the squared four-momentum transfer $t$ in the range $-t=0.15-1.0$ GeV$^2$, providing the first measurement of their $t$-dependence for photon beam energies $E_\gamma = 8.2-8.8$ GeV. We confirm the dominance of natural-parity exchange, which primarily occurs through Pomeron exchange, in this reaction and put constraints on the contribution of other Regge exchanges. We also find that helicity amplitudes where the helicity of the photon and the $\phi(1020)$ differ by two units are negligible.Journal: Phys. Rev. C112 (2025) 2, 025203
arXiv: arXiv:2504.01194
HEPdata: link
Phys. Rev. C112 (2025) 2, 025203: downloads png pdf |
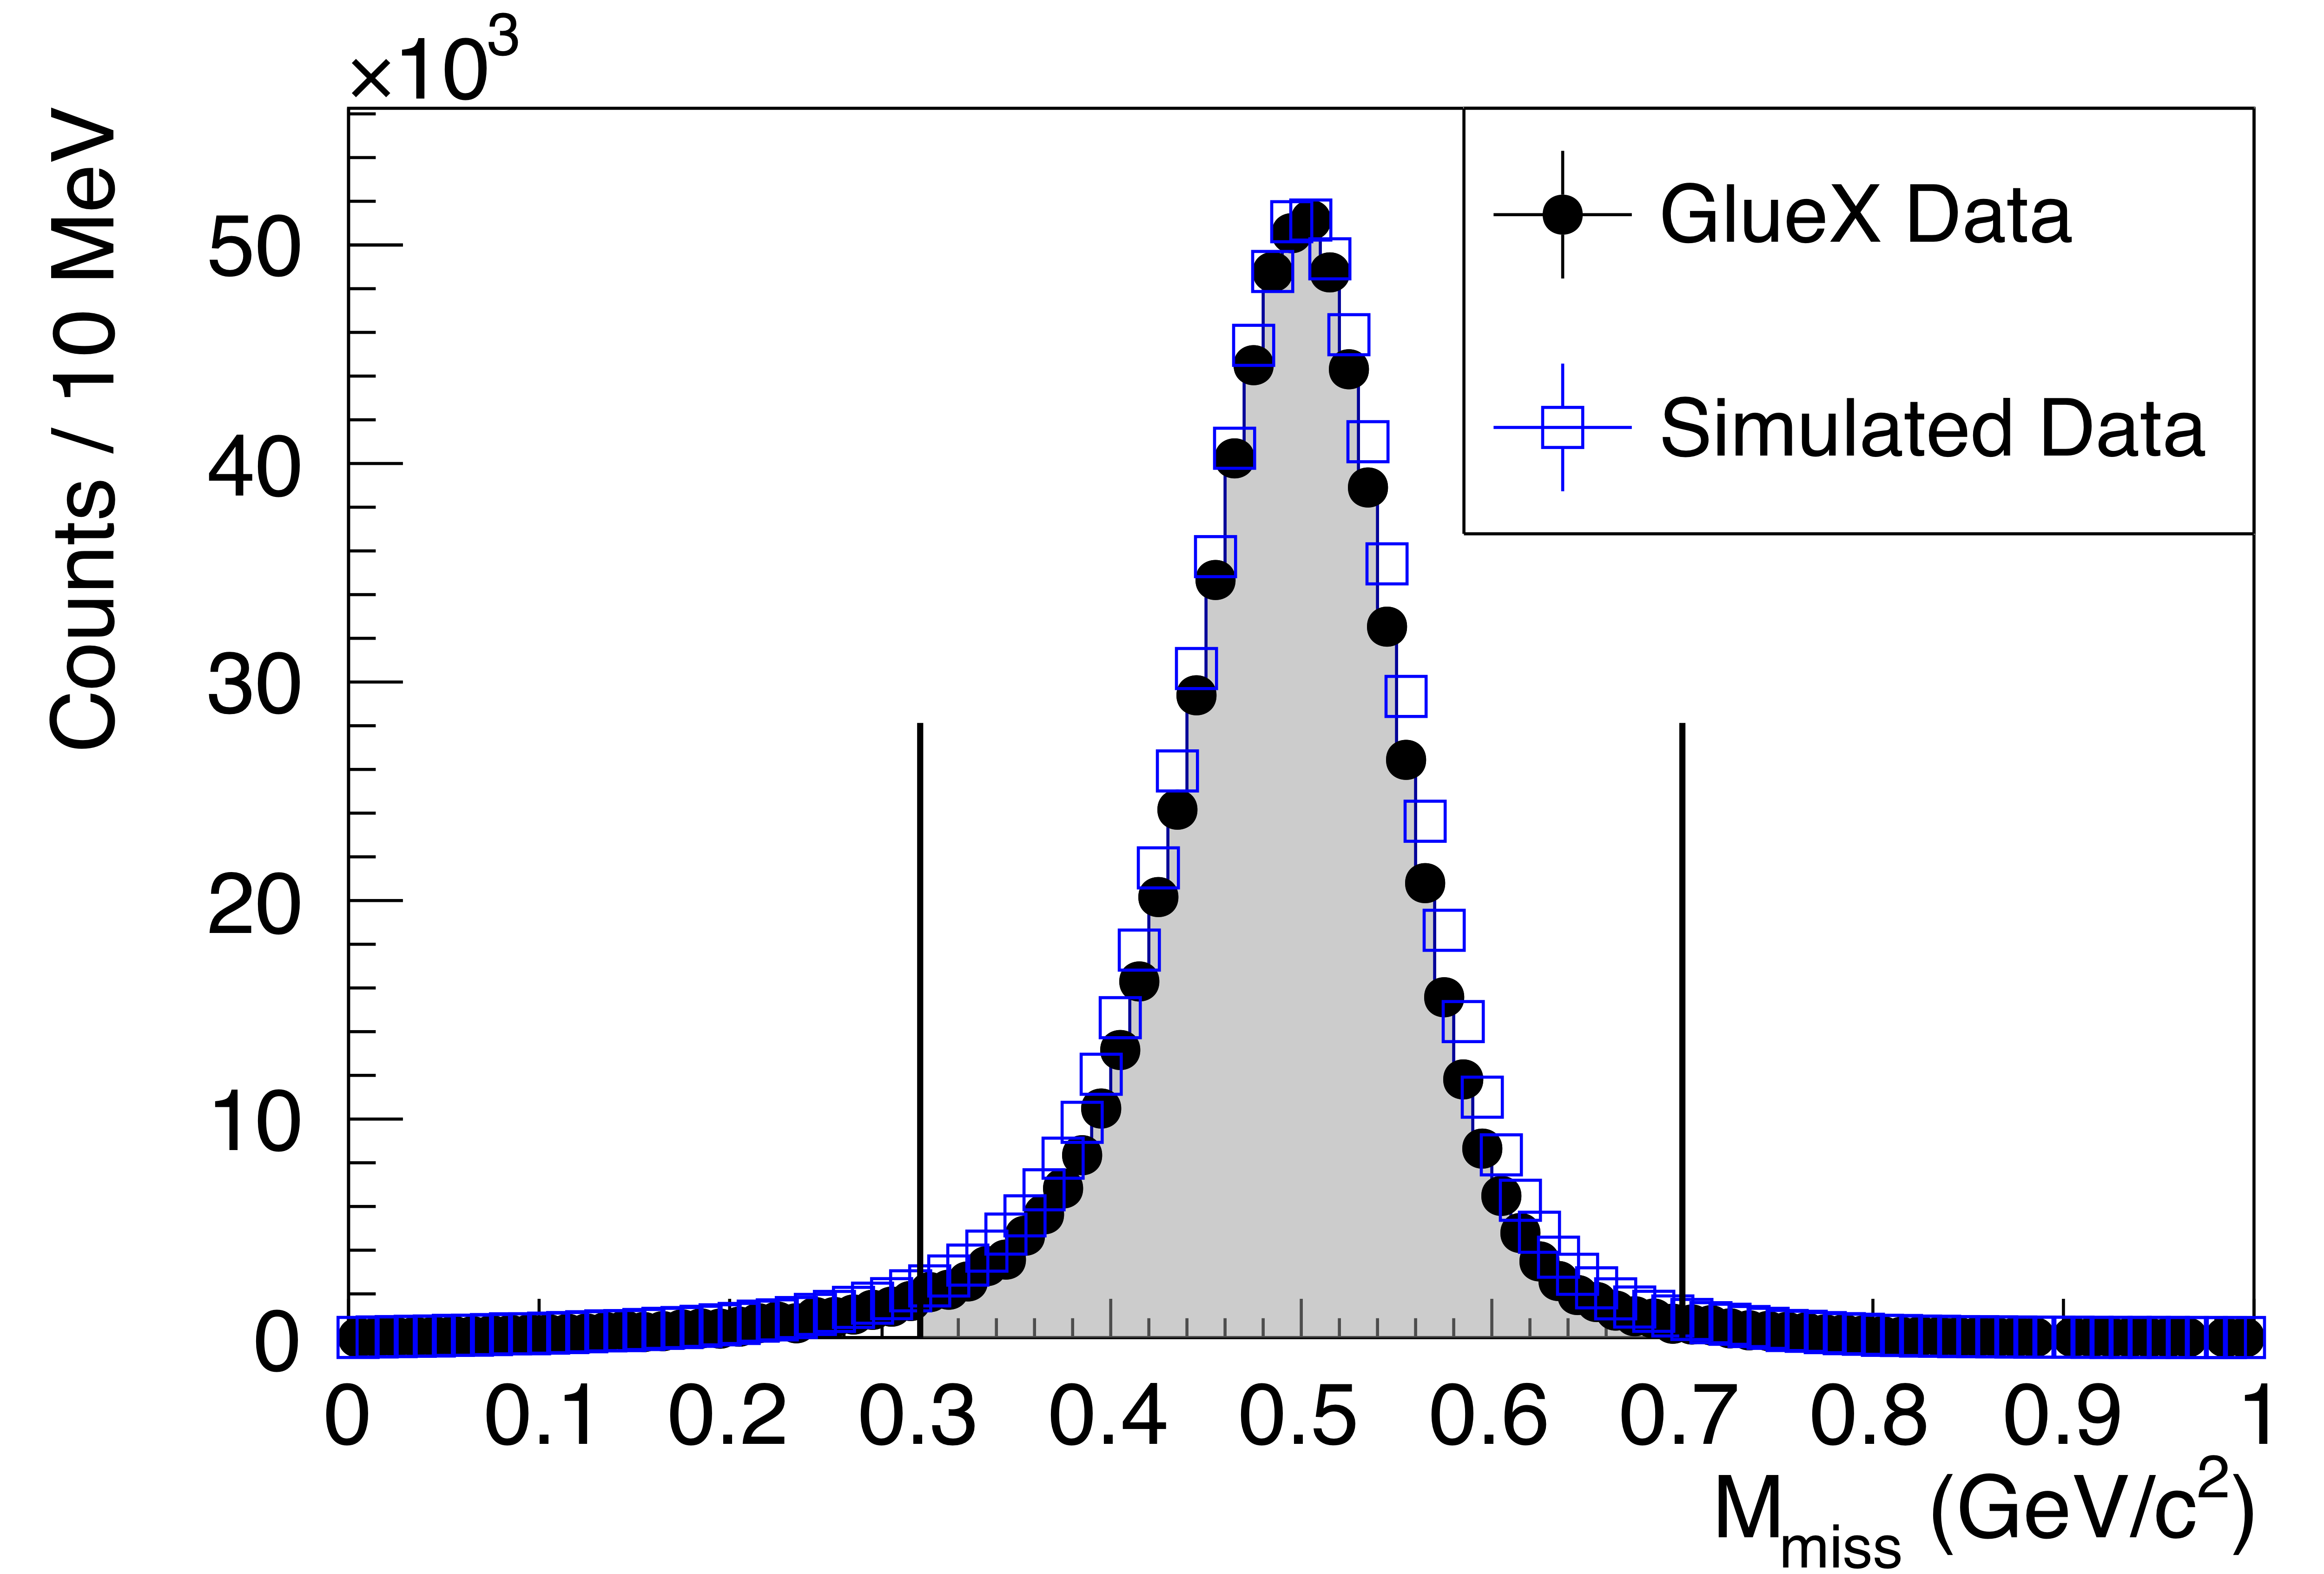
Figure 1a:
Distributions for selected $\gamma p \to K_S^0 K_L^0 p$ events where the $K_L^0$ is reconstructed as a missing particle, as described in the text, (top) the missing mass, showing a clear $K_L^0$ signal, and (bottom) the $\pi^+\pi^-$ invariant mass, showing a clear $K_S^0\to\pi^+\pi^-$ signal. The distributions for measured distributions (black points) agree well with the simulated ones (blue squares). The vertical lines show the regions selected for further analysis. The legend shown in the top figure applies to both. |
Phys. Rev. C112 (2025) 2, 025203: downloads png pdf |
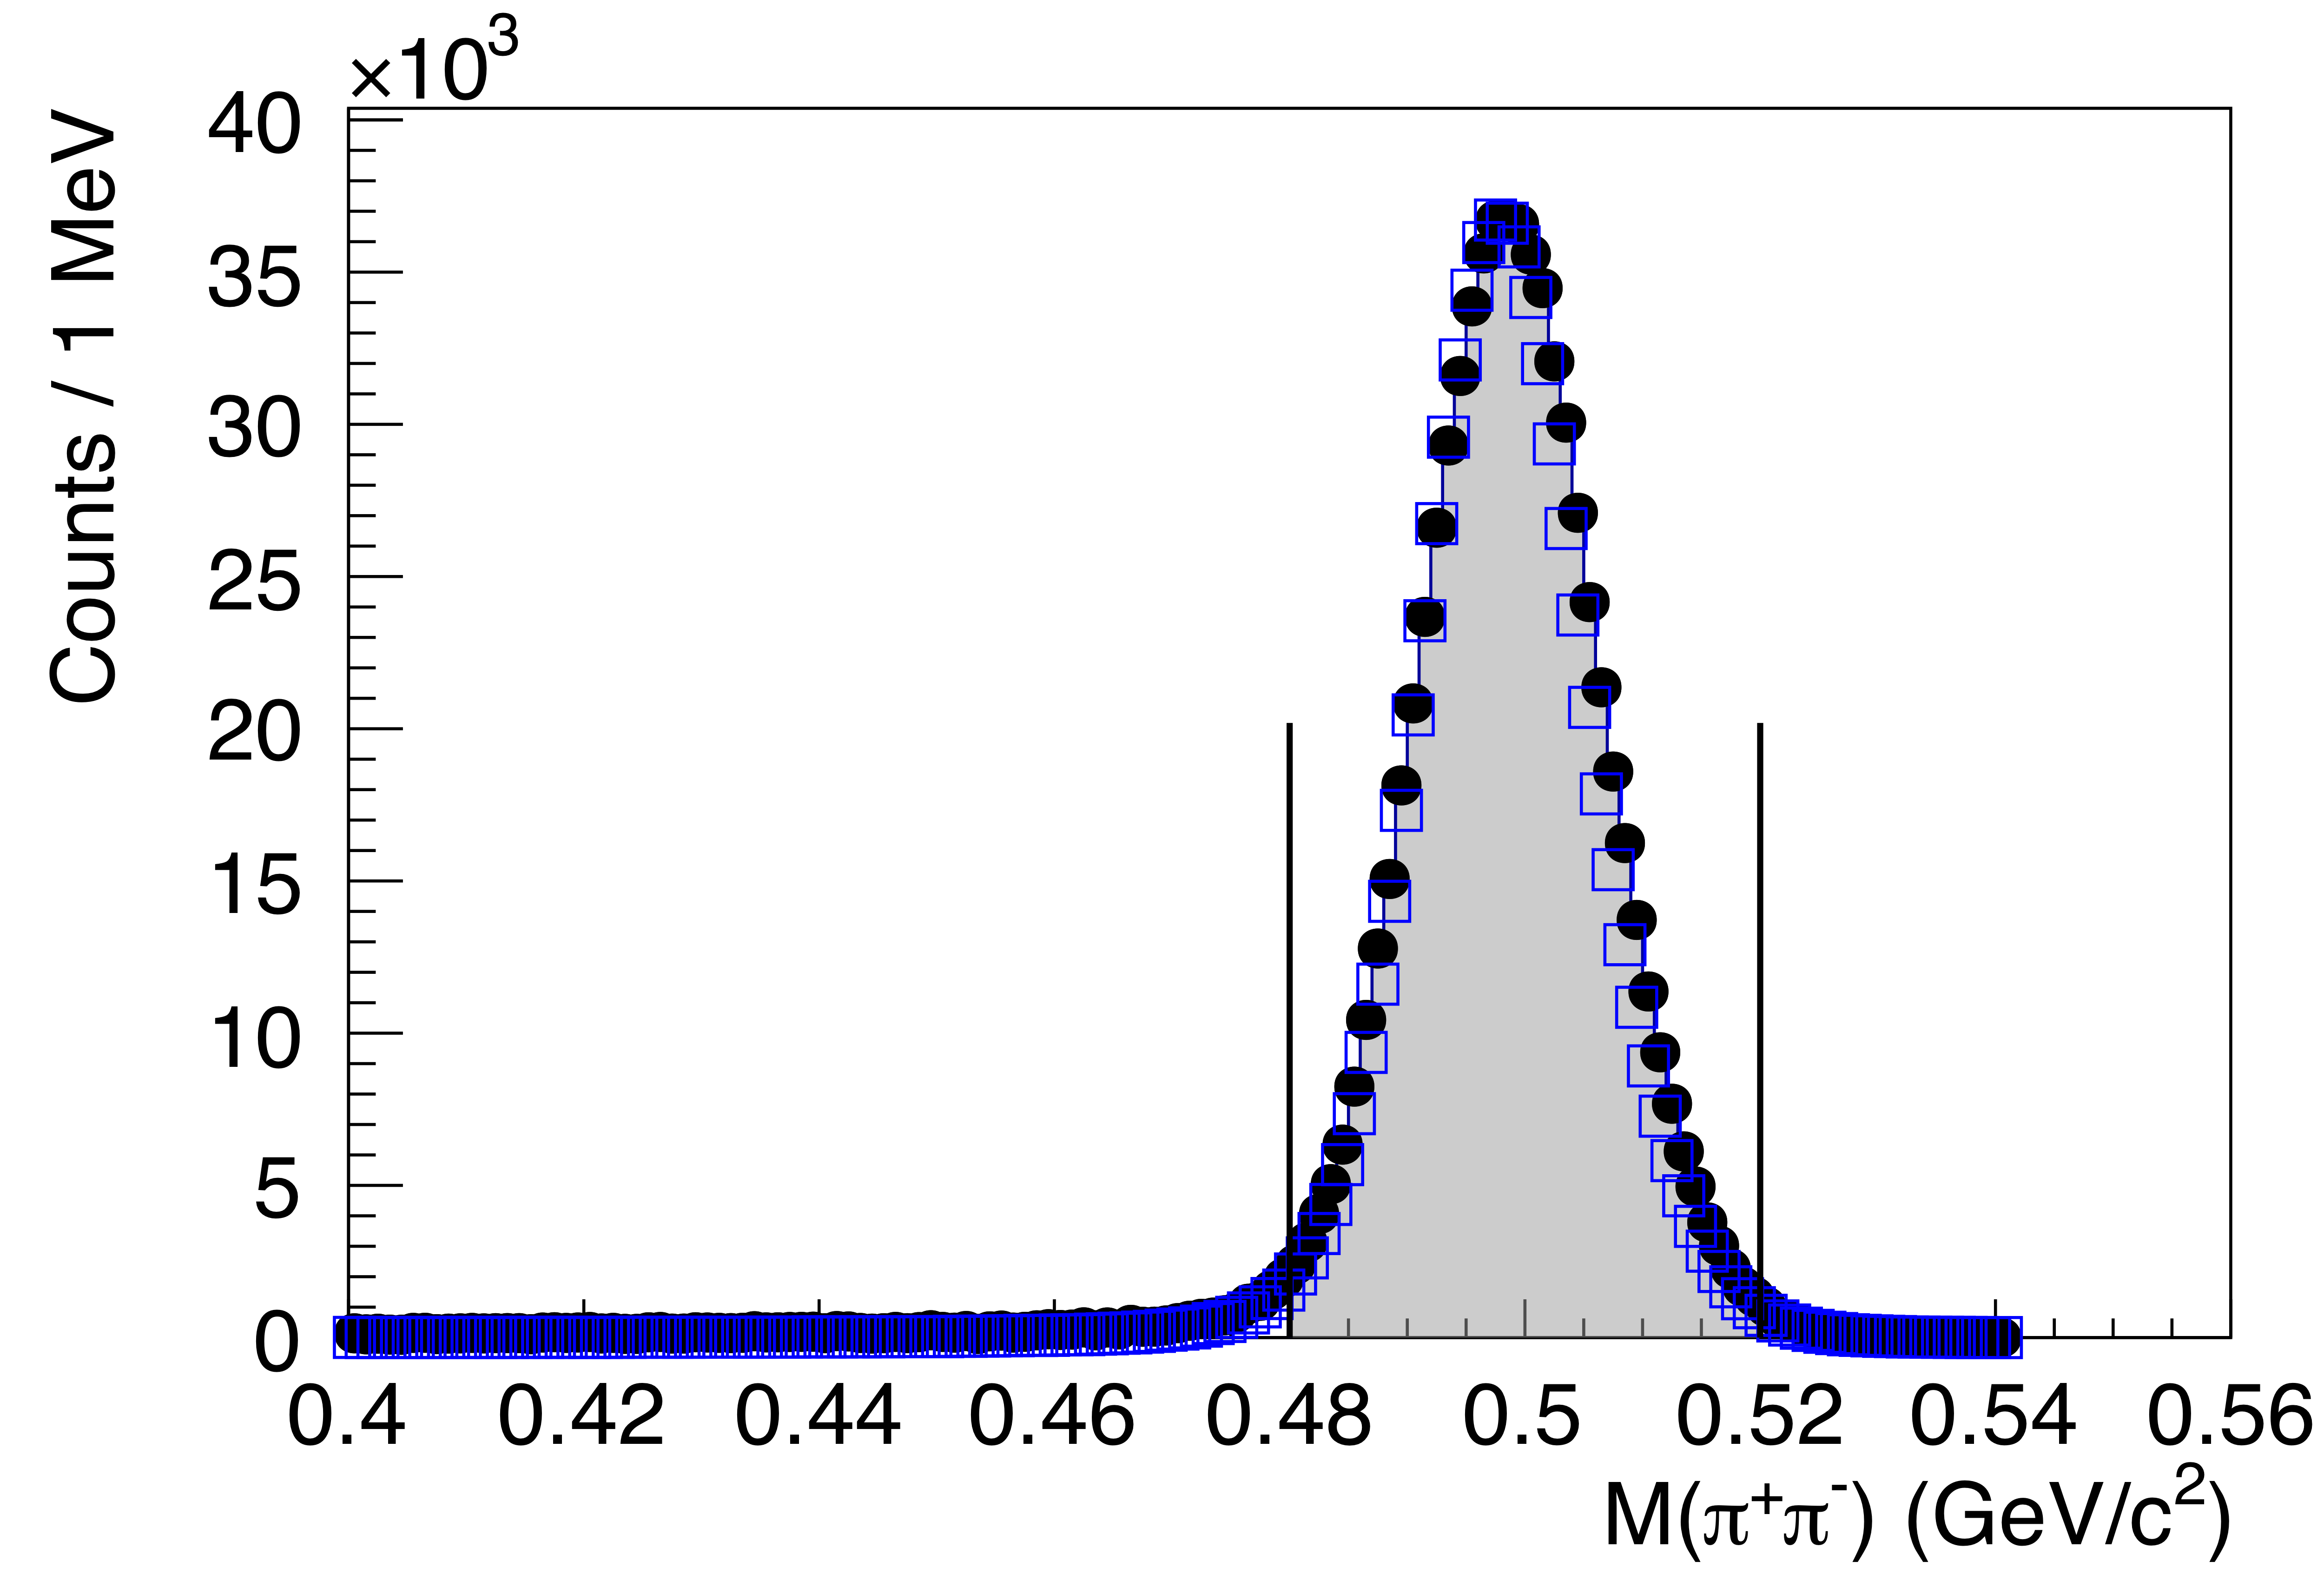
Figure 1b:
Distributions for selected $\gamma p \to K_S^0 K_L^0 p$ events where the $K_L^0$ is reconstructed as a missing particle, as described in the text, (top) the missing mass, showing a clear $K_L^0$ signal, and (bottom) the $\pi^+\pi^-$ invariant mass, showing a clear $K_S^0\to\pi^+\pi^-$ signal. The distributions for measured distributions (black points) agree well with the simulated ones (blue squares). The vertical lines show the regions selected for further analysis. The legend shown in the top figure applies to both. |
Phys. Rev. C112 (2025) 2, 025203: downloads png pdf |
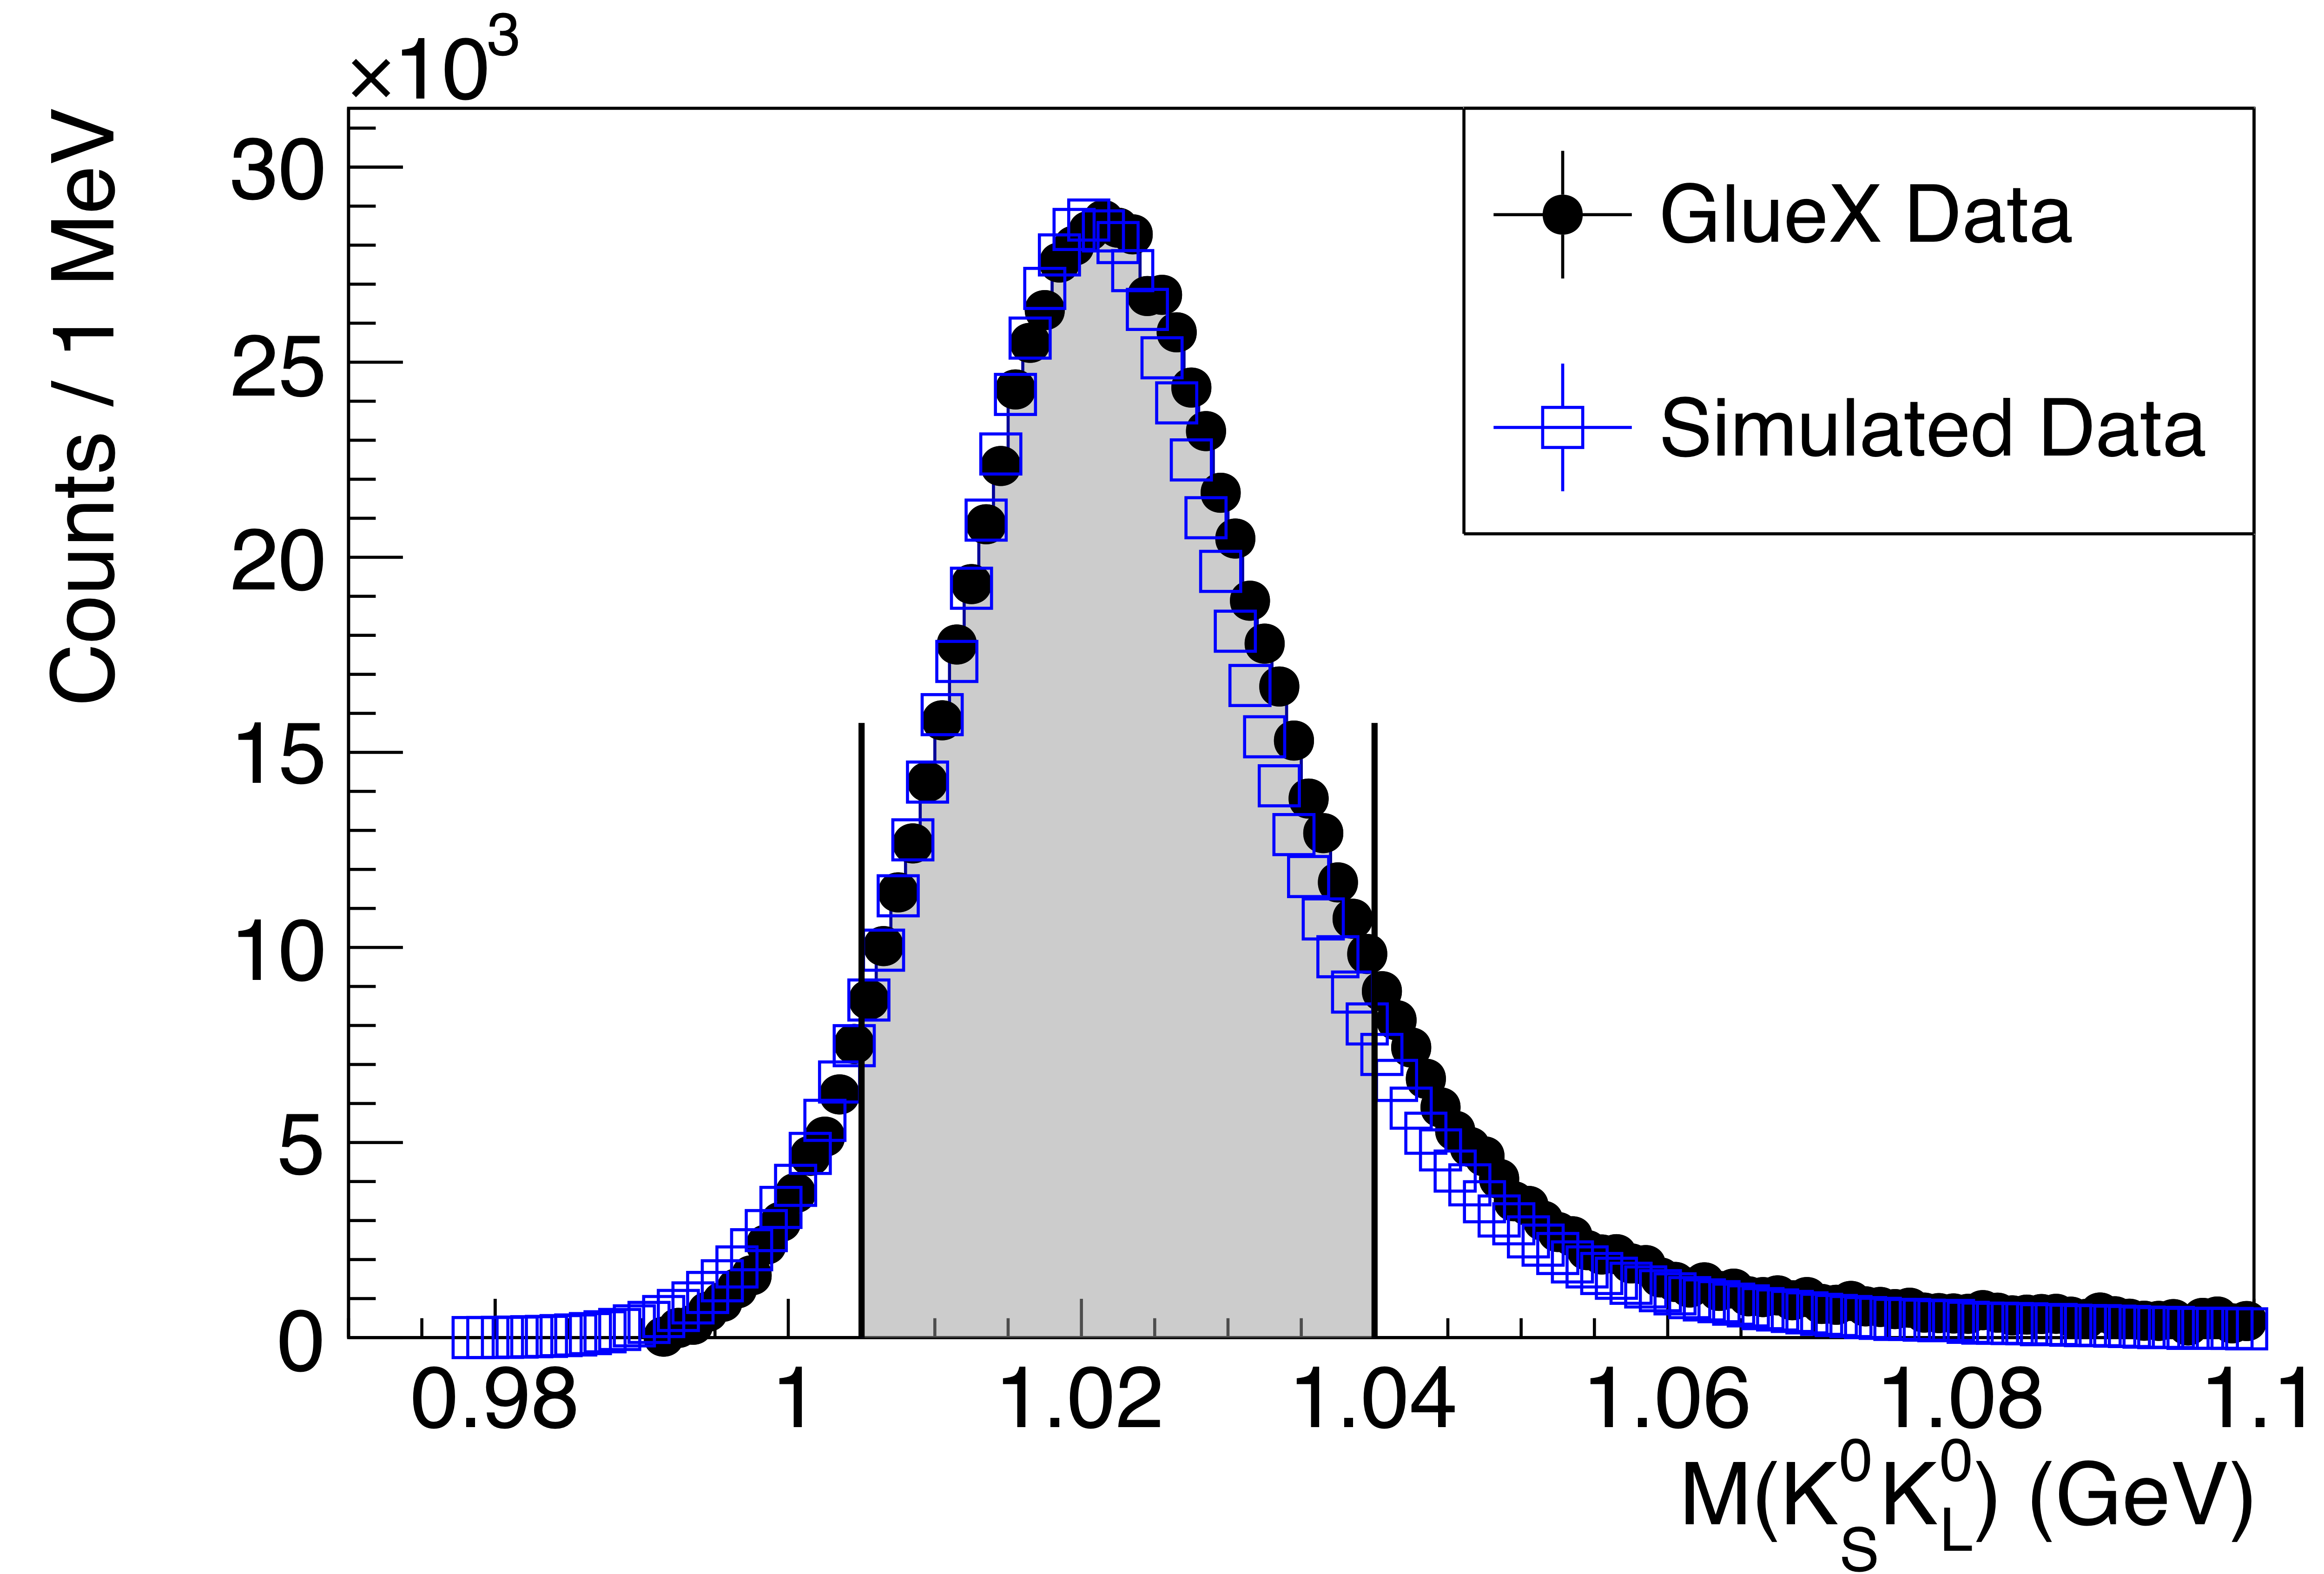
Figure 2a:
(Top) The $K_S^0K_L^0$ invariant mass distribution for selected events, showing a clear $\phi(1020)\to K_S^0K_L^0$ signal. (Bottom) The Mandelstam-$t$ distribution for the events selected in the top panel. The simulated events (blue squares) assume a constant exponential $t$-slope of $4.4 \mathrm{GeV^{-2}}$, and agree with the measured data (black points) up to $-t\approx1$ GeV$^2$. The shaded regions indicate the events selected for the SDME analysis. The legend shown in the top figure applies to both. |
Phys. Rev. C112 (2025) 2, 025203: downloads png pdf |
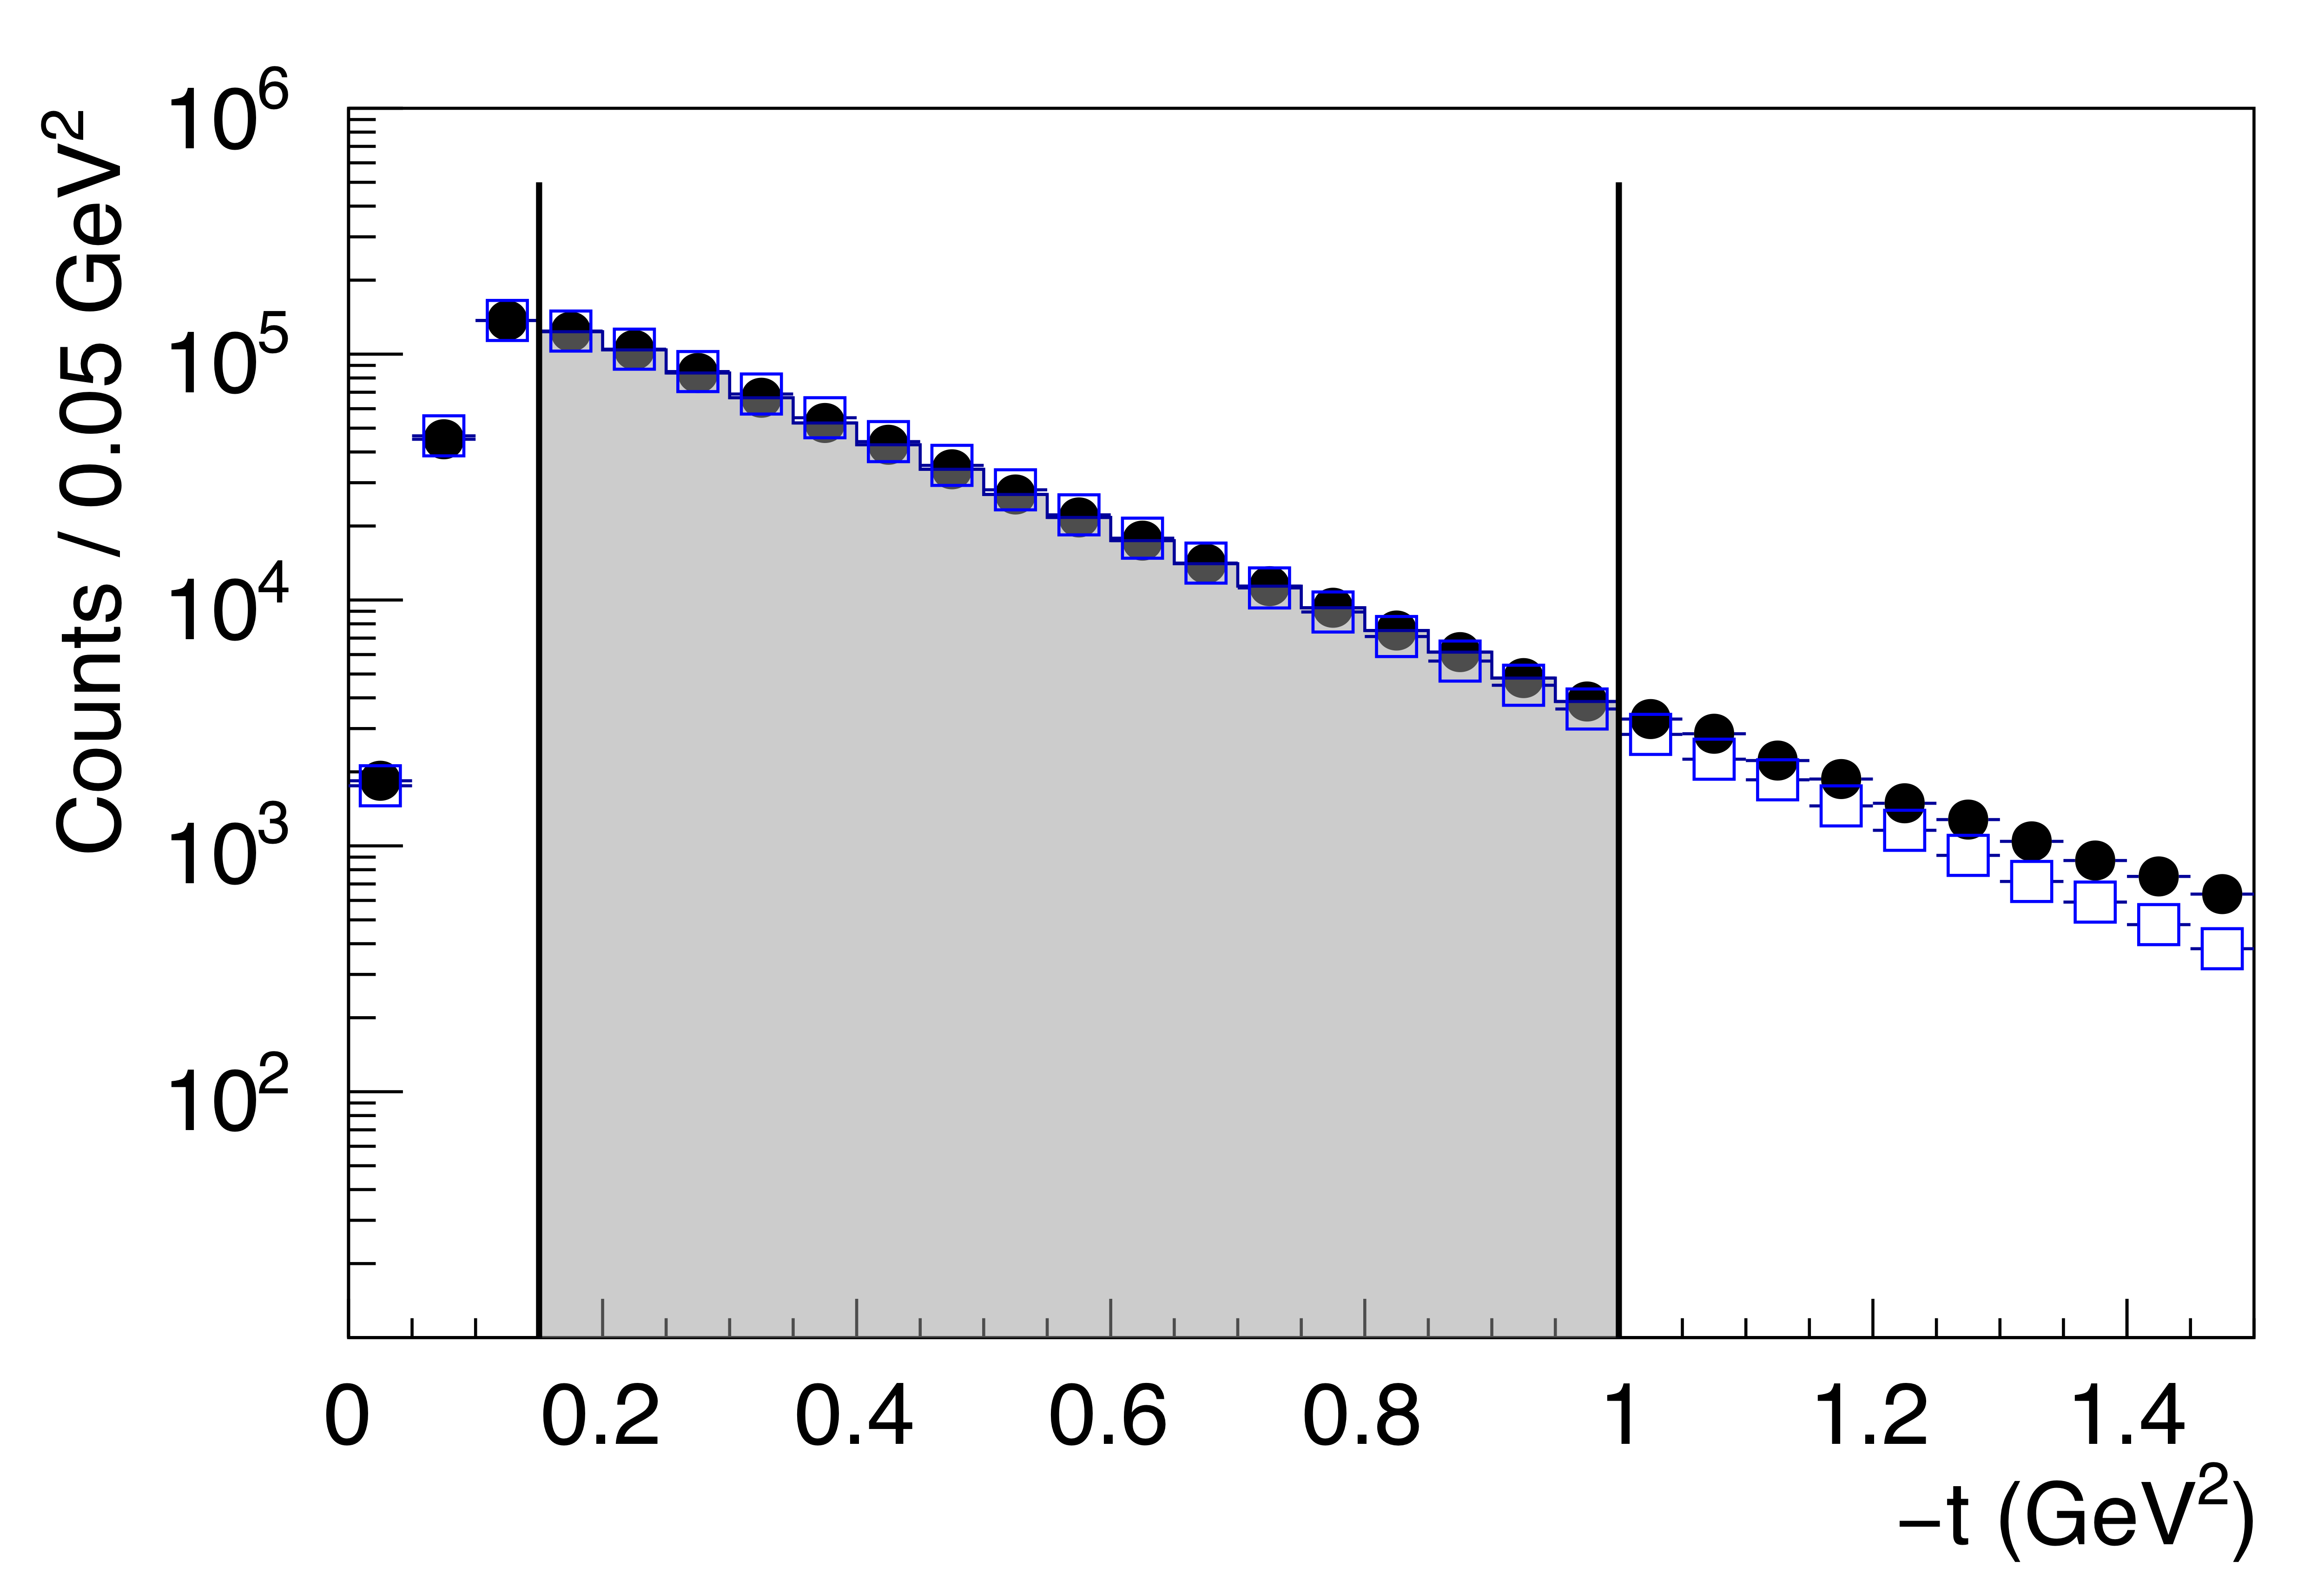
Figure 2b:
(Top) The $K_S^0K_L^0$ invariant mass distribution for selected events, showing a clear $\phi(1020)\to K_S^0K_L^0$ signal. (Bottom) The Mandelstam-$t$ distribution for the events selected in the top panel. The simulated events (blue squares) assume a constant exponential $t$-slope of $4.4 \mathrm{GeV^{-2}}$, and agree with the measured data (black points) up to $-t\approx1$ GeV$^2$. The shaded regions indicate the events selected for the SDME analysis. The legend shown in the top figure applies to both. |
Phys. Rev. C112 (2025) 2, 025203: downloads png pdf |
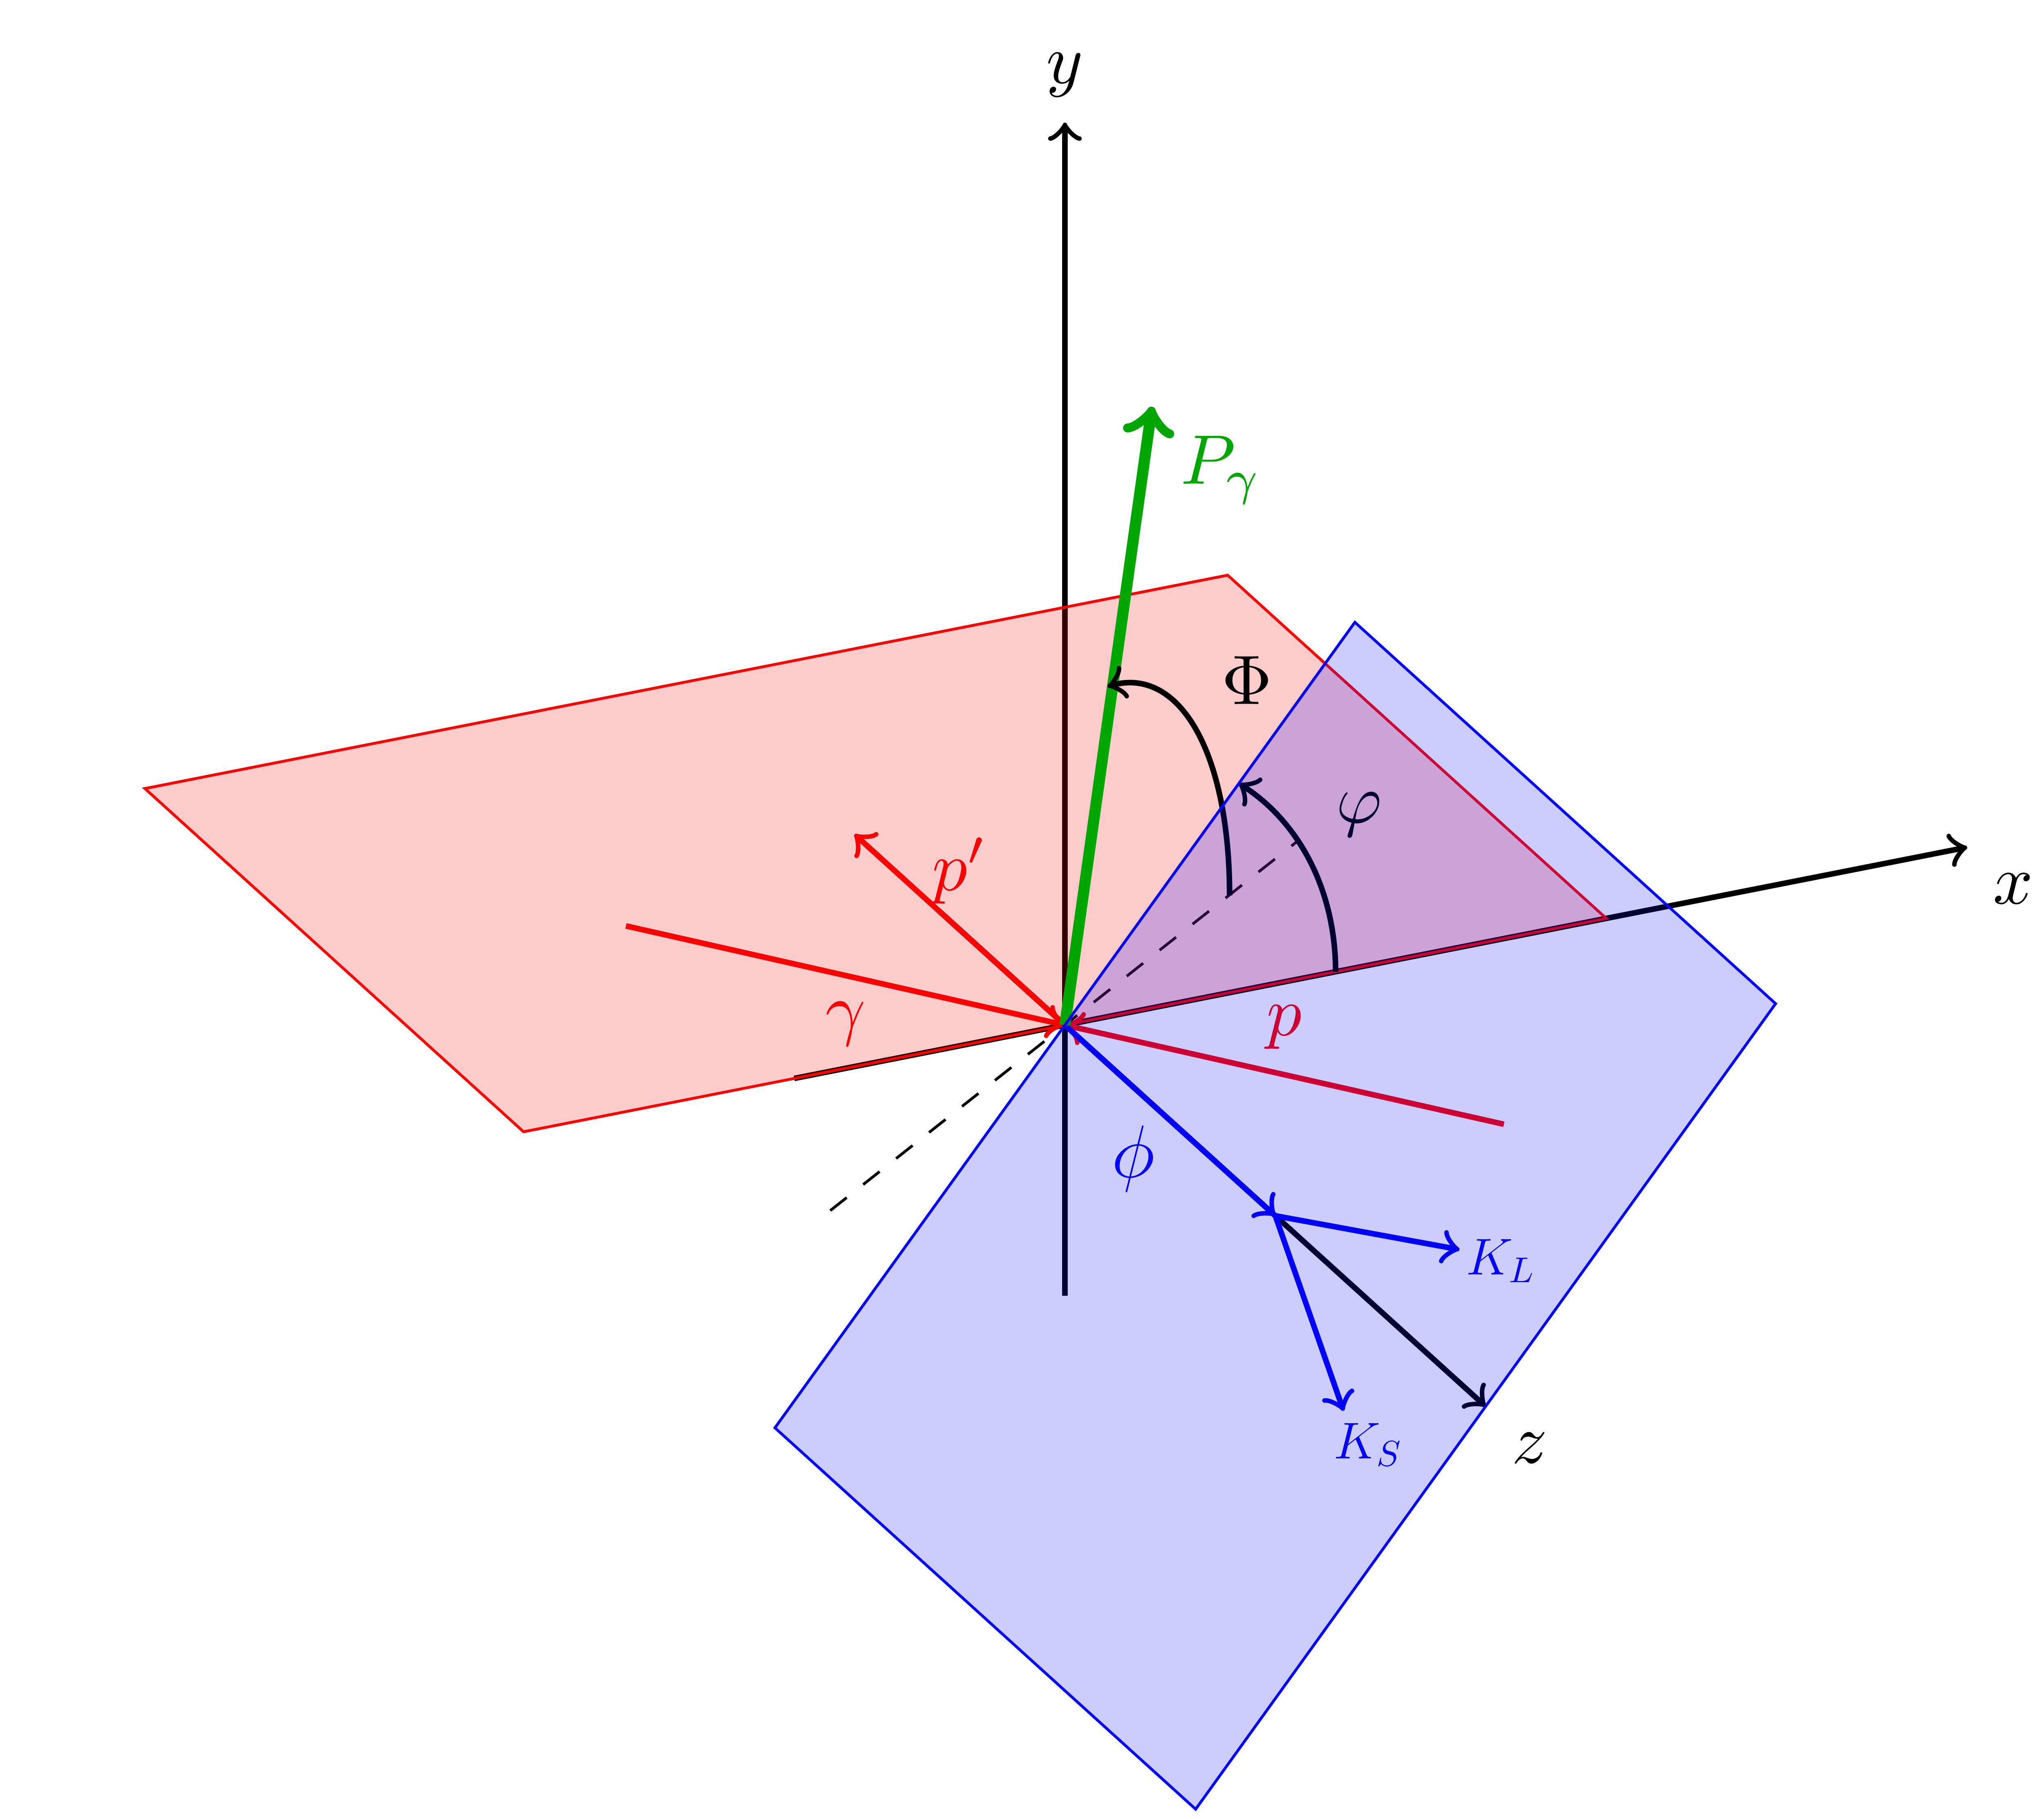
Figure 3a:
Definition of the angles in the center-of-mass frame for the decay $\phi(1020) \to K_S^0K_L^0$. The hadronic production plane is shown in red and the $\phi(1020)$ decay plane in blue. The polarization vector (green) has an angle $\Phi$ with respect to the hadronic production plane. |
Phys. Rev. C112 (2025) 2, 025203: downloads png pdf |
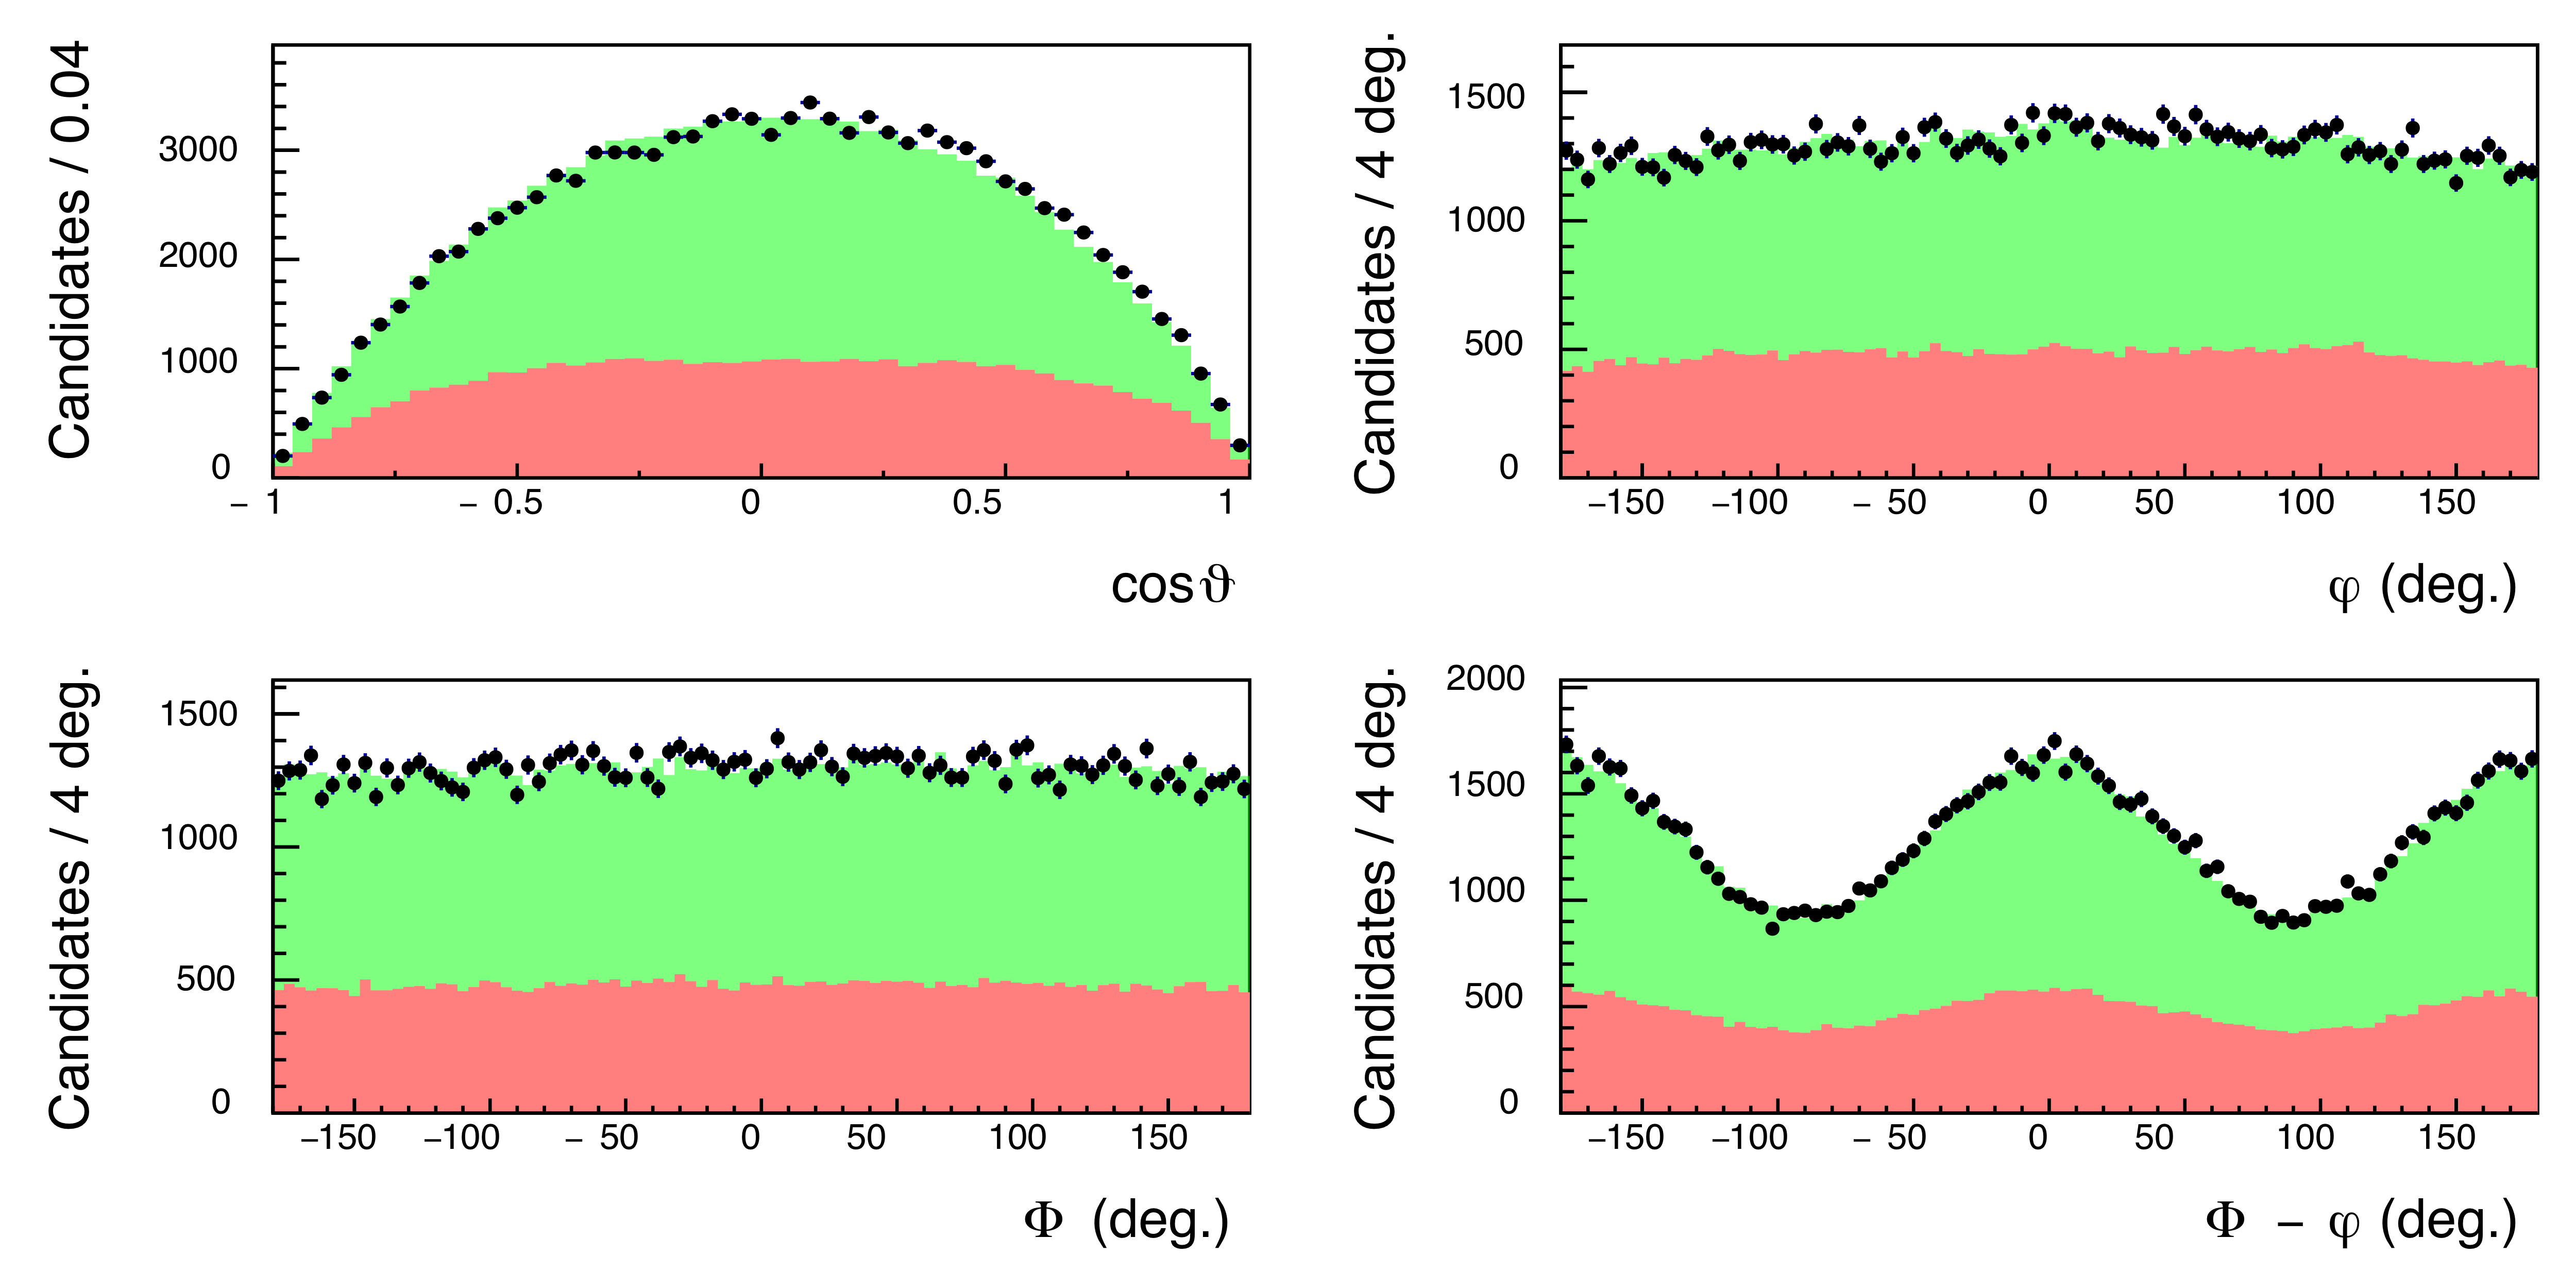
Figure 4a:
Comparison of measured angular distributions (black points) to accepted MC events weighted by the fit result (green) and the background from events with mismatched beam photons (red) for the range $-t=0.150-0.185$ GeV$^2$, (top left) the cosine of the helicity angle $\vartheta$, (top right) the helicity angle $\varphi$, (bottom left) the azimuthal angle $\Phi$ of the beam photon polarization vector with respect to the production plane, (bottom right) the difference between $\Phi$ and $\varphi$. |
Phys. Rev. C112 (2025) 2, 025203: downloads png pdf |
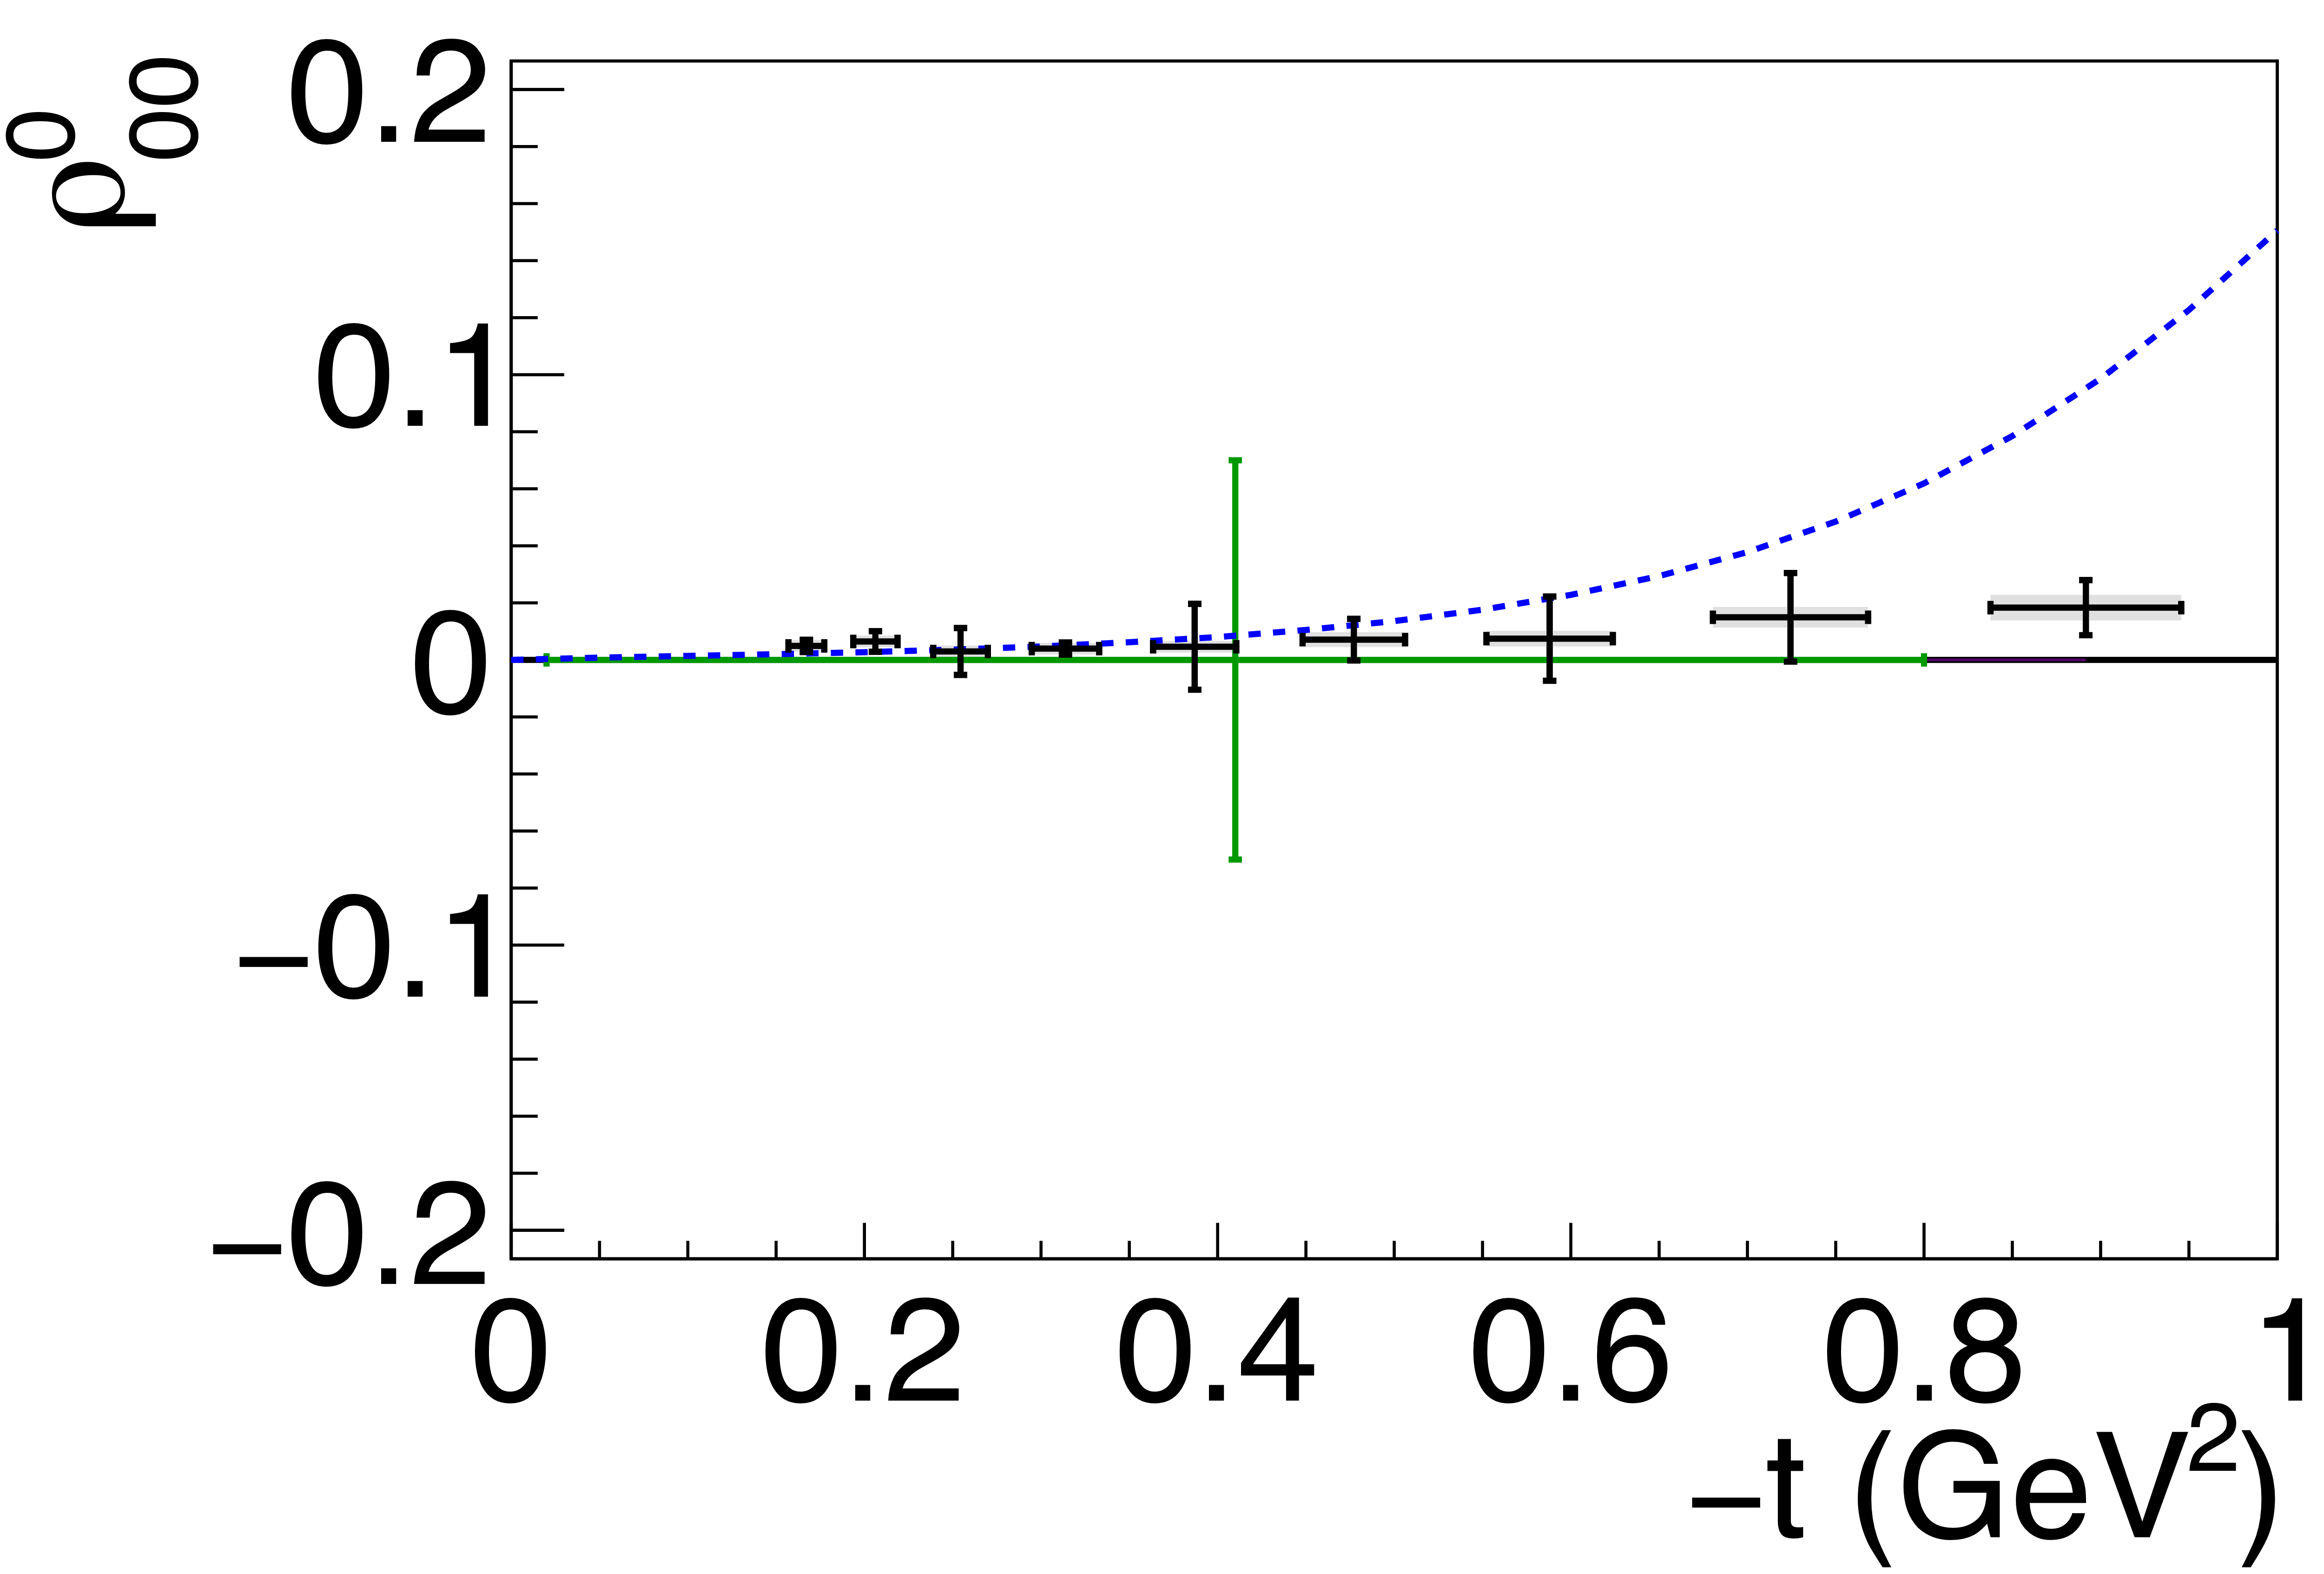
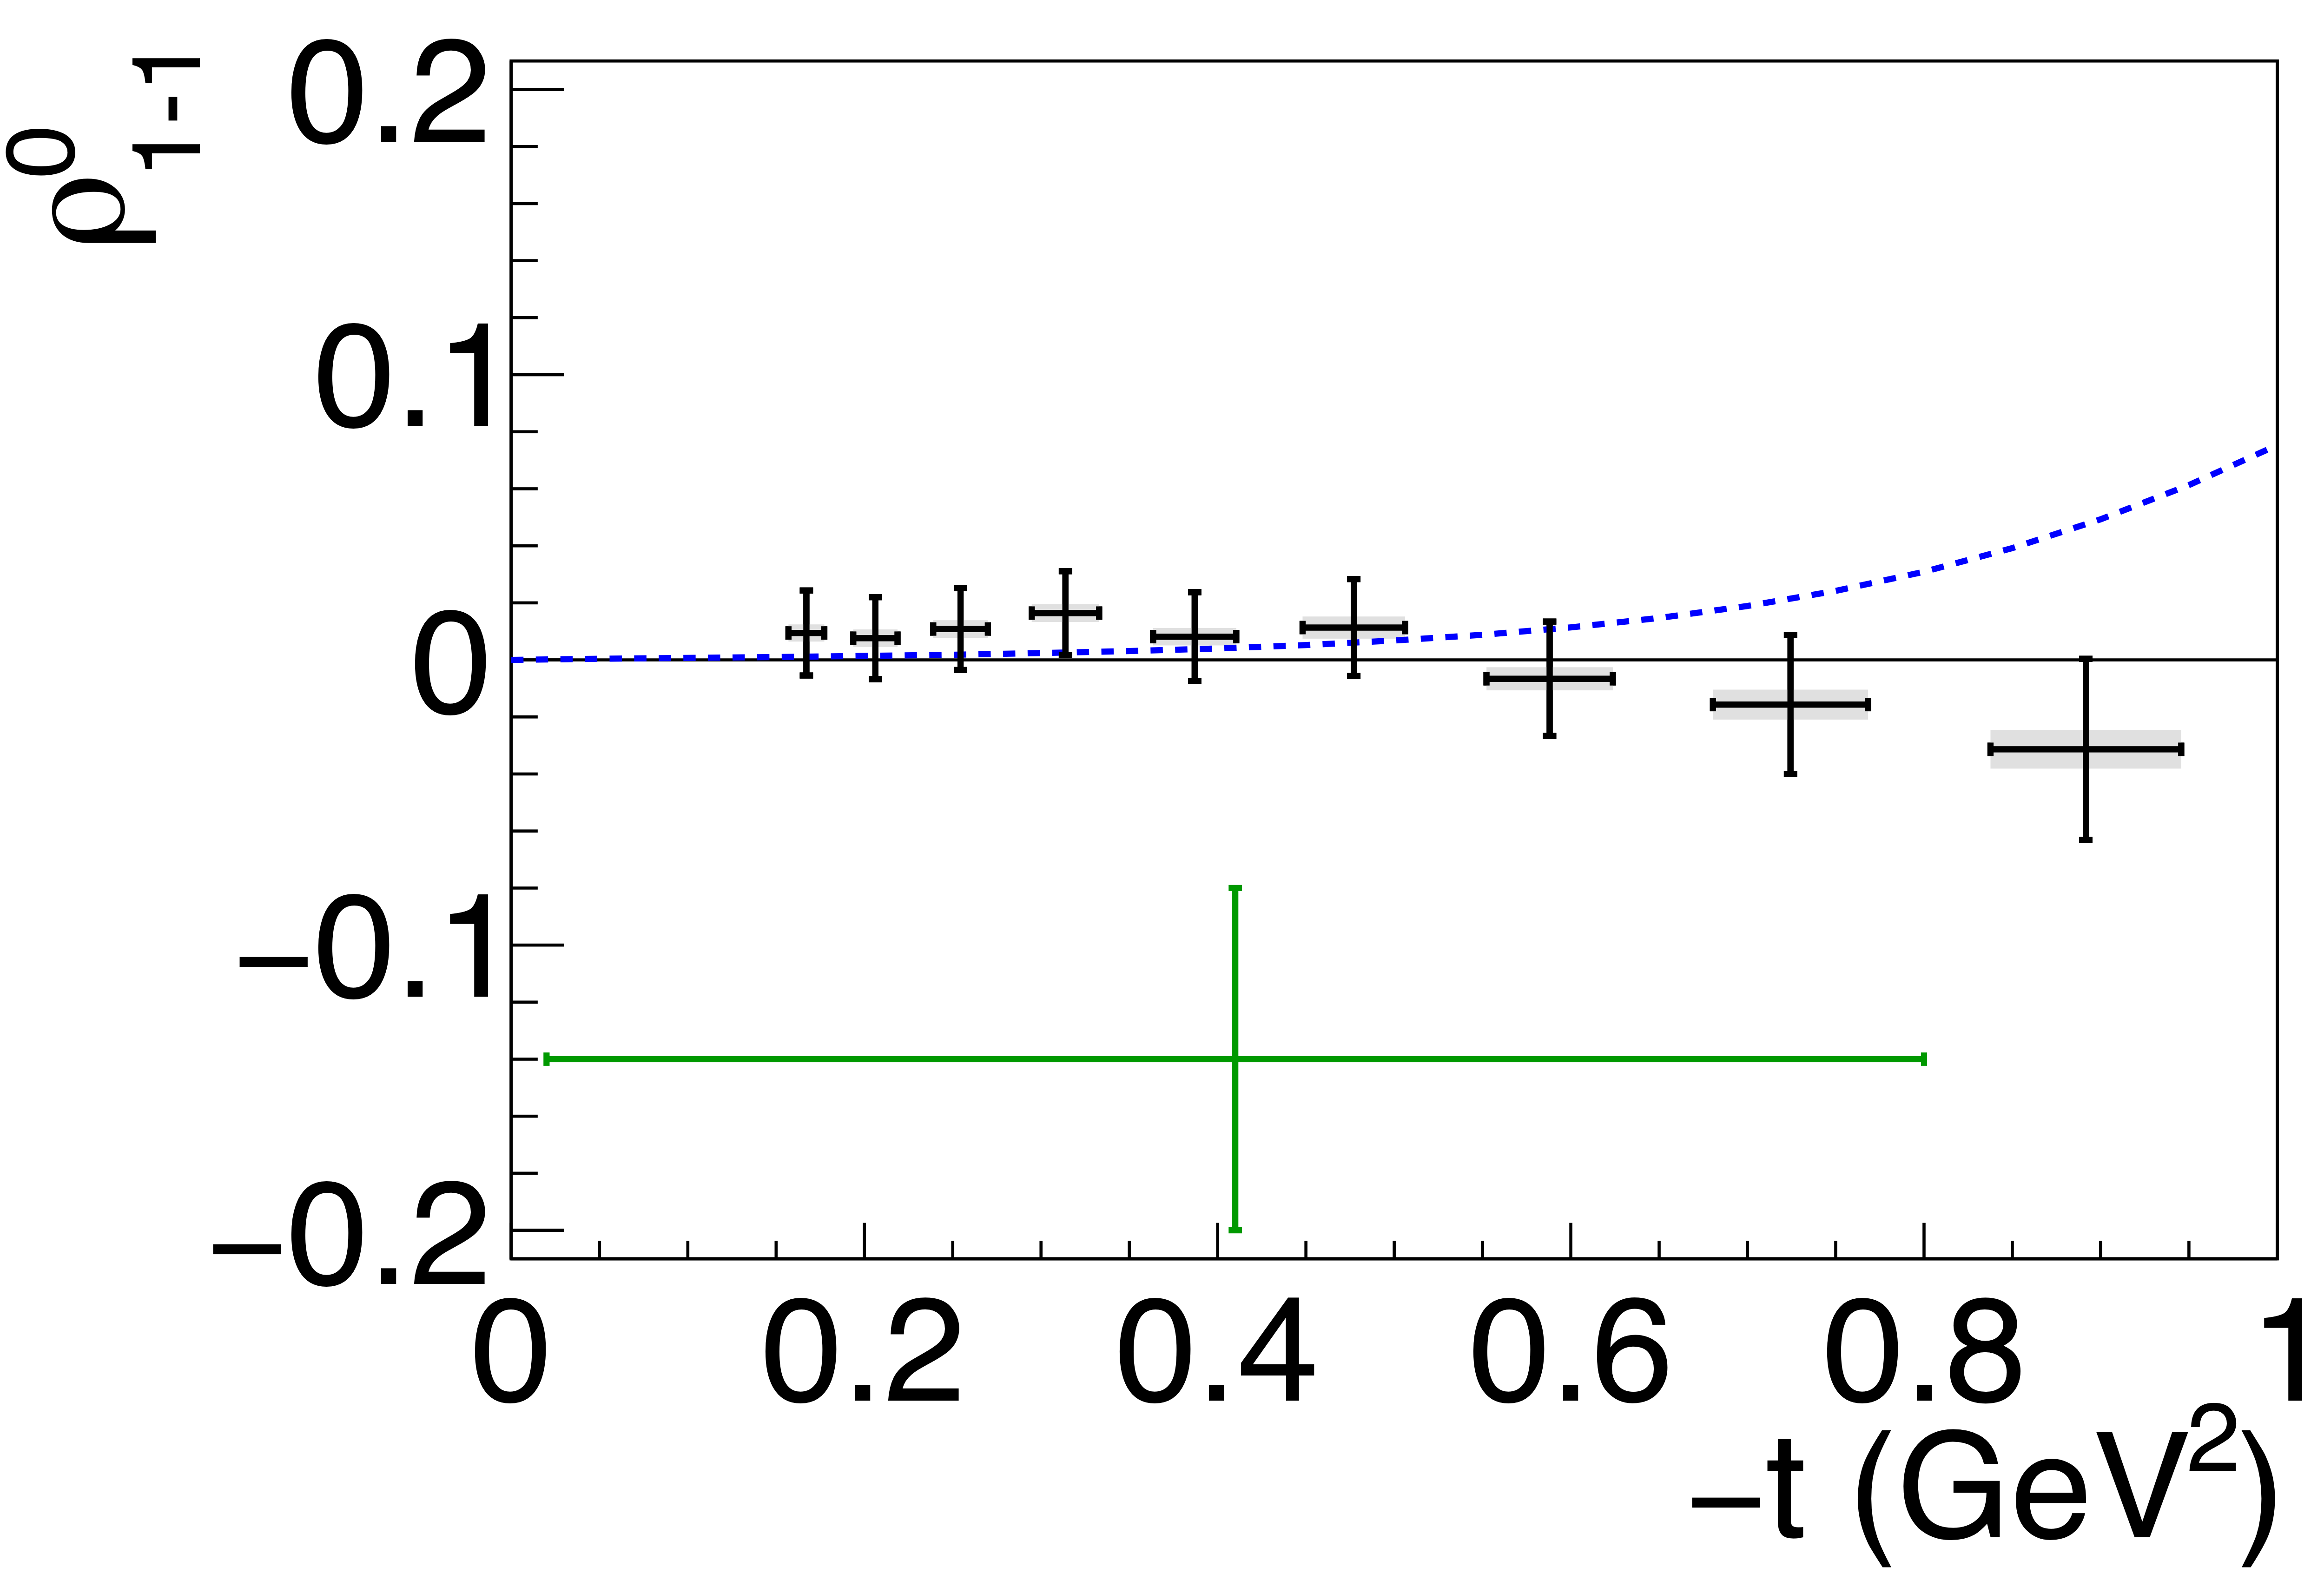
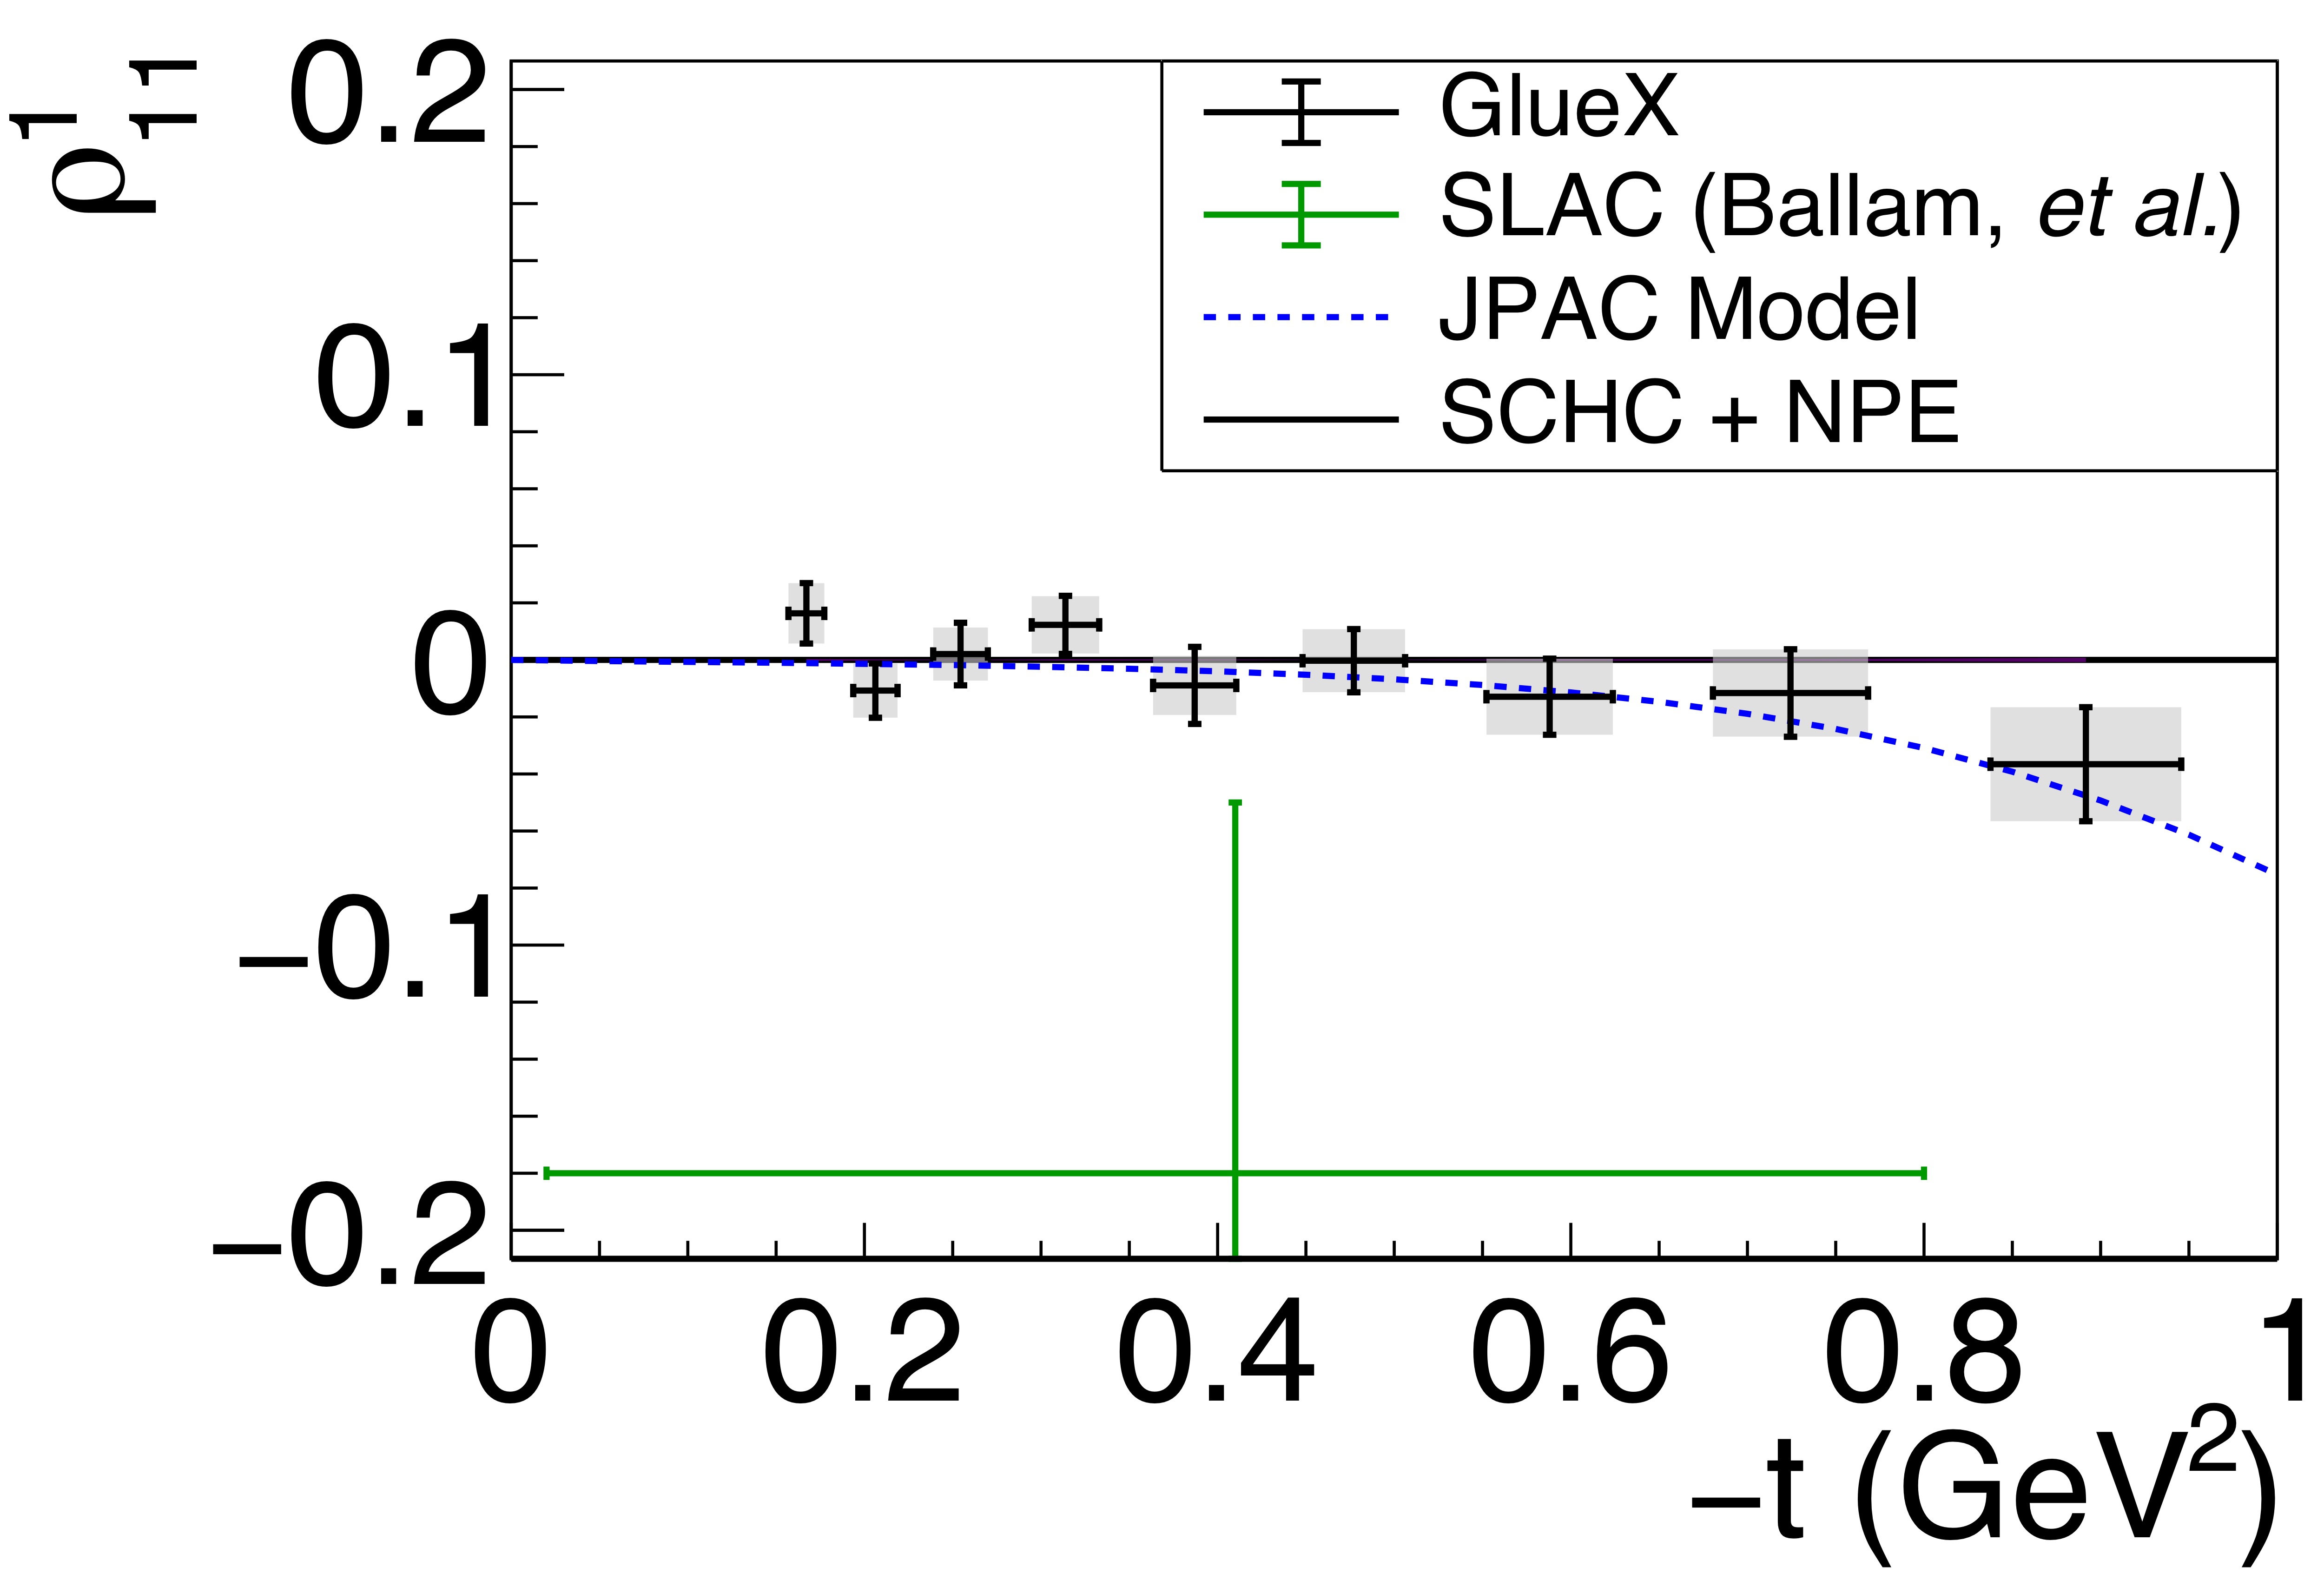
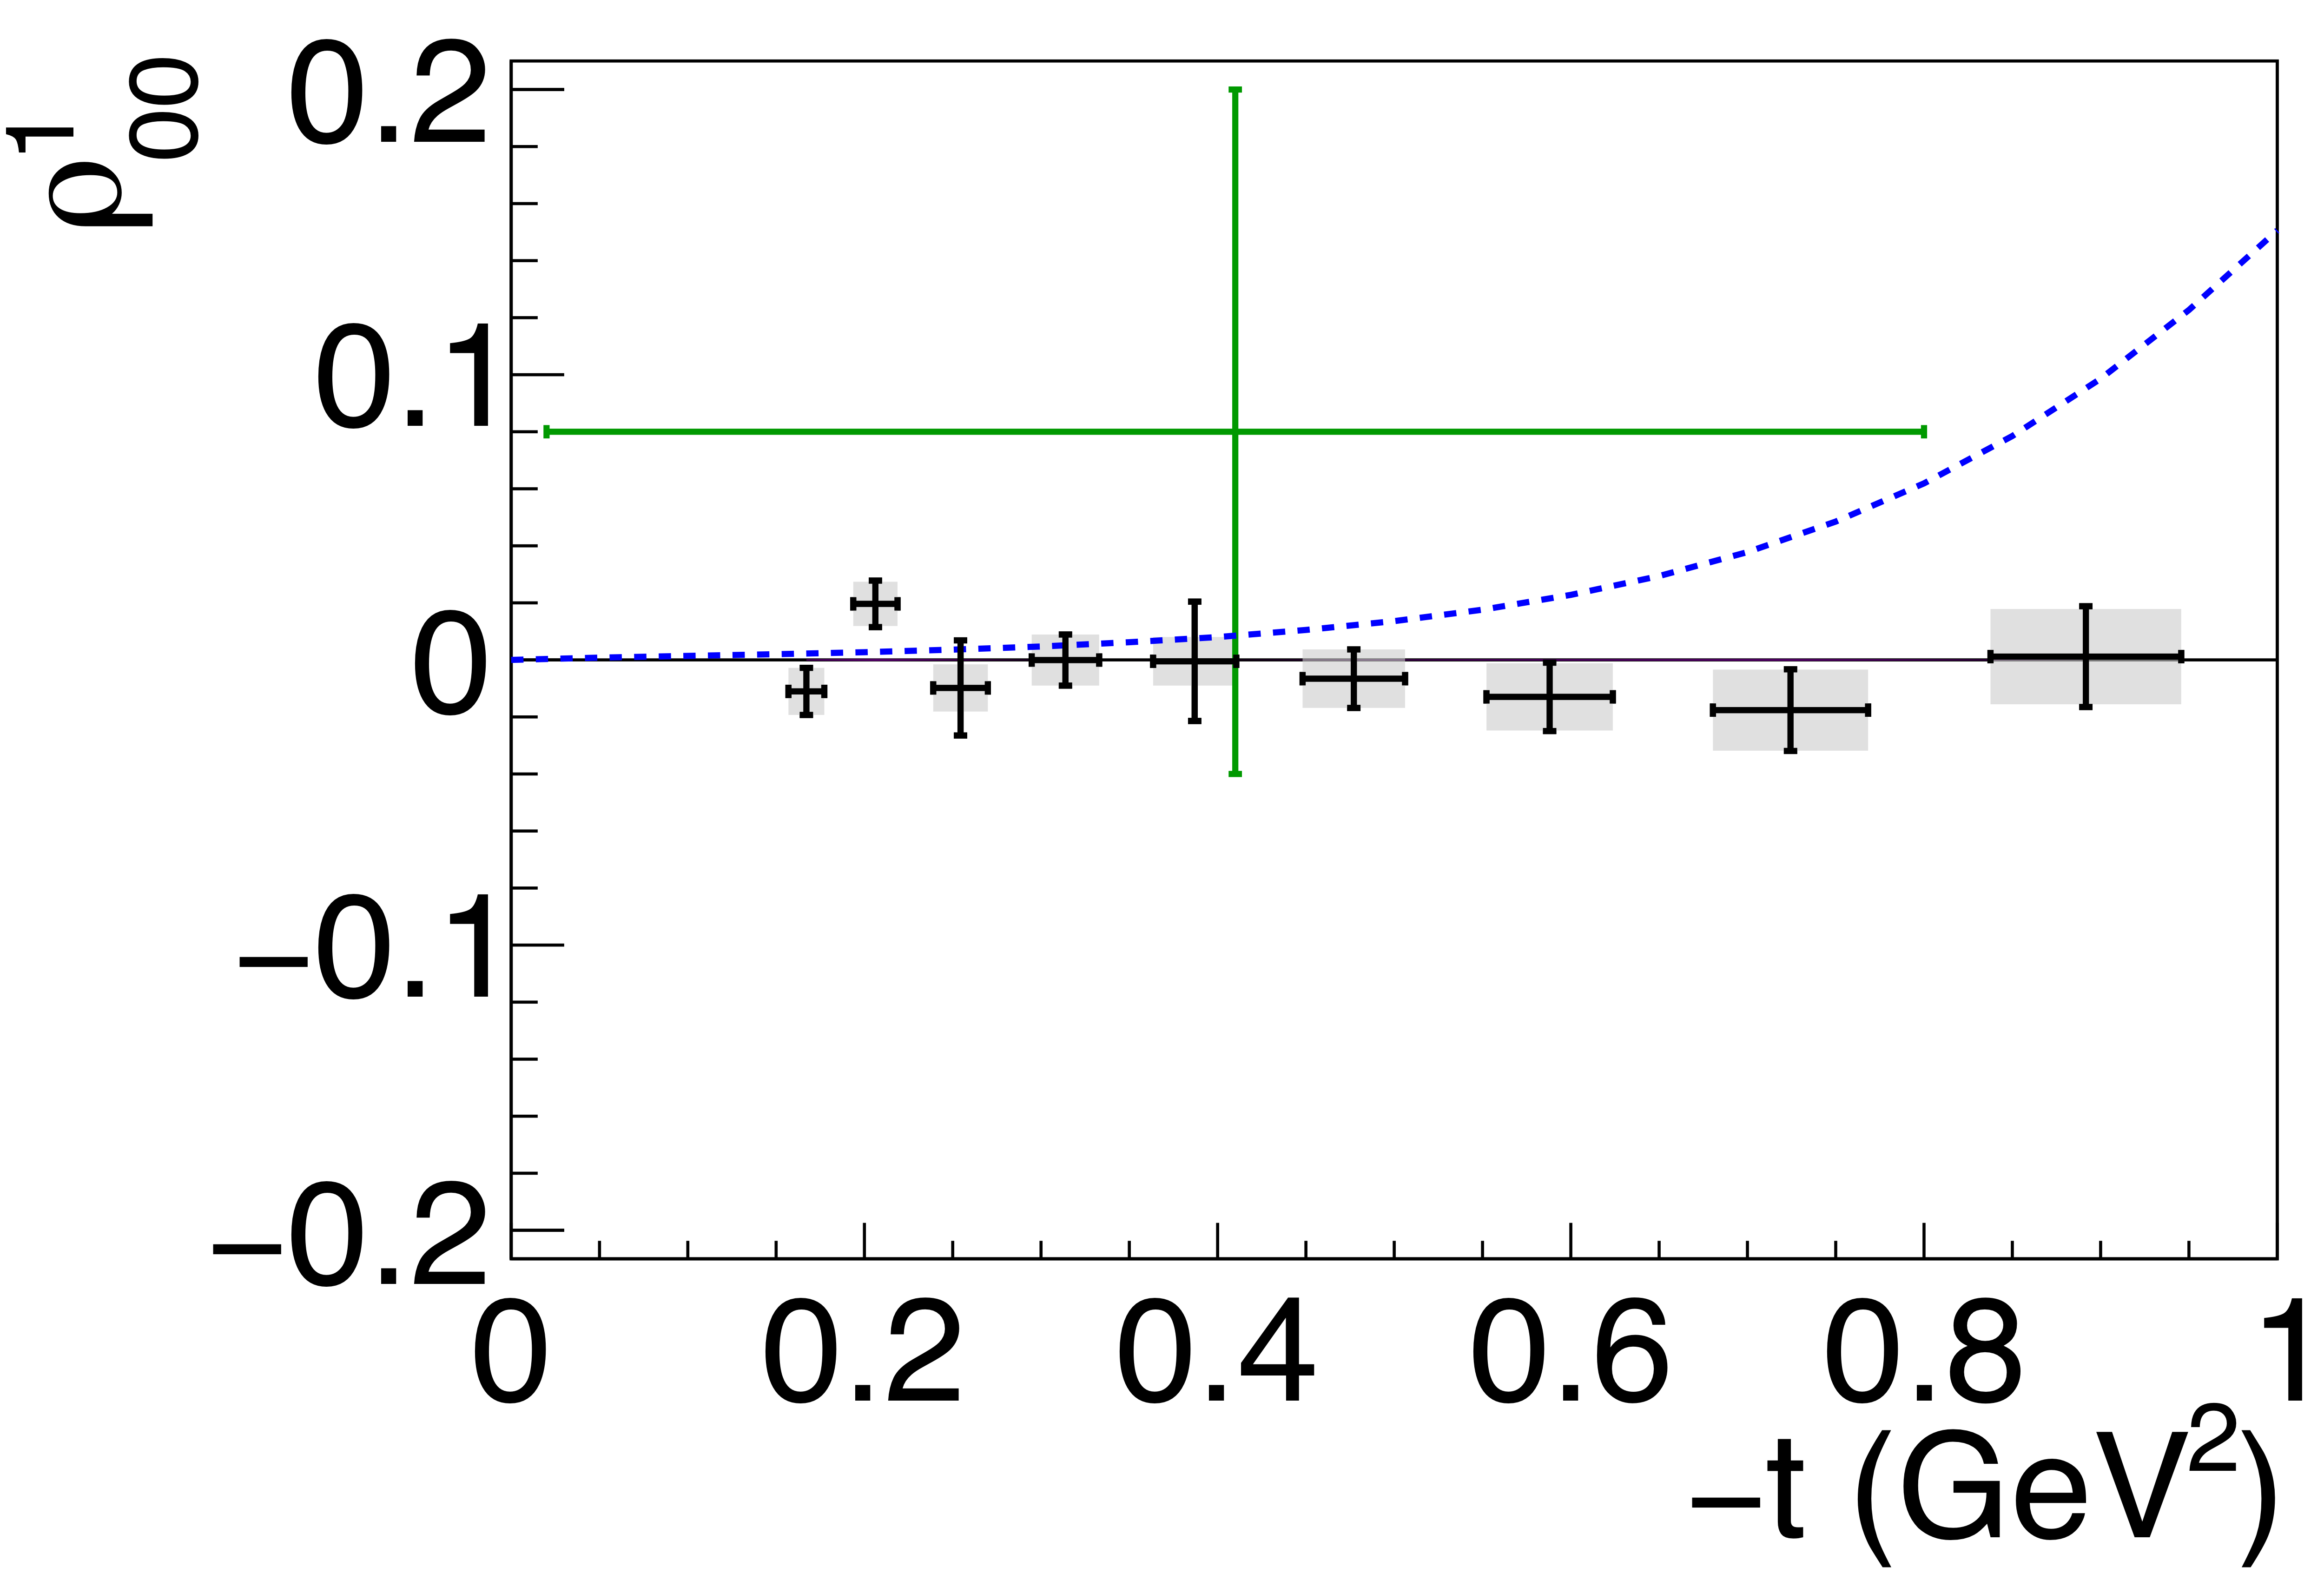
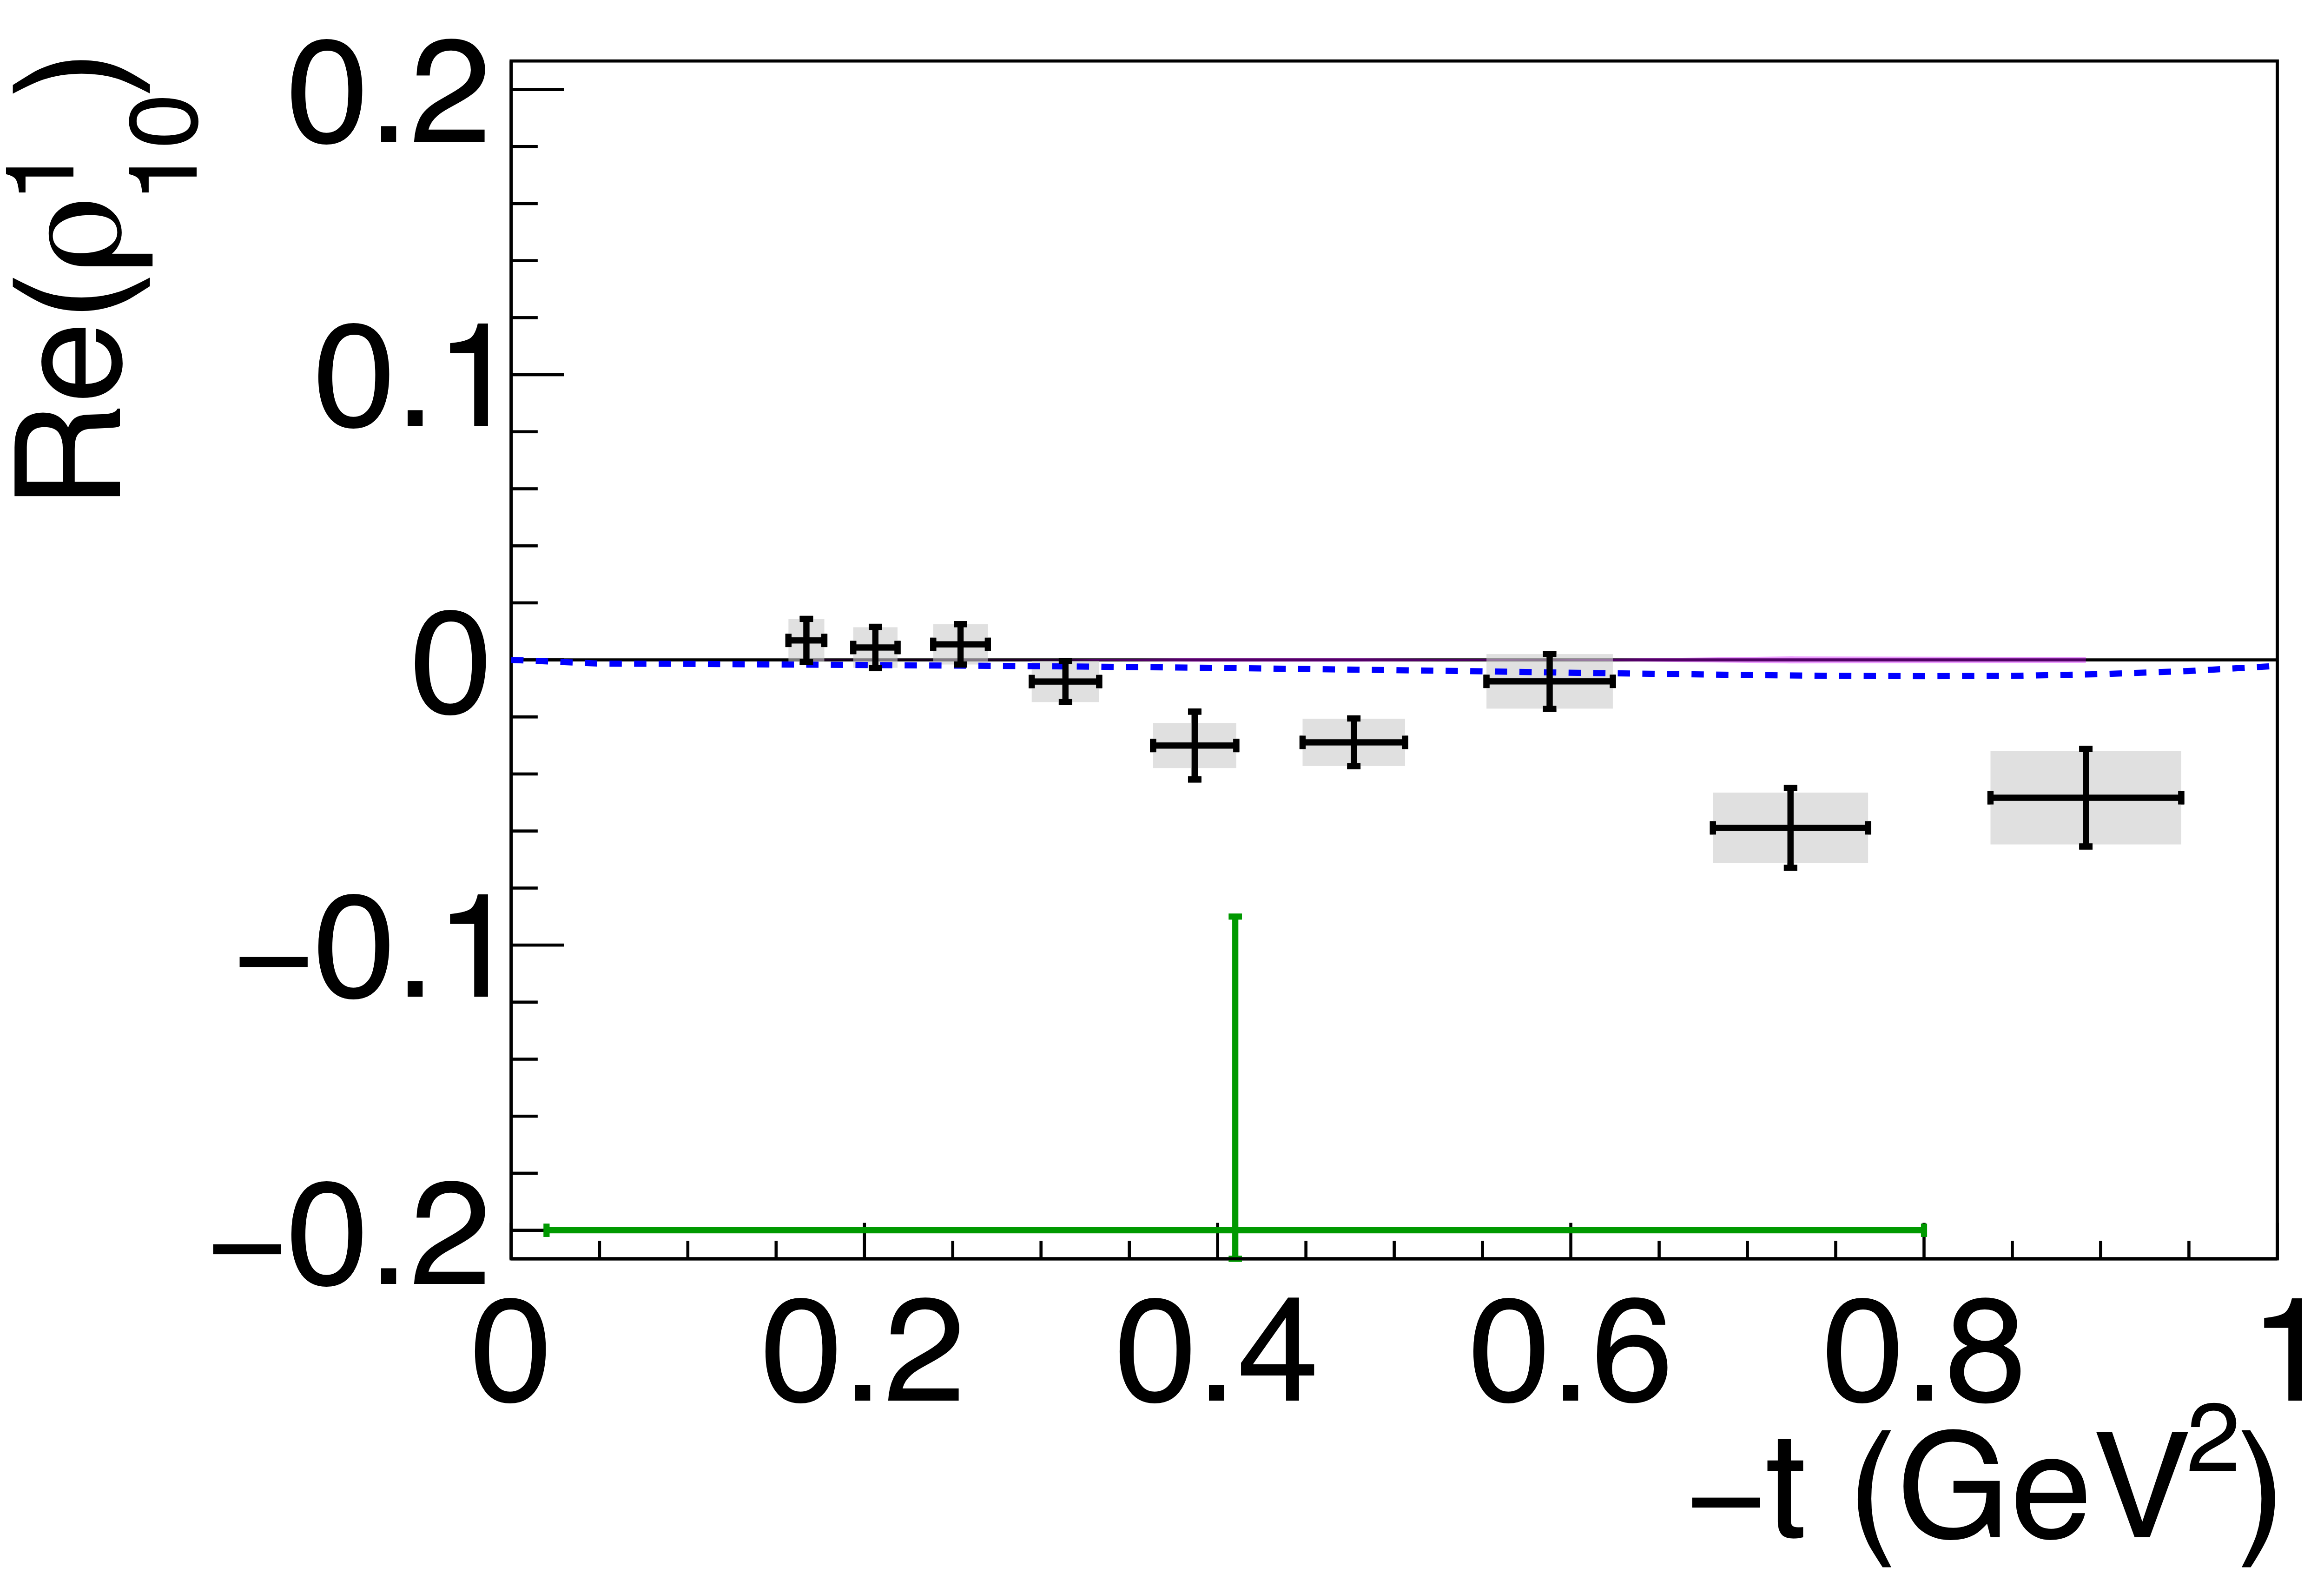
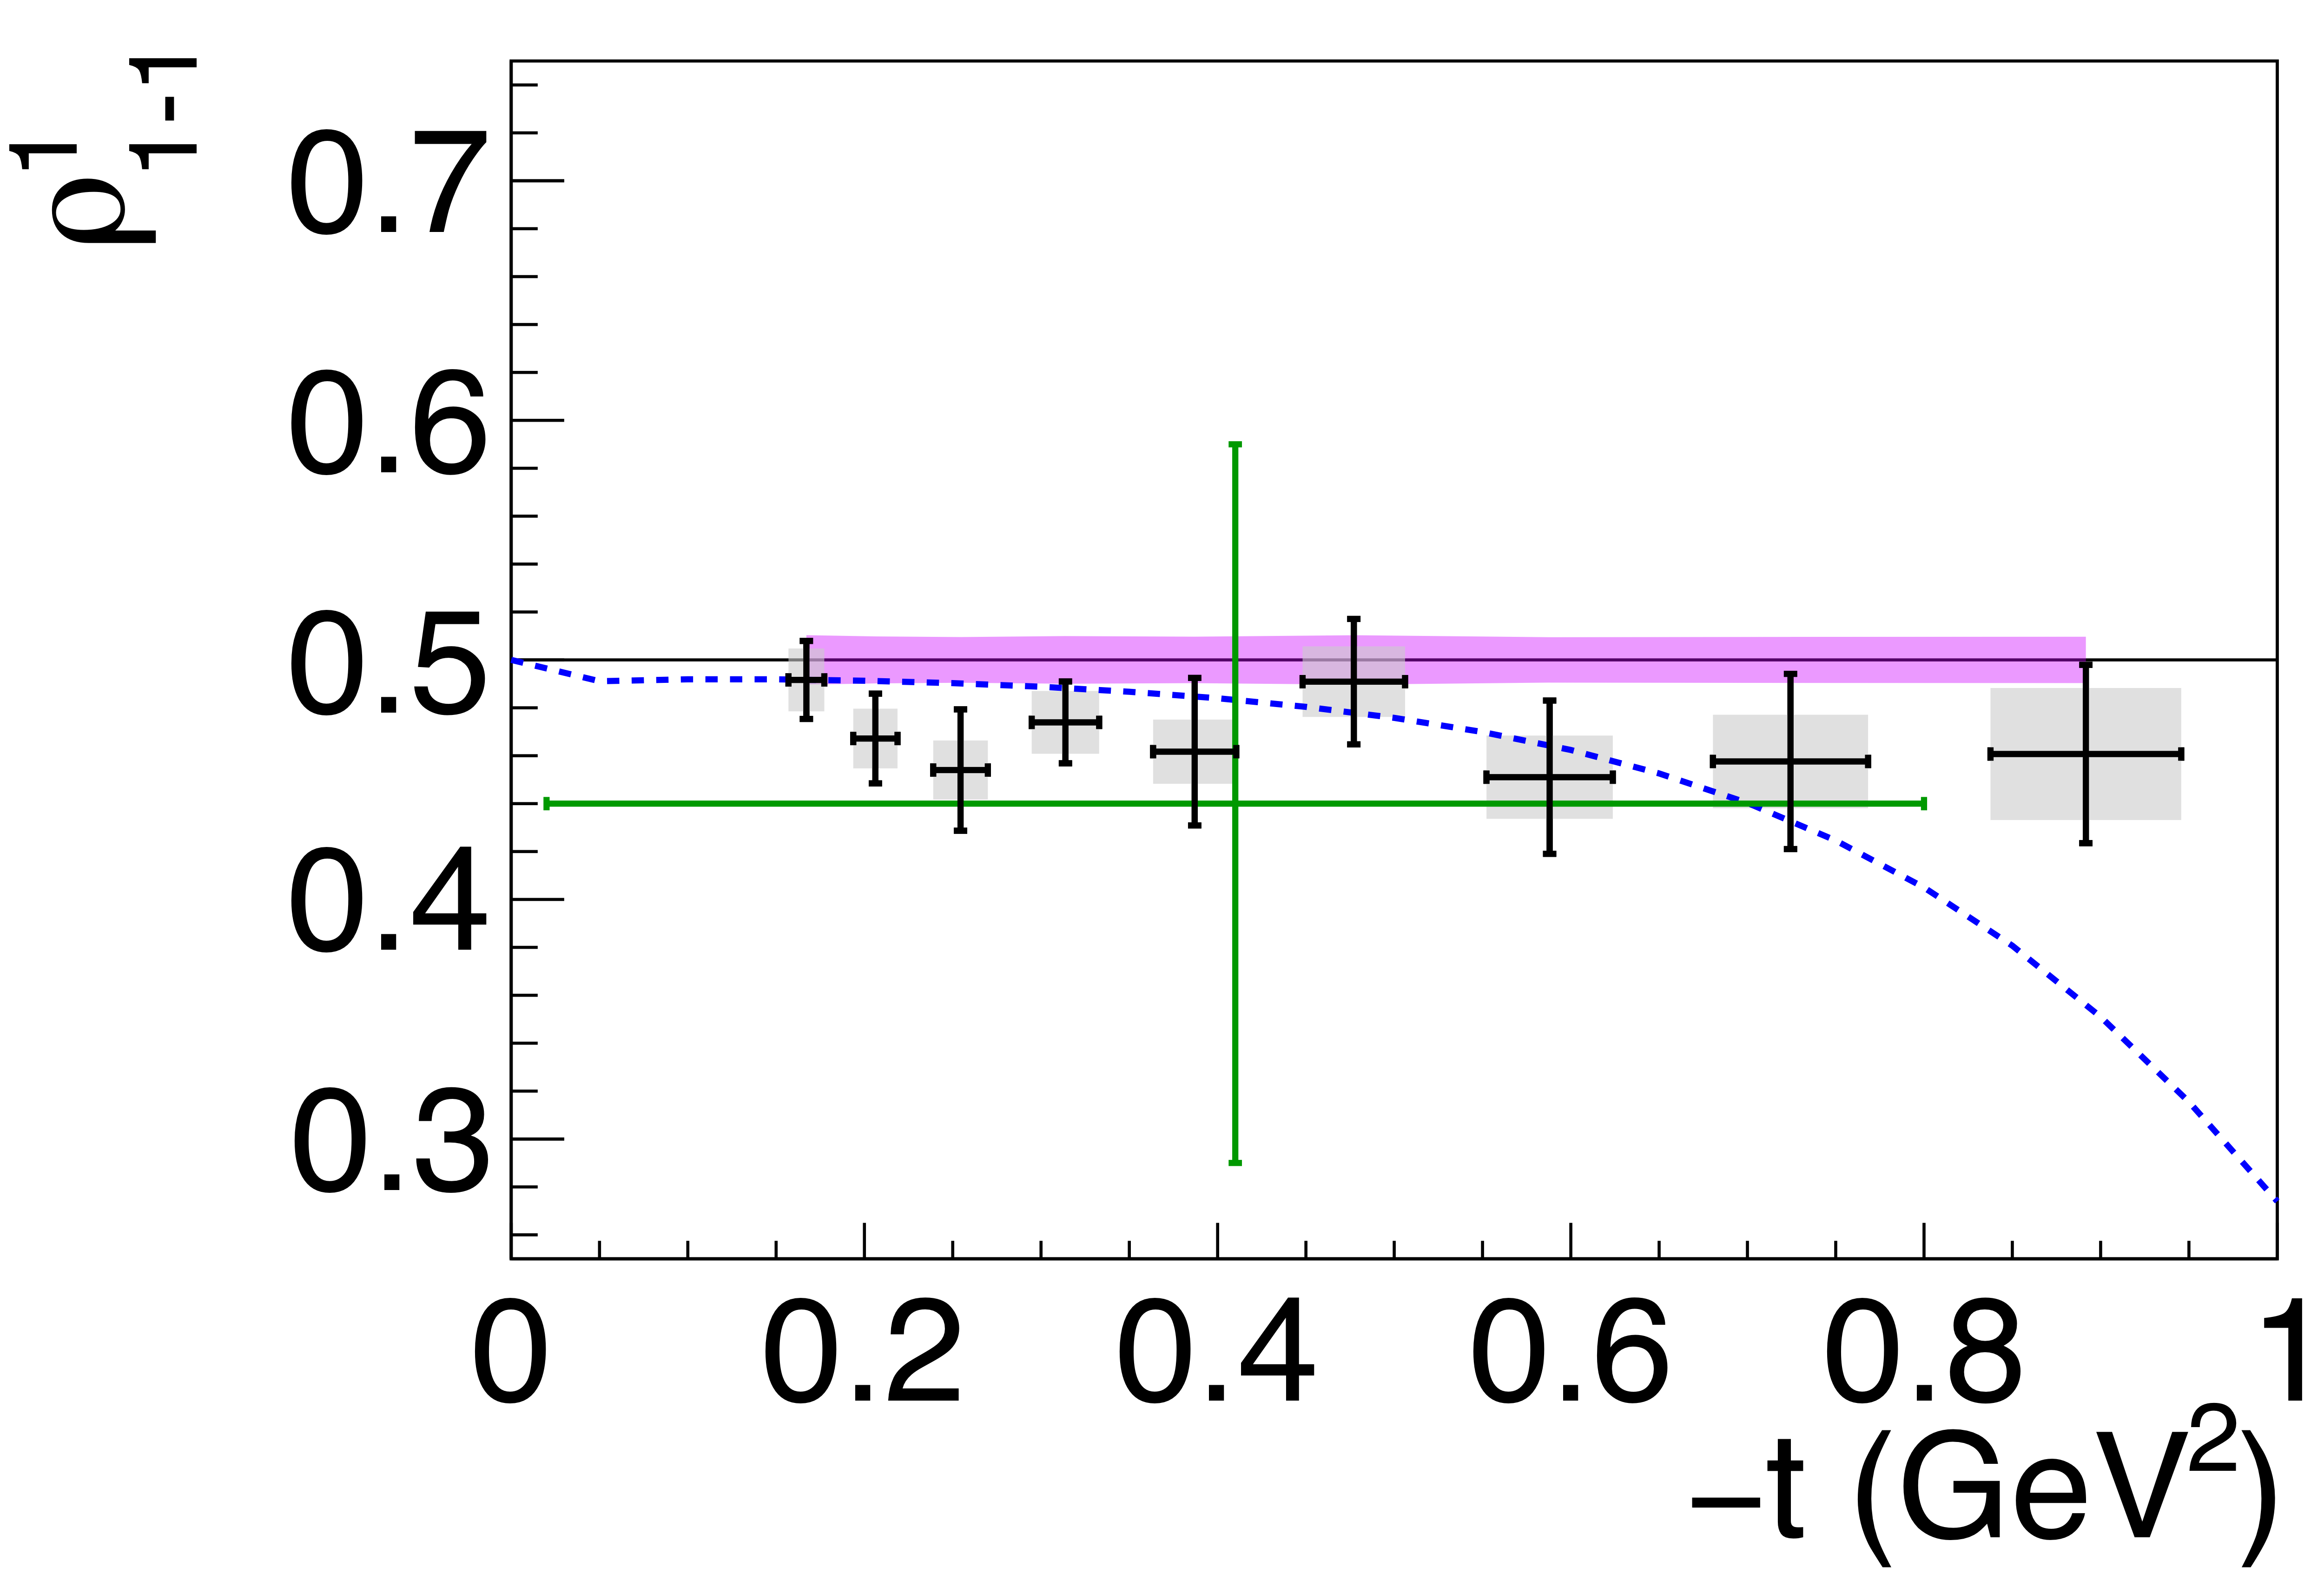
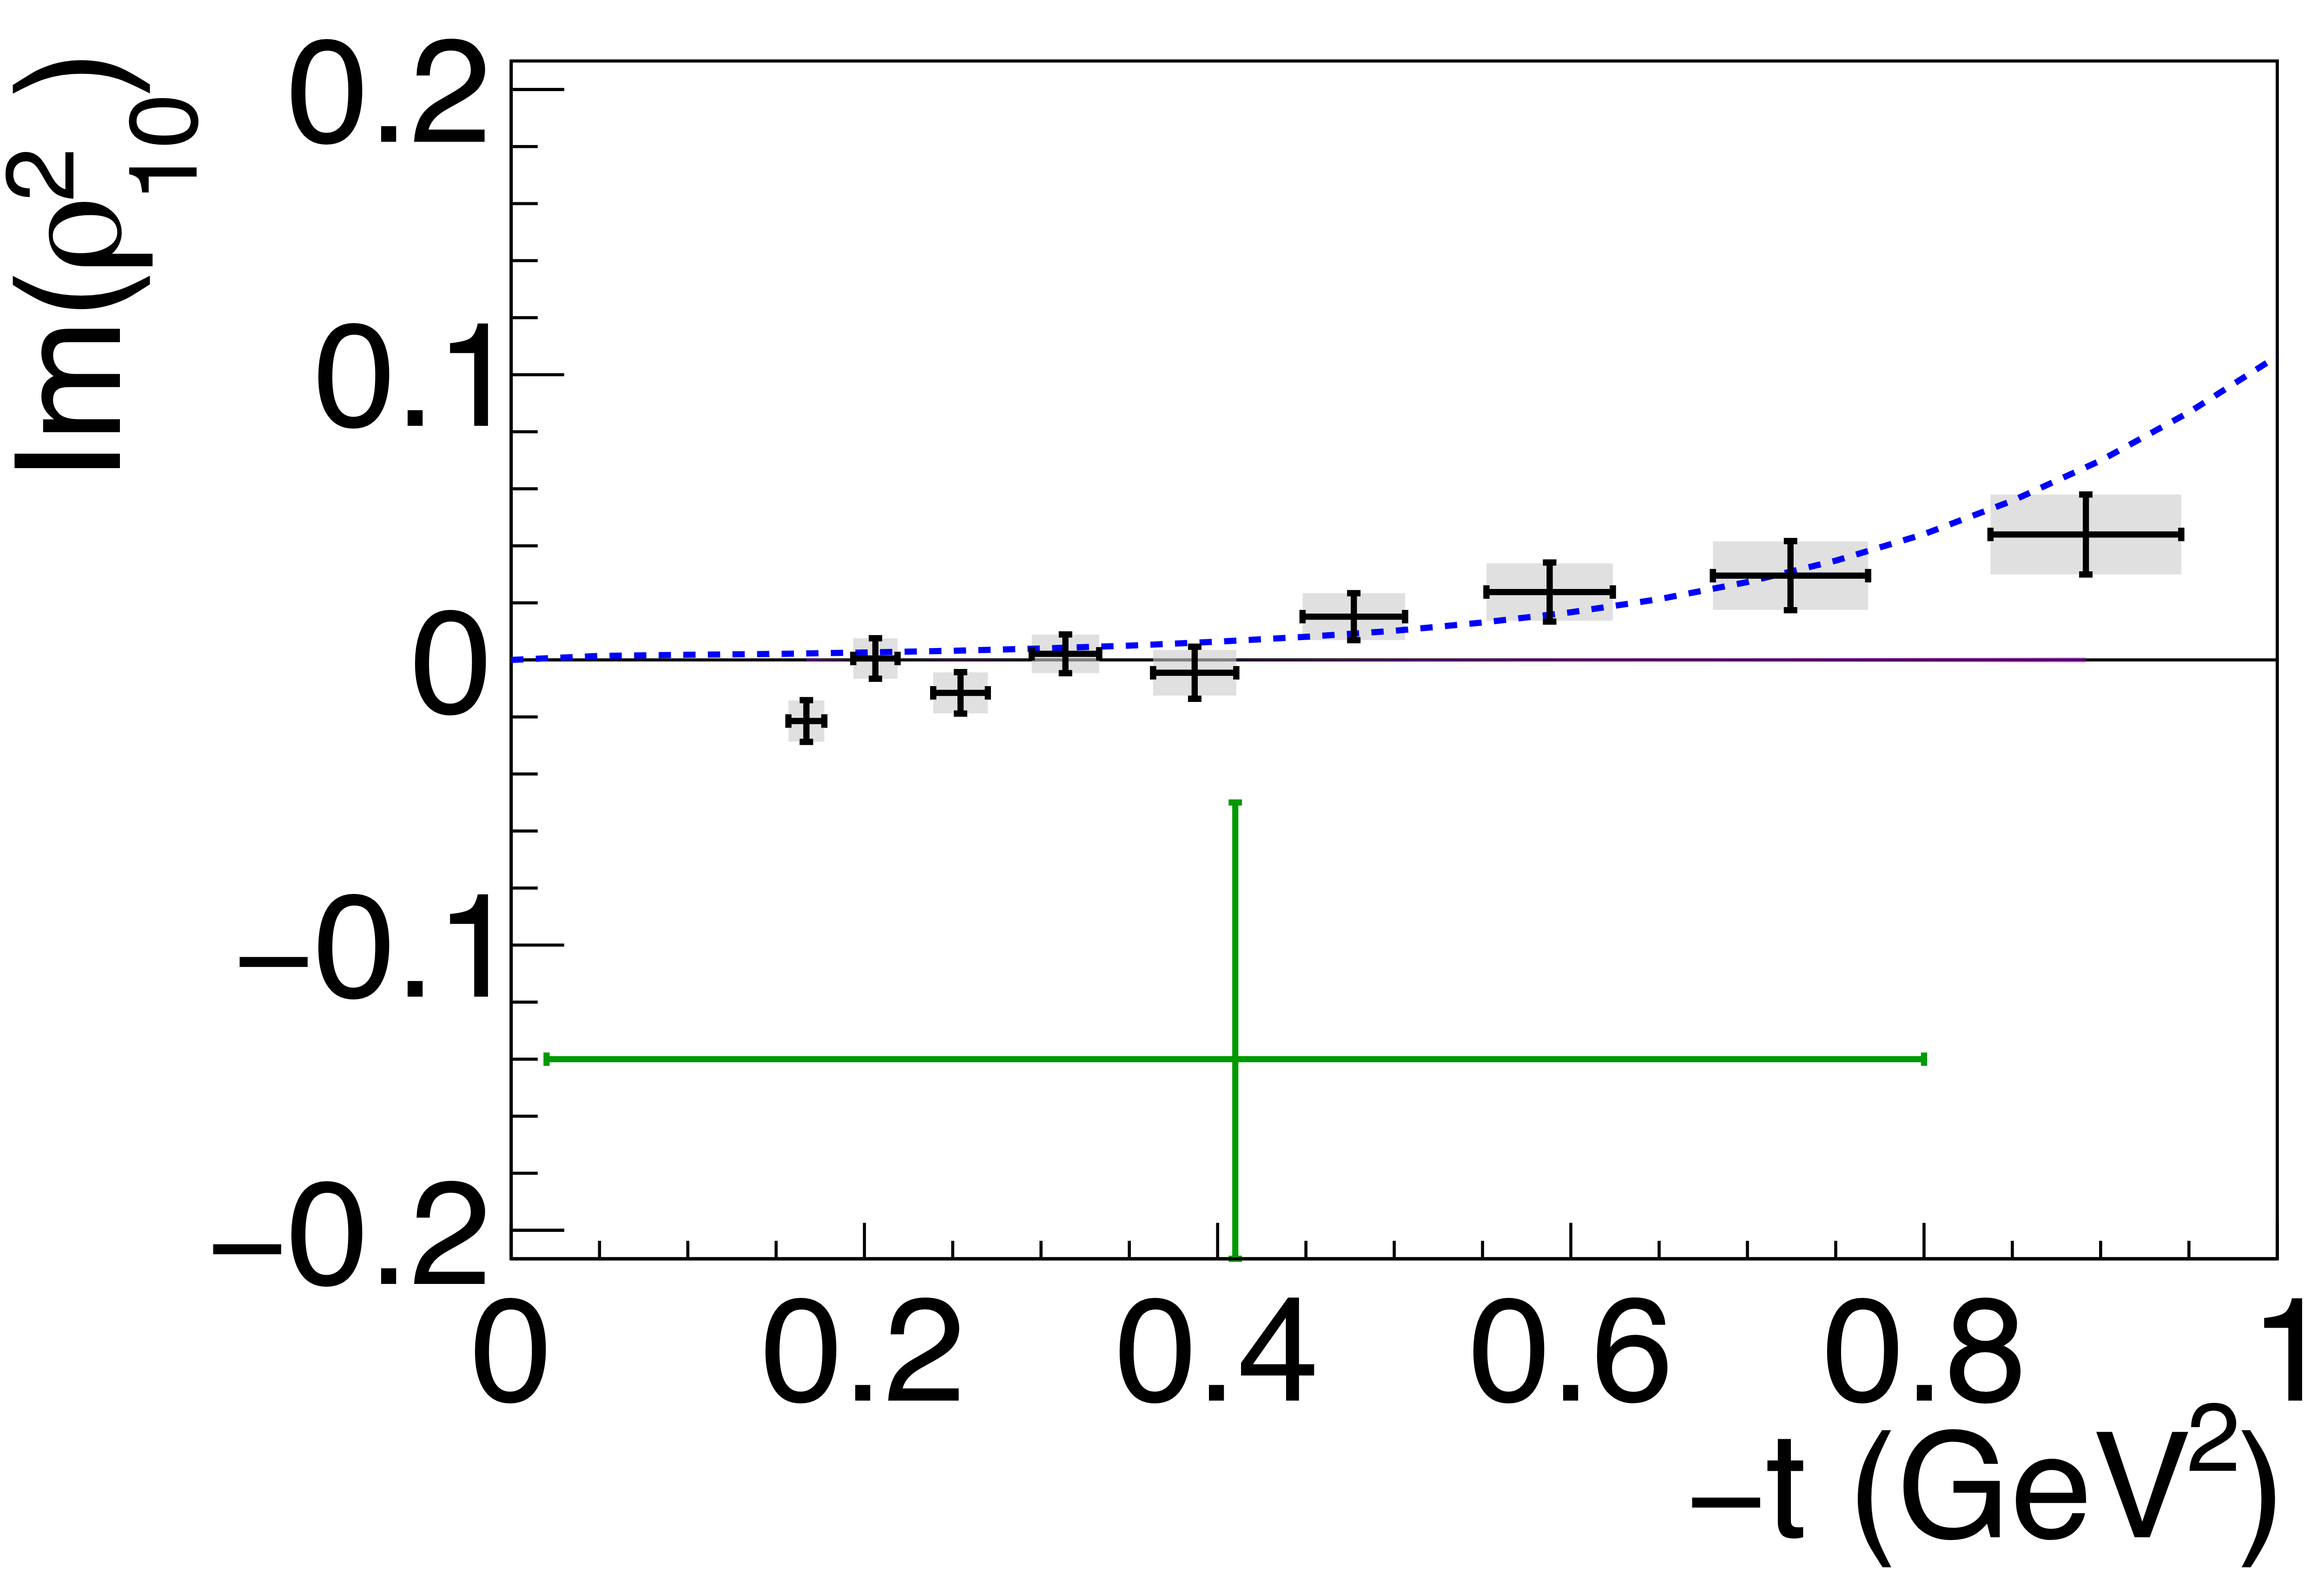
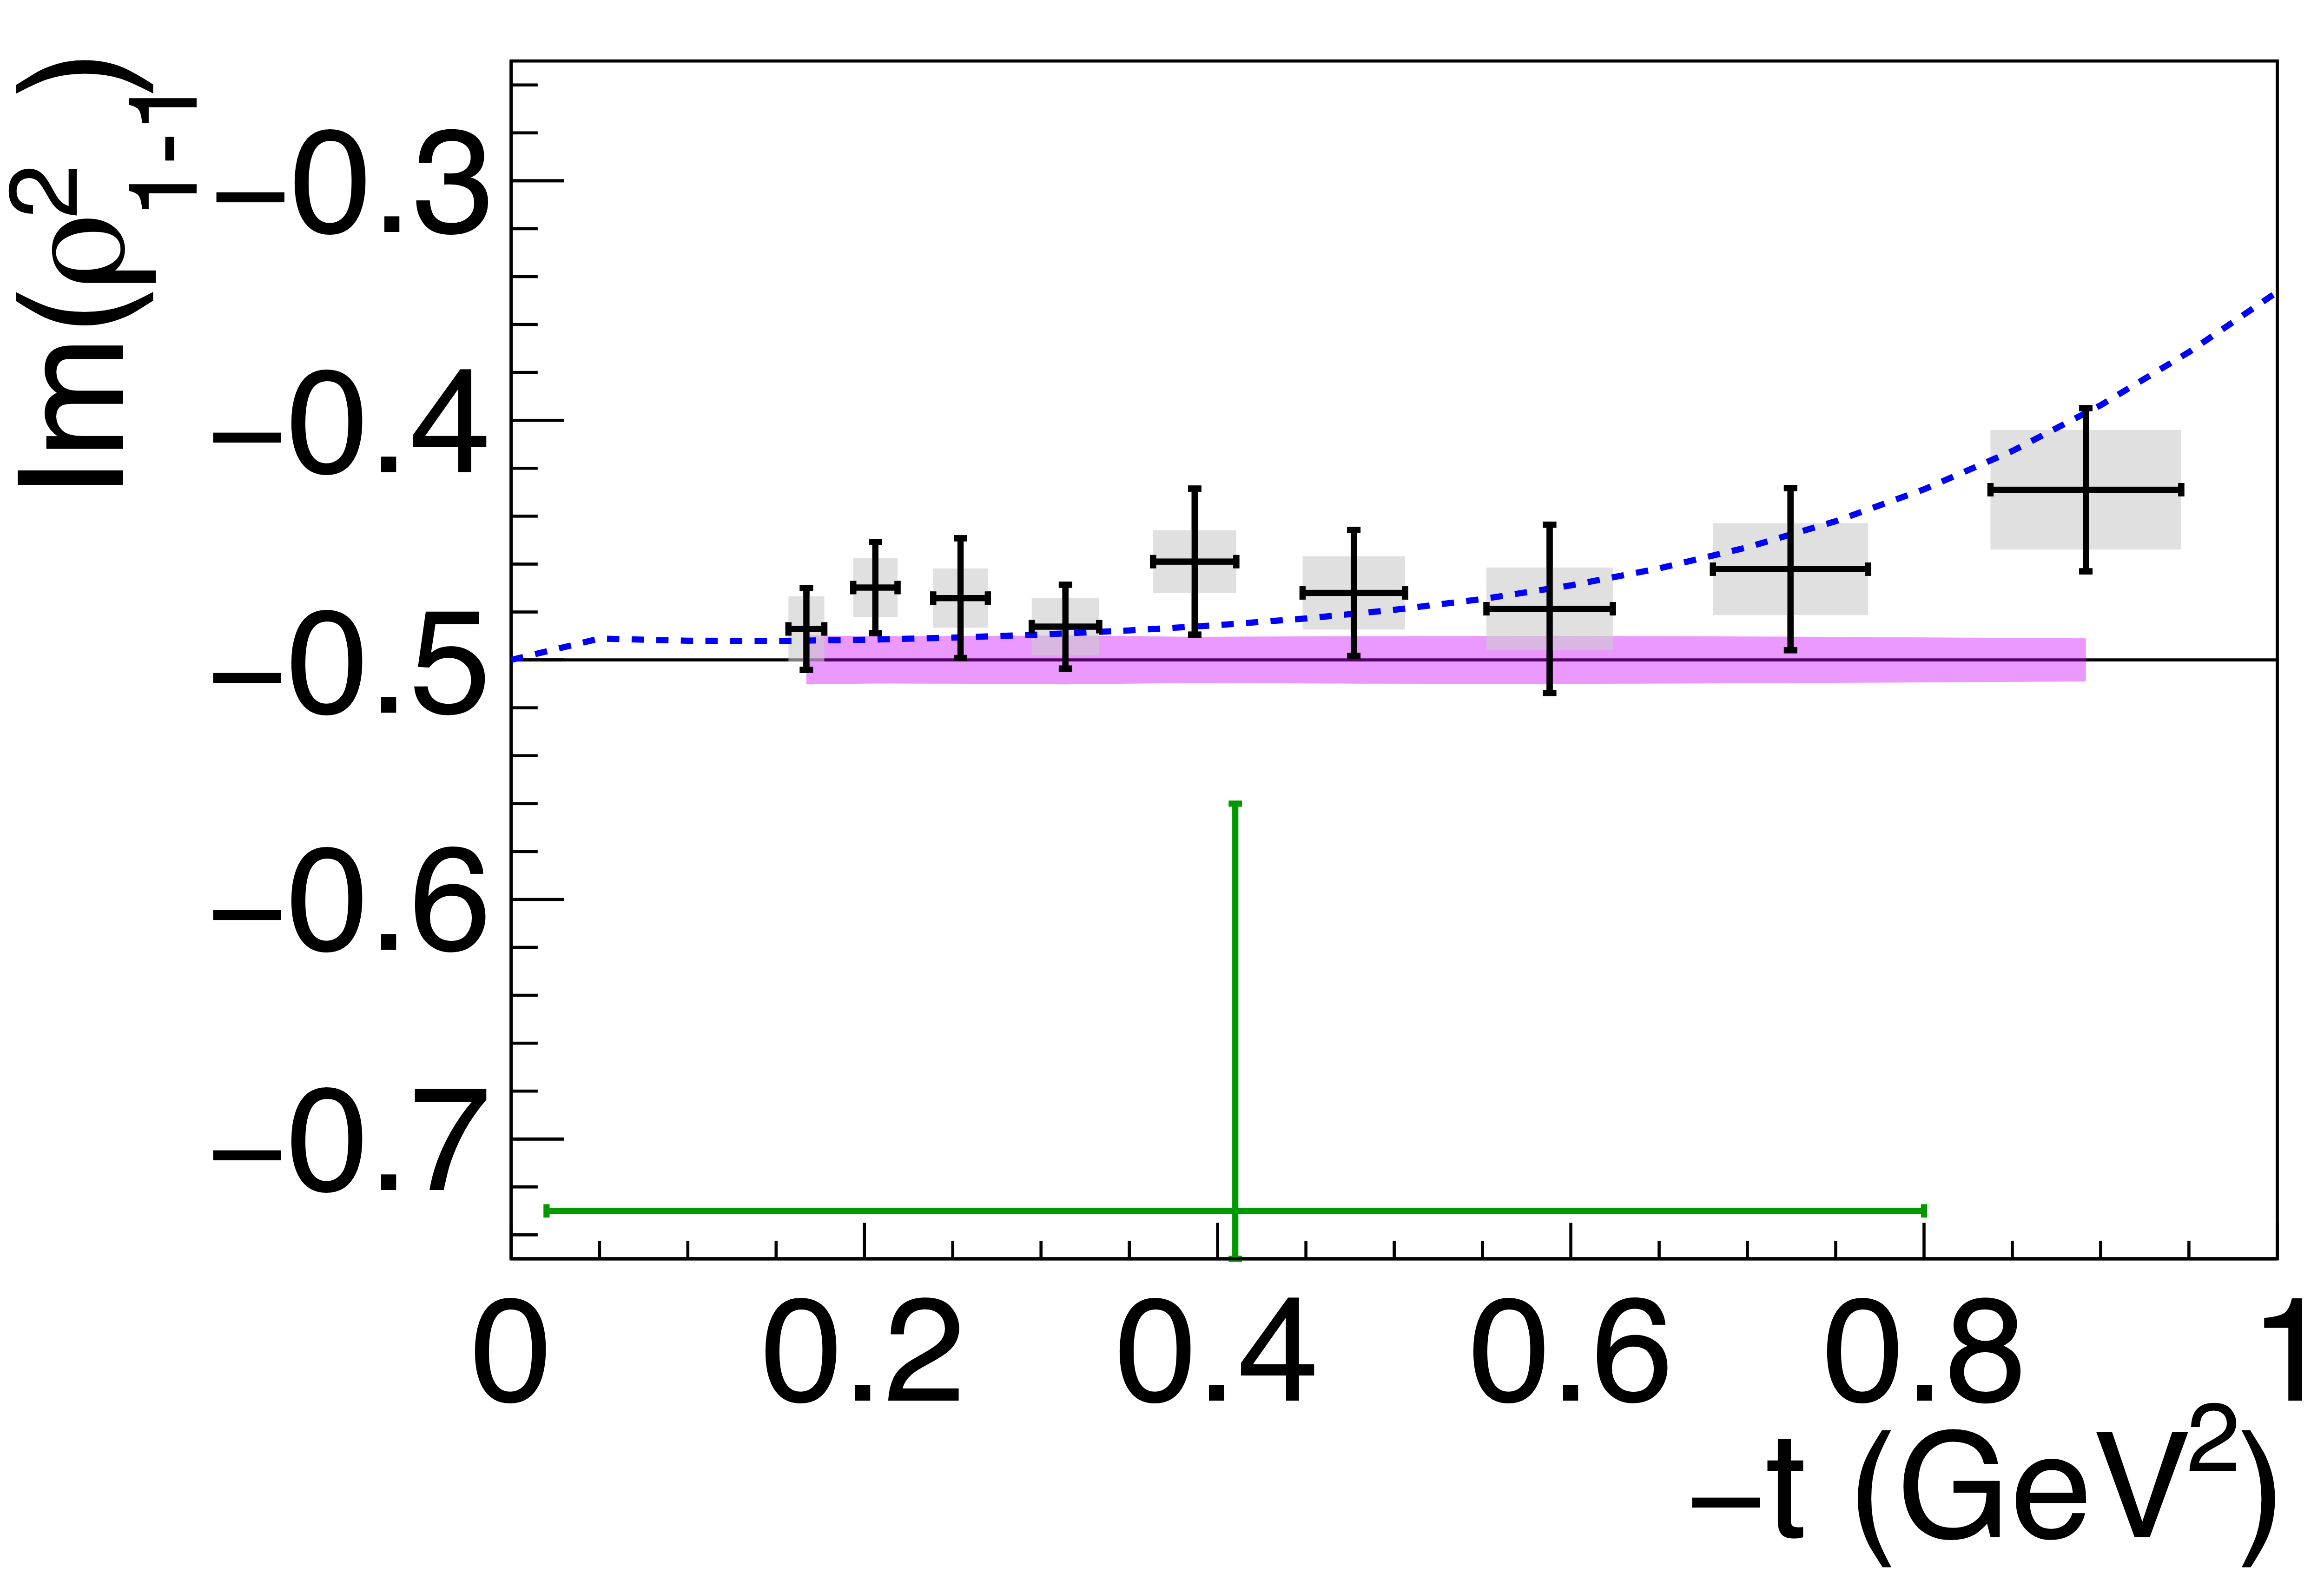
Figure 5a:
Spin-density matrix elements for $\phi(1020)$ mesons produced by a linearly polarized photon beam in the helicity frame. Our measured values are represented by the black points, with shaded gray boxes indicating the statistical uncertainties, and the error bars represent the total uncertainties. The correlated systematic uncertainties described in the text are shown as violet error bands. The measurement by Ballam et al. [13] (SLAC) are given by the green data points. The horizontal black lines show the expectation for $s$-channel helicity conservation with natural-parity exchange (SCHC + NPE), and the blue dashed lines show the Regge theory-based predictions of Ref. [6]. |
Phys. Rev. C112 (2025) 2, 025203: downloads png pdf |
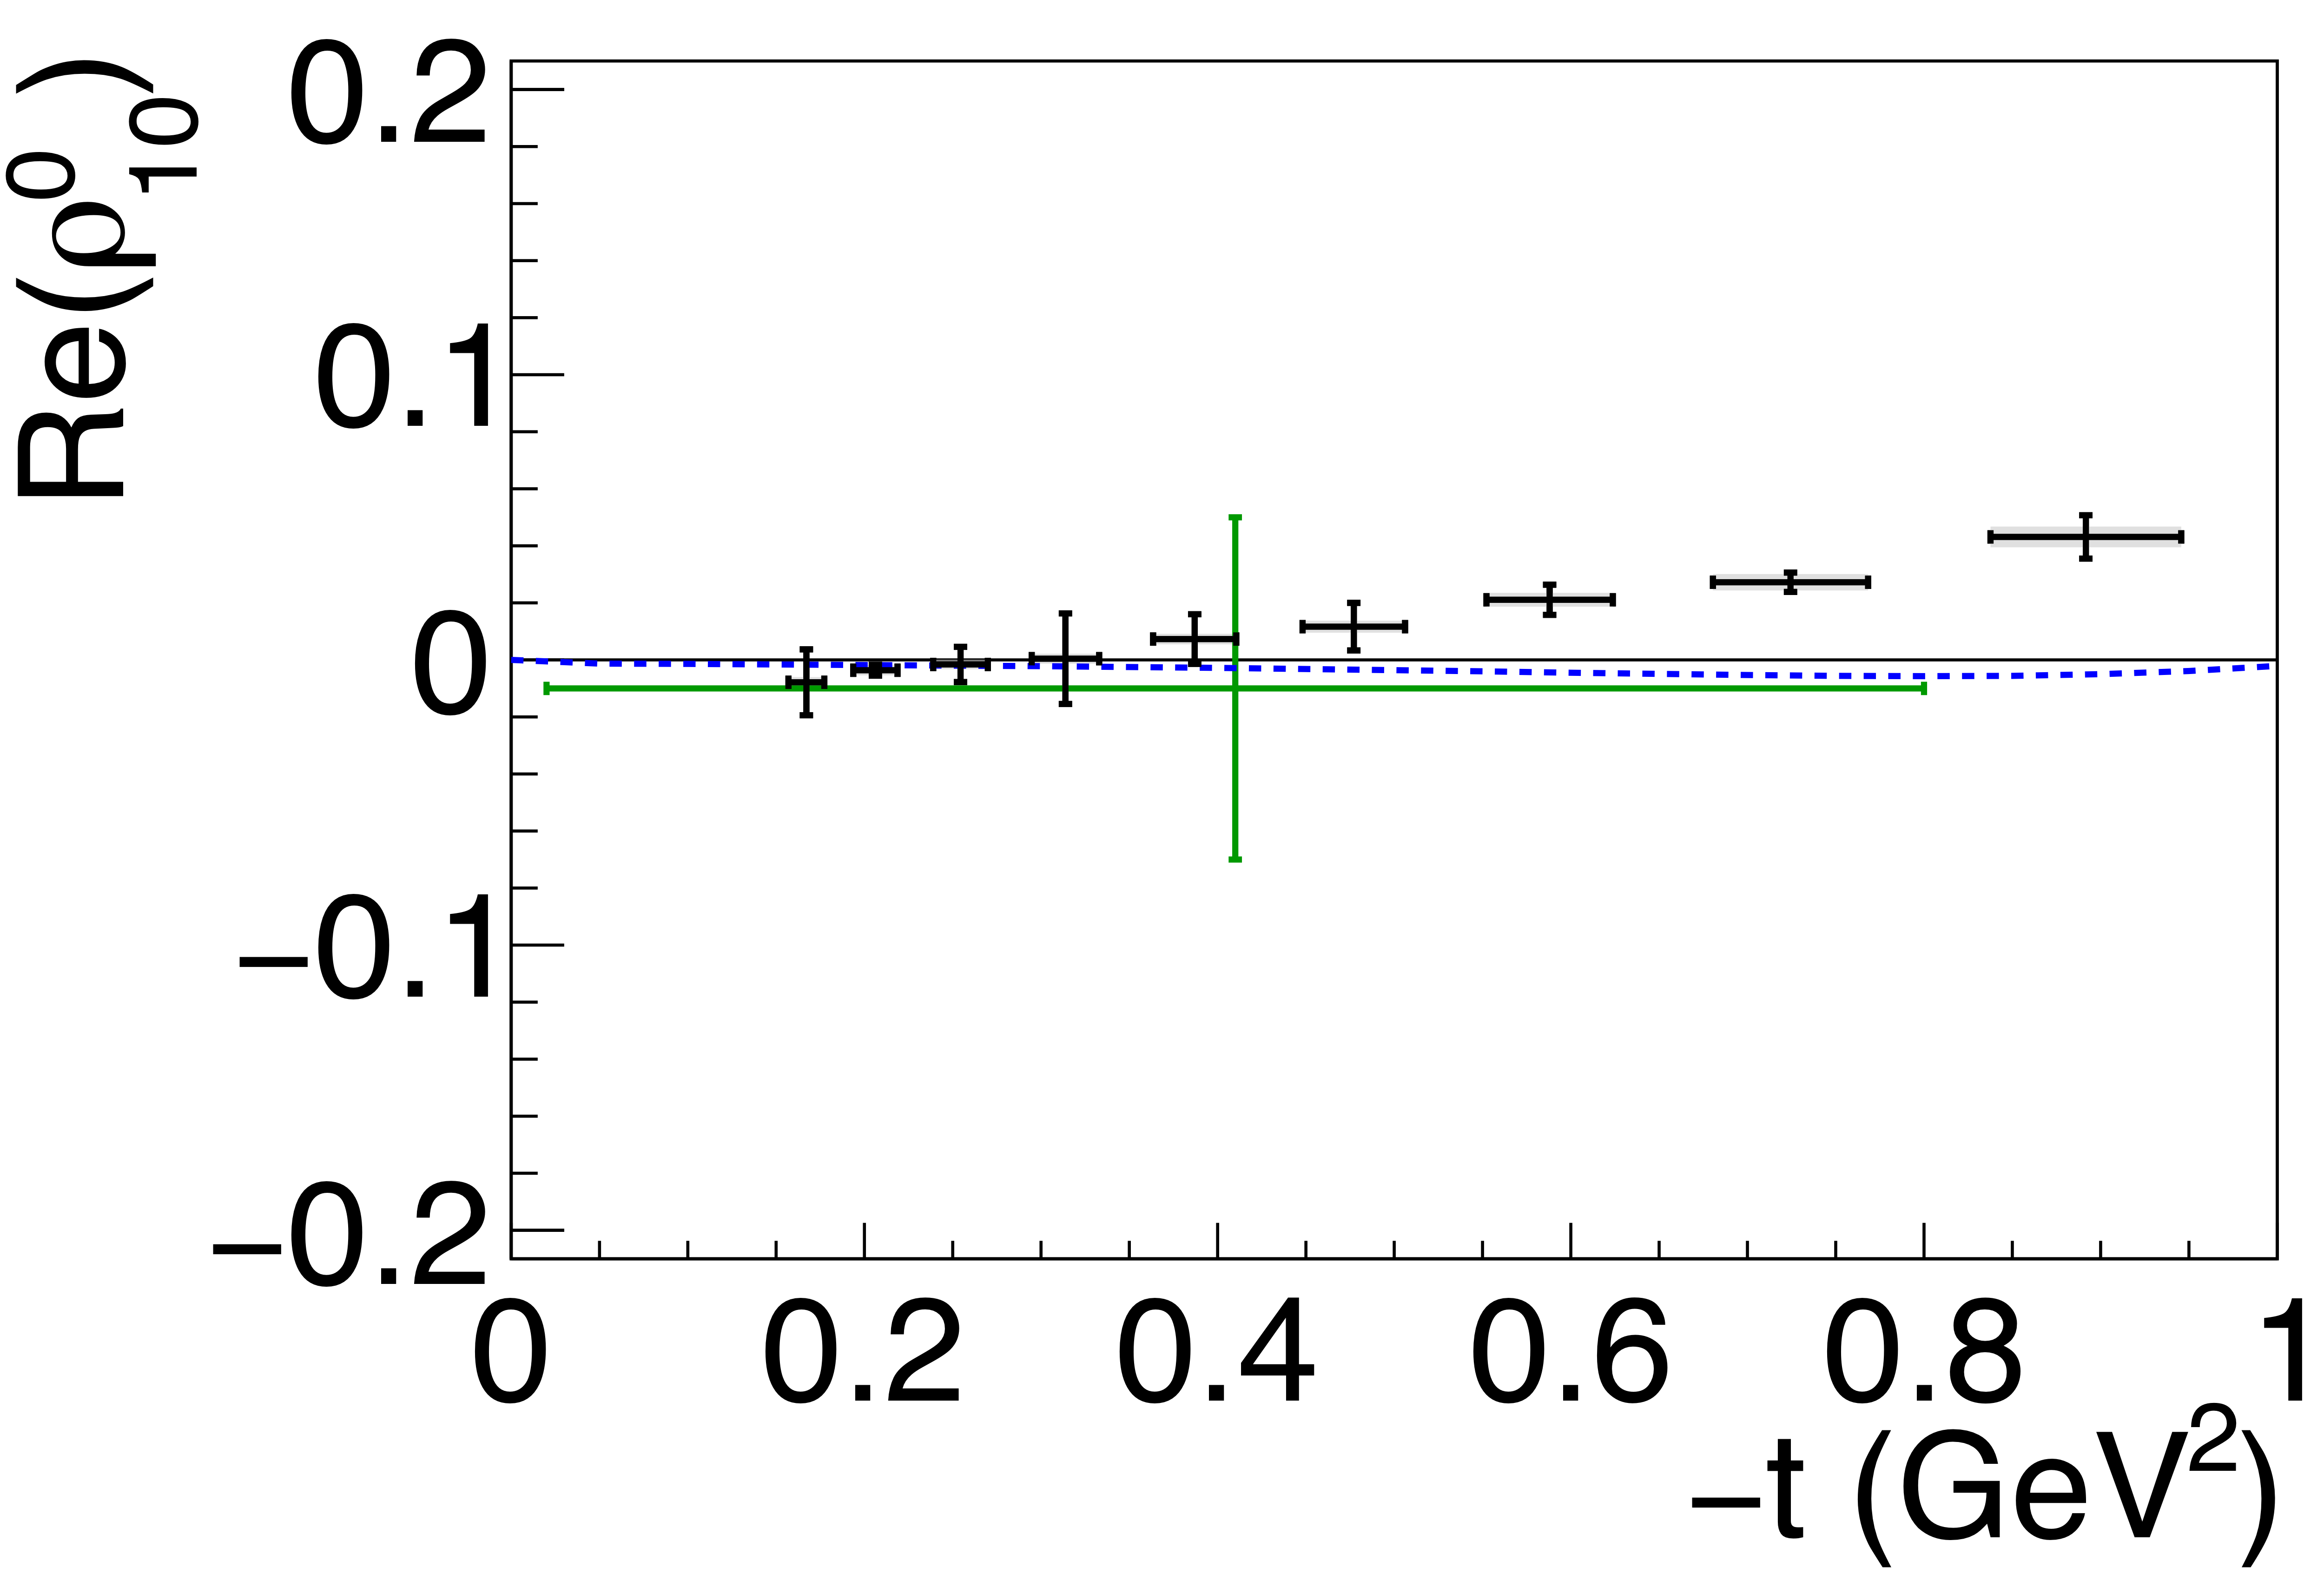
Figure 5b:
Spin-density matrix elements for $\phi(1020)$ mesons produced by a linearly polarized photon beam in the helicity frame. Our measured values are represented by the black points, with shaded gray boxes indicating the statistical uncertainties, and the error bars represent the total uncertainties. The correlated systematic uncertainties described in the text are shown as violet error bands. The measurement by Ballam et al. [13] (SLAC) are given by the green data points. The horizontal black lines show the expectation for $s$-channel helicity conservation with natural-parity exchange (SCHC + NPE), and the blue dashed lines show the Regge theory-based predictions of Ref. [6]. |
Phys. Rev. C112 (2025) 2, 025203: downloads png pdf |
Figure 5c:
Spin-density matrix elements for $\phi(1020)$ mesons produced by a linearly polarized photon beam in the helicity frame. Our measured values are represented by the black points, with shaded gray boxes indicating the statistical uncertainties, and the error bars represent the total uncertainties. The correlated systematic uncertainties described in the text are shown as violet error bands. The measurement by Ballam et al. [13] (SLAC) are given by the green data points. The horizontal black lines show the expectation for $s$-channel helicity conservation with natural-parity exchange (SCHC + NPE), and the blue dashed lines show the Regge theory-based predictions of Ref. [6]. |
Phys. Rev. C112 (2025) 2, 025203: downloads png pdf |
Figure 5d:
Spin-density matrix elements for $\phi(1020)$ mesons produced by a linearly polarized photon beam in the helicity frame. Our measured values are represented by the black points, with shaded gray boxes indicating the statistical uncertainties, and the error bars represent the total uncertainties. The correlated systematic uncertainties described in the text are shown as violet error bands. The measurement by Ballam et al. [13] (SLAC) are given by the green data points. The horizontal black lines show the expectation for $s$-channel helicity conservation with natural-parity exchange (SCHC + NPE), and the blue dashed lines show the Regge theory-based predictions of Ref. [6]. |
Phys. Rev. C112 (2025) 2, 025203: downloads png pdf |
Figure 5e:
Spin-density matrix elements for $\phi(1020)$ mesons produced by a linearly polarized photon beam in the helicity frame. Our measured values are represented by the black points, with shaded gray boxes indicating the statistical uncertainties, and the error bars represent the total uncertainties. The correlated systematic uncertainties described in the text are shown as violet error bands. The measurement by Ballam et al. [13] (SLAC) are given by the green data points. The horizontal black lines show the expectation for $s$-channel helicity conservation with natural-parity exchange (SCHC + NPE), and the blue dashed lines show the Regge theory-based predictions of Ref. [6]. |
Phys. Rev. C112 (2025) 2, 025203: downloads png pdf |
Figure 5f:
Spin-density matrix elements for $\phi(1020)$ mesons produced by a linearly polarized photon beam in the helicity frame. Our measured values are represented by the black points, with shaded gray boxes indicating the statistical uncertainties, and the error bars represent the total uncertainties. The correlated systematic uncertainties described in the text are shown as violet error bands. The measurement by Ballam et al. [13] (SLAC) are given by the green data points. The horizontal black lines show the expectation for $s$-channel helicity conservation with natural-parity exchange (SCHC + NPE), and the blue dashed lines show the Regge theory-based predictions of Ref. [6]. |
Phys. Rev. C112 (2025) 2, 025203: downloads png pdf |
Figure 5g:
Spin-density matrix elements for $\phi(1020)$ mesons produced by a linearly polarized photon beam in the helicity frame. Our measured values are represented by the black points, with shaded gray boxes indicating the statistical uncertainties, and the error bars represent the total uncertainties. The correlated systematic uncertainties described in the text are shown as violet error bands. The measurement by Ballam et al. [13] (SLAC) are given by the green data points. The horizontal black lines show the expectation for $s$-channel helicity conservation with natural-parity exchange (SCHC + NPE), and the blue dashed lines show the Regge theory-based predictions of Ref. [6]. |
Phys. Rev. C112 (2025) 2, 025203: downloads png pdf |
Figure 5h:
Spin-density matrix elements for $\phi(1020)$ mesons produced by a linearly polarized photon beam in the helicity frame. Our measured values are represented by the black points, with shaded gray boxes indicating the statistical uncertainties, and the error bars represent the total uncertainties. The correlated systematic uncertainties described in the text are shown as violet error bands. The measurement by Ballam et al. [13] (SLAC) are given by the green data points. The horizontal black lines show the expectation for $s$-channel helicity conservation with natural-parity exchange (SCHC + NPE), and the blue dashed lines show the Regge theory-based predictions of Ref. [6]. |
Phys. Rev. C112 (2025) 2, 025203: downloads png pdf |
Figure 5i:
Spin-density matrix elements for $\phi(1020)$ mesons produced by a linearly polarized photon beam in the helicity frame. Our measured values are represented by the black points, with shaded gray boxes indicating the statistical uncertainties, and the error bars represent the total uncertainties. The correlated systematic uncertainties described in the text are shown as violet error bands. The measurement by Ballam et al. [13] (SLAC) are given by the green data points. The horizontal black lines show the expectation for $s$-channel helicity conservation with natural-parity exchange (SCHC + NPE), and the blue dashed lines show the Regge theory-based predictions of Ref. [6]. |
Phys. Rev. C112 (2025) 2, 025203: downloads png pdf |
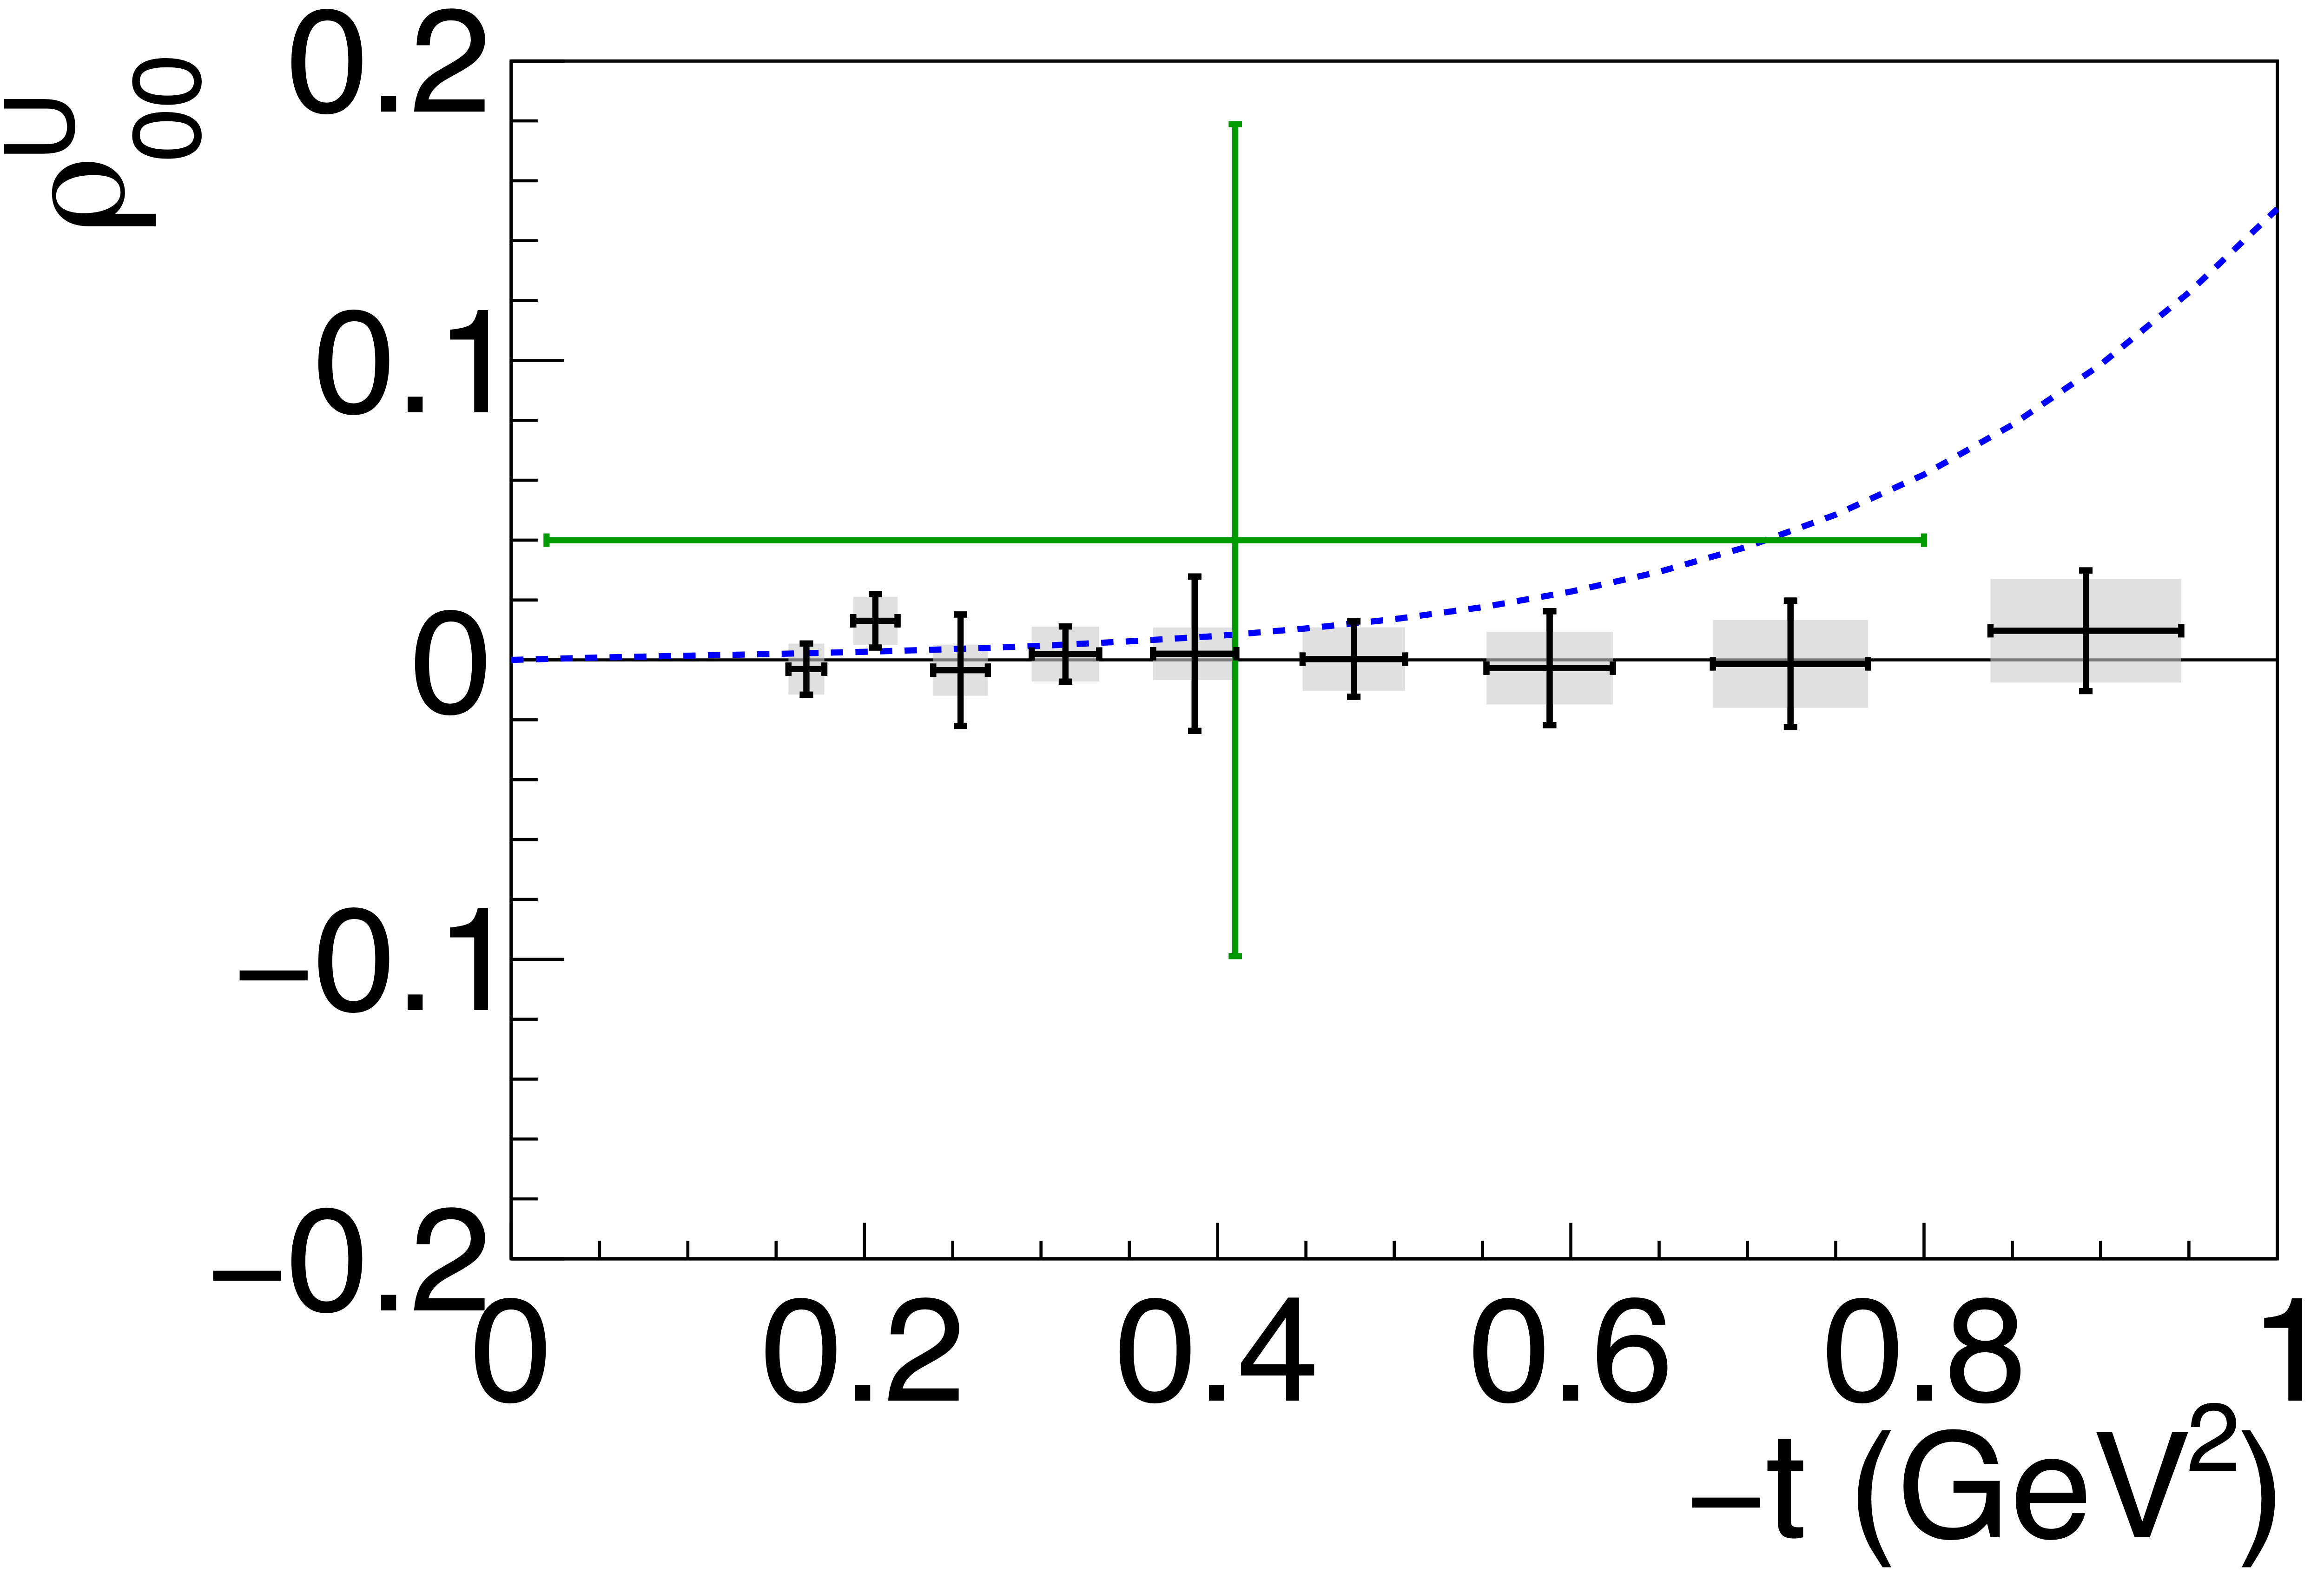
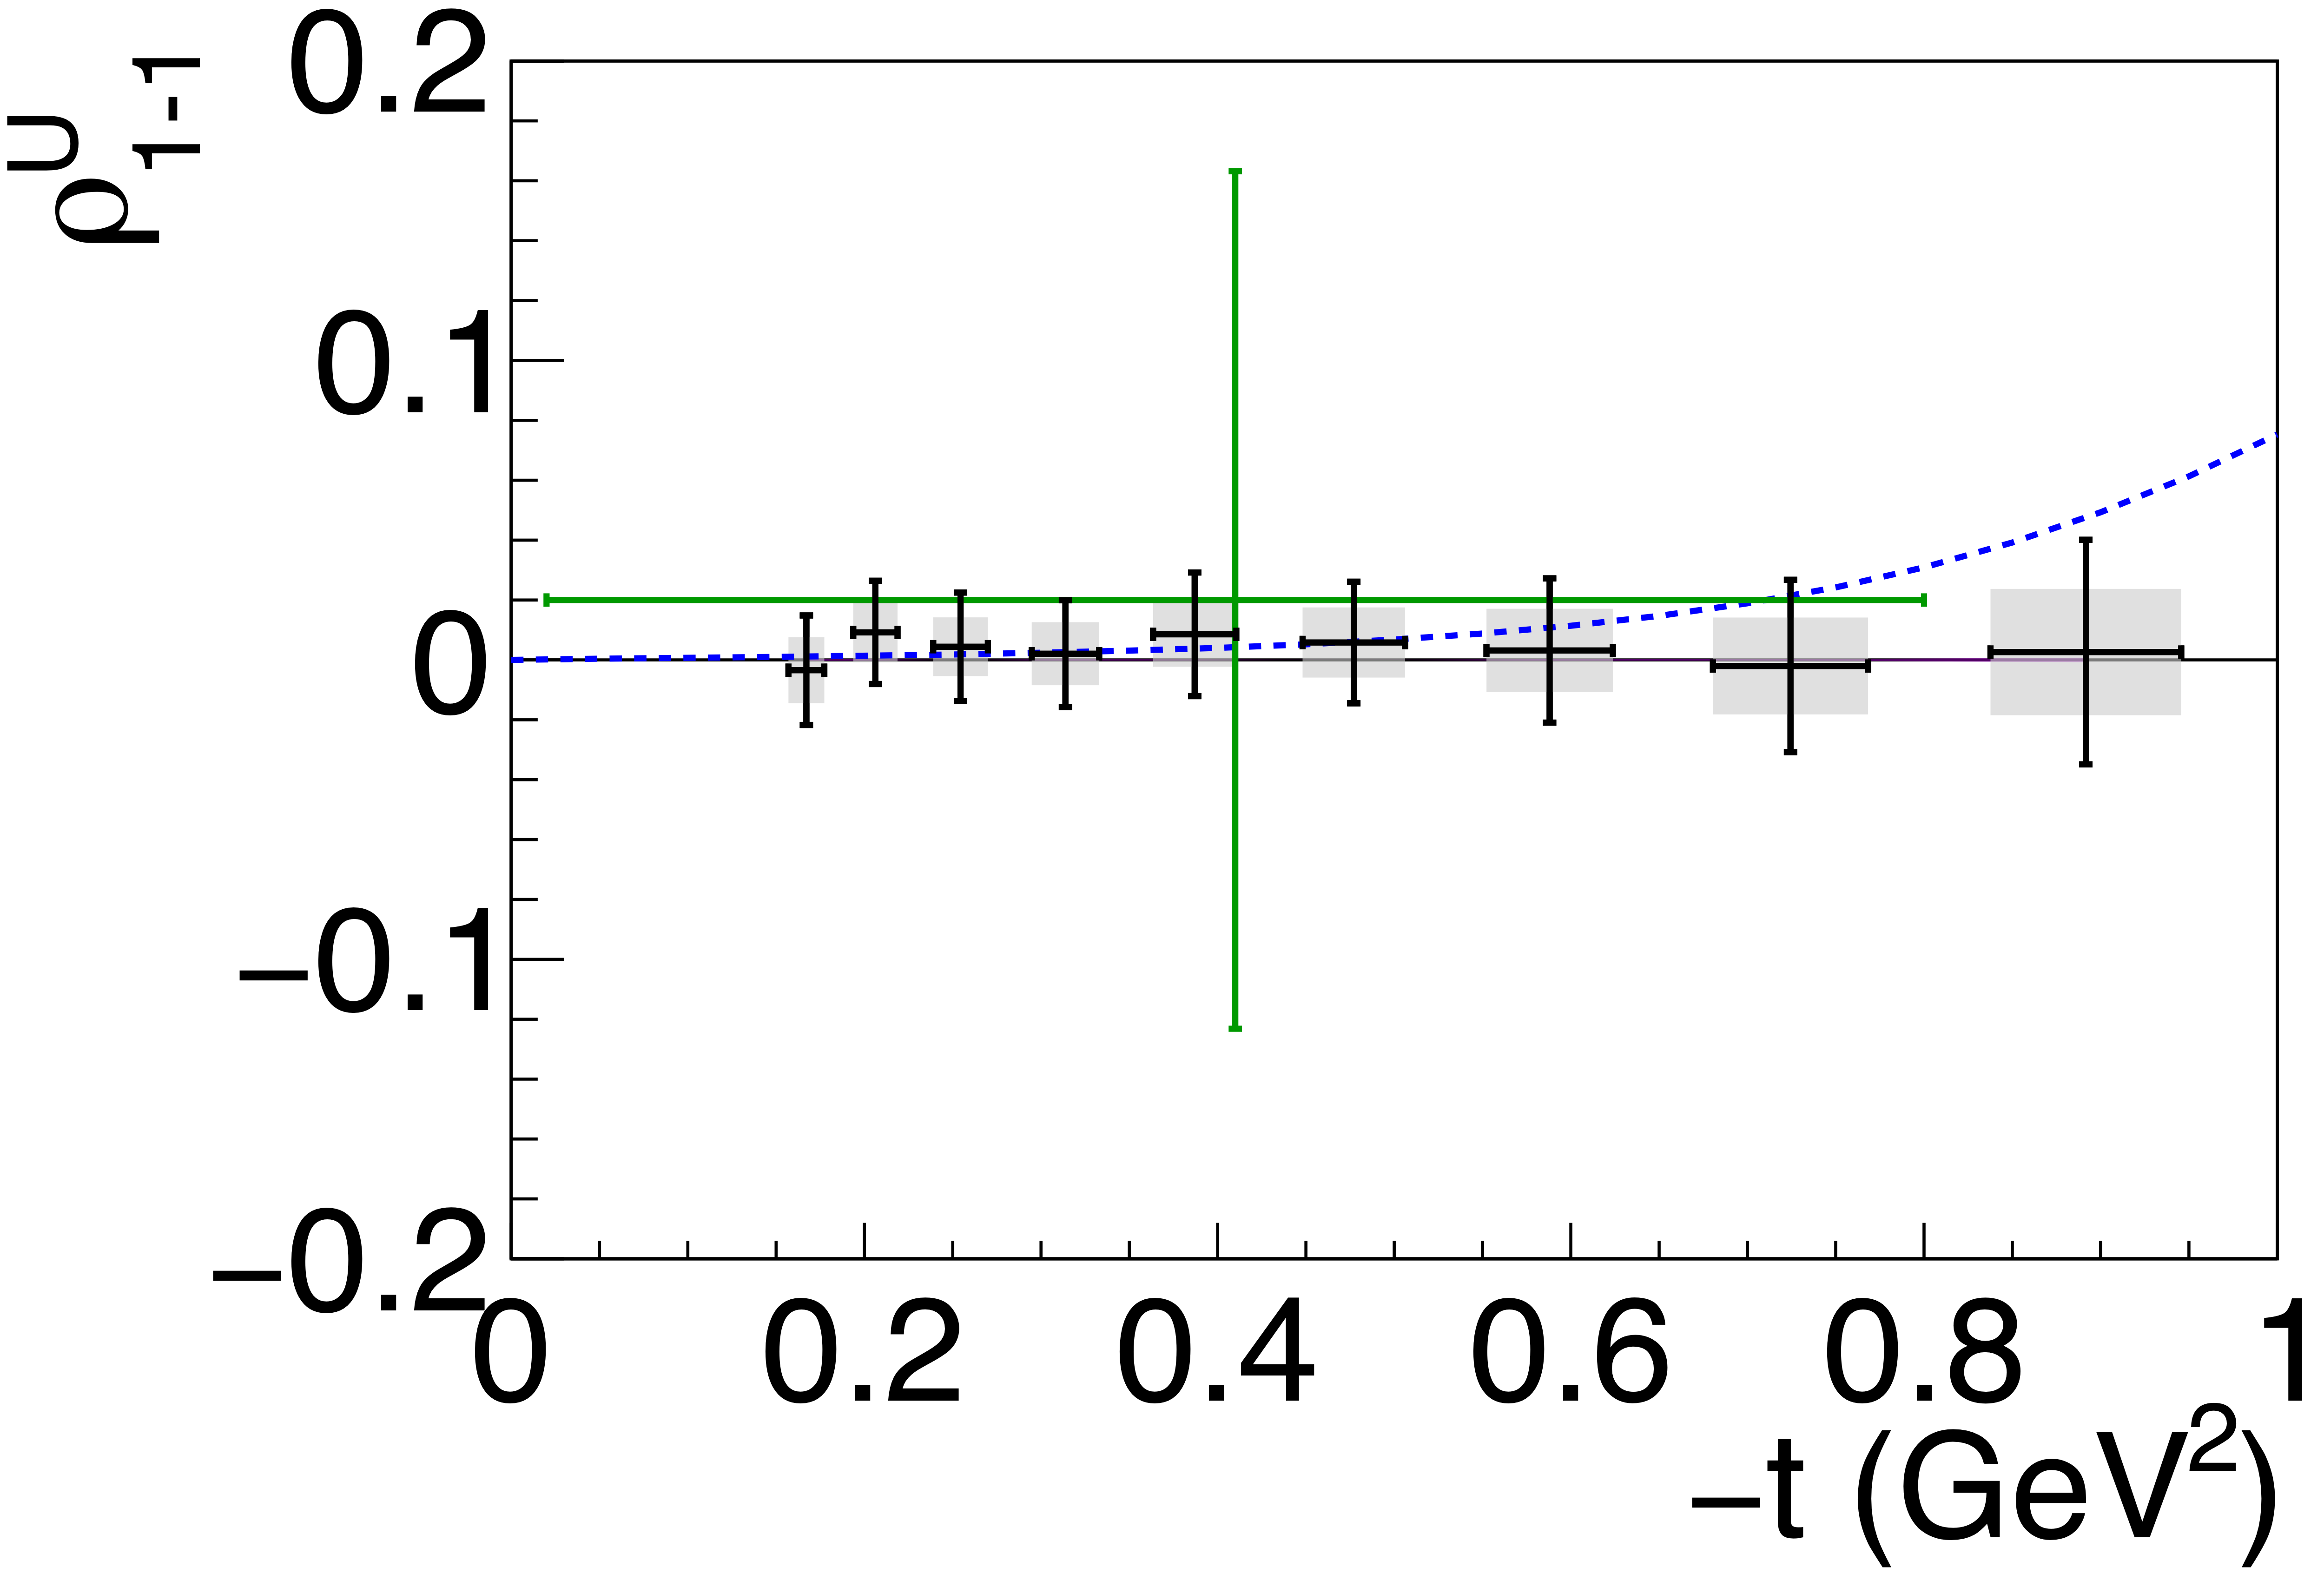
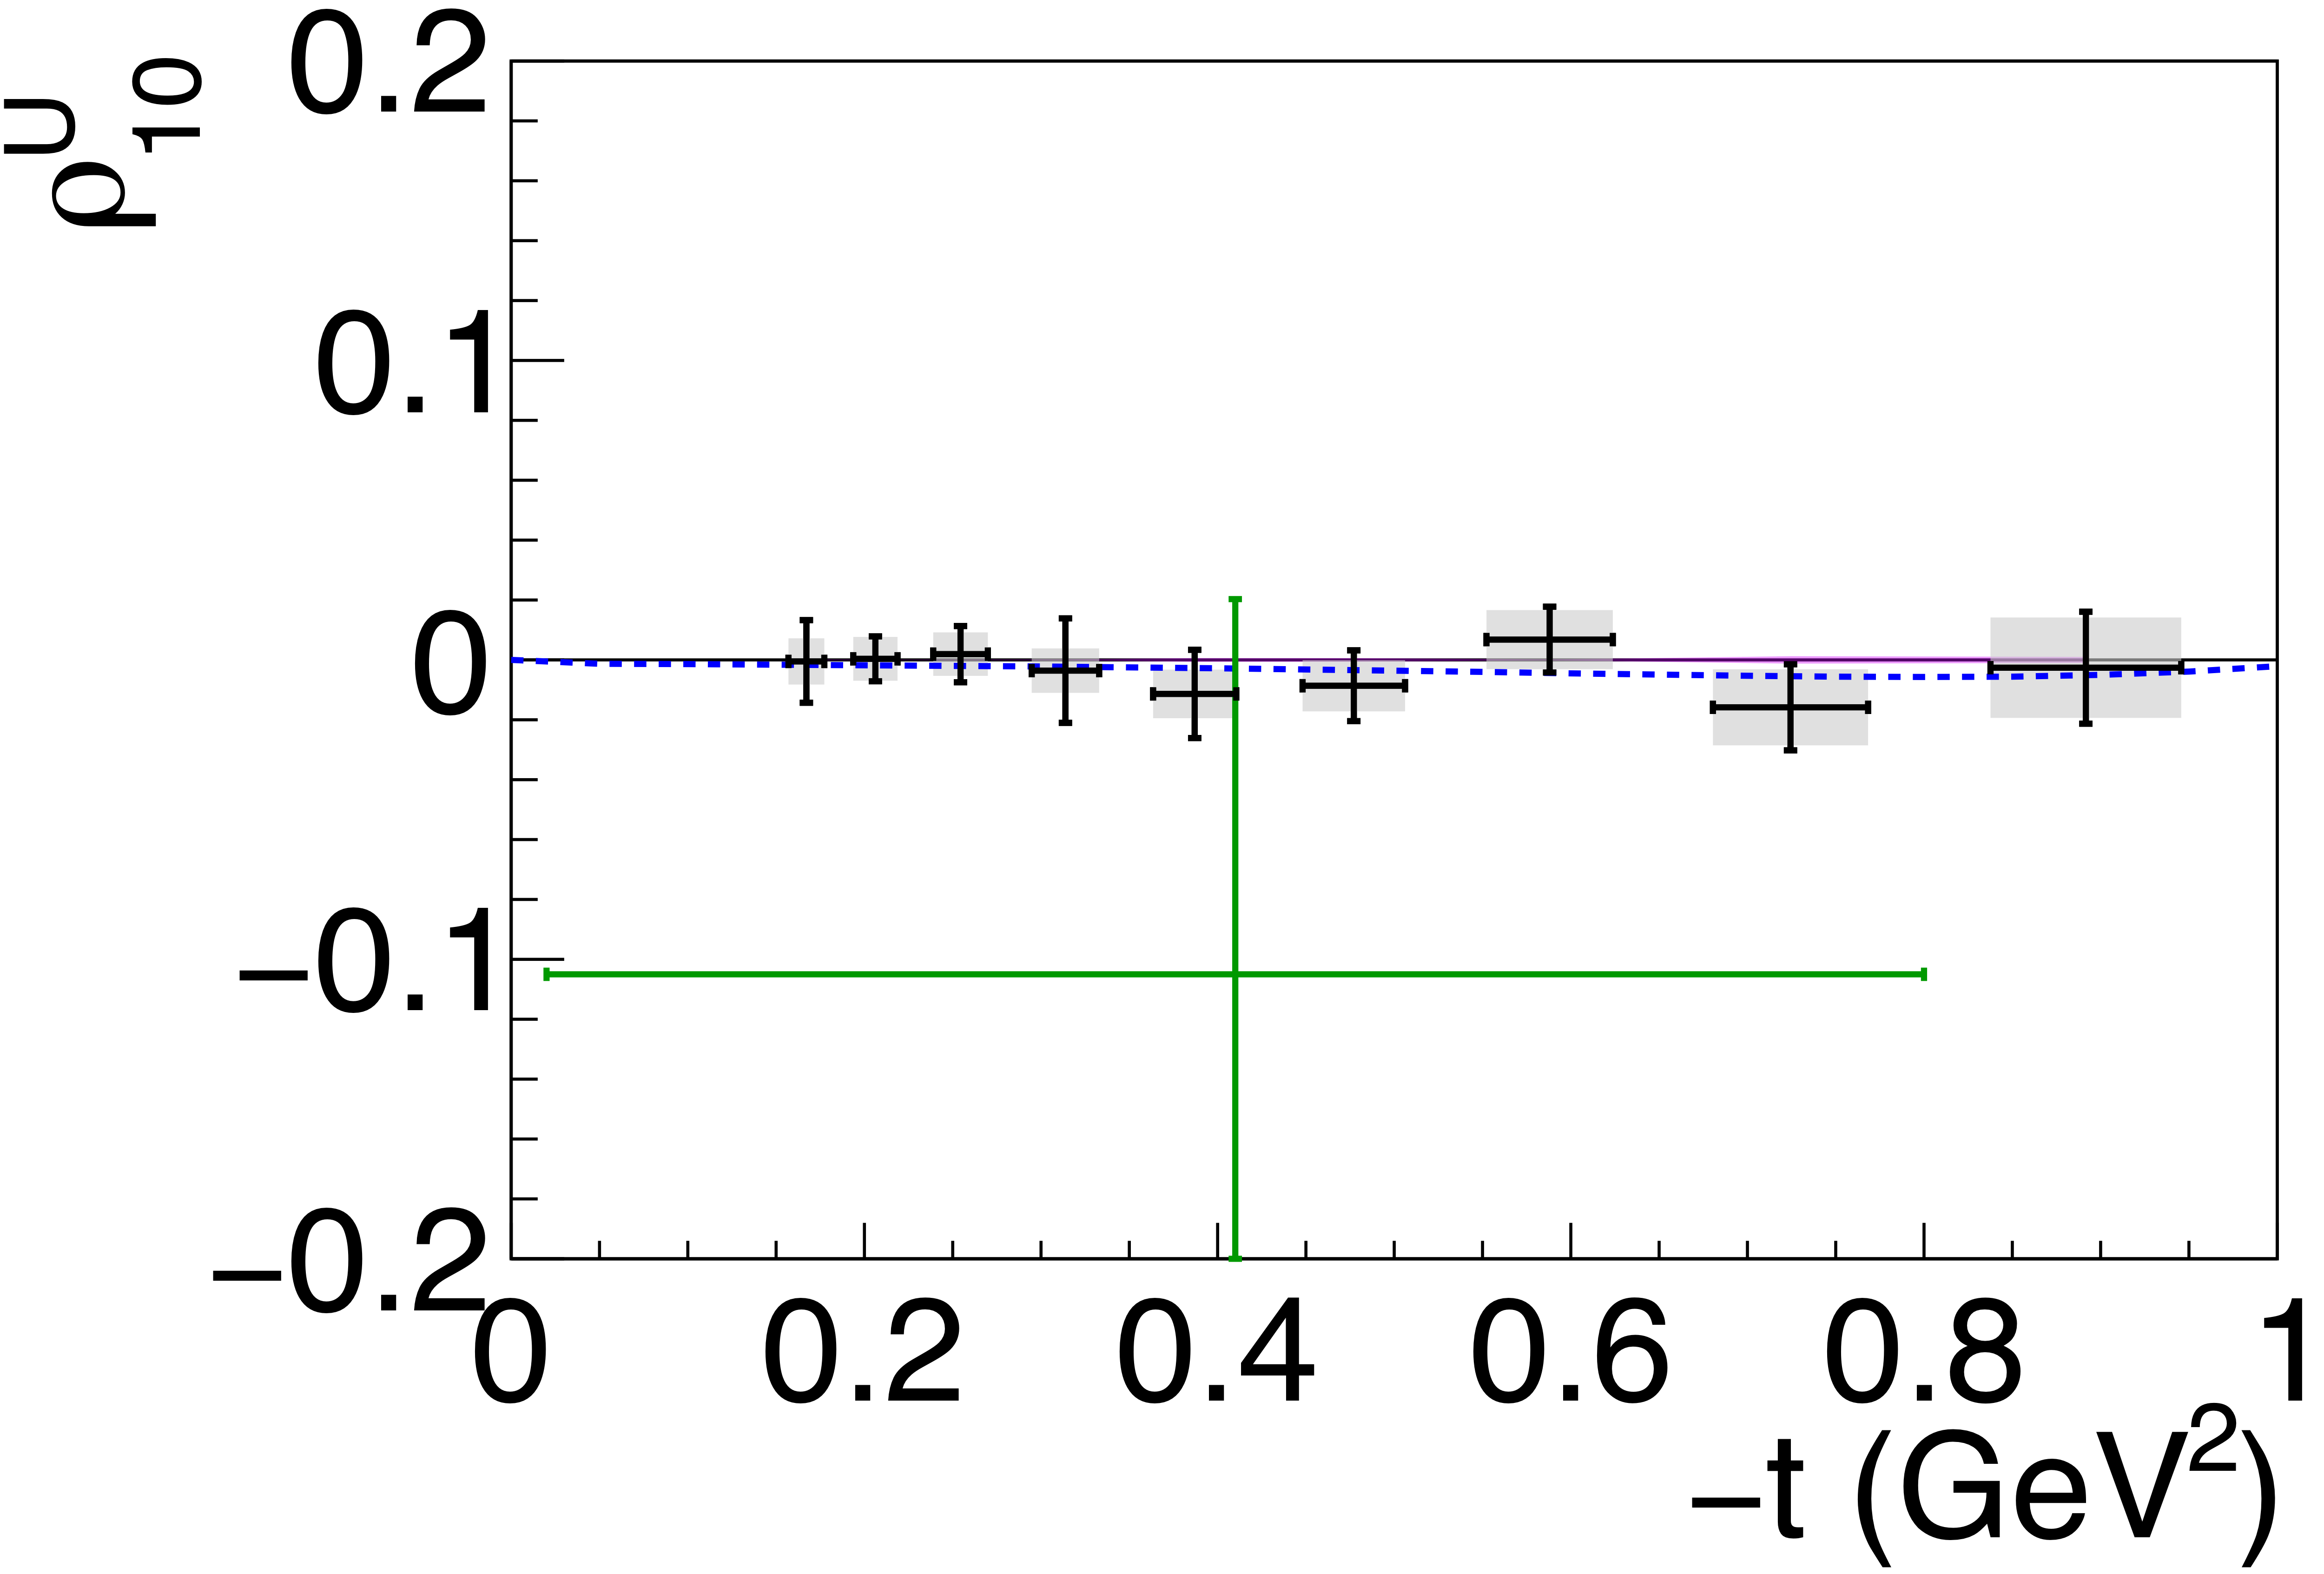
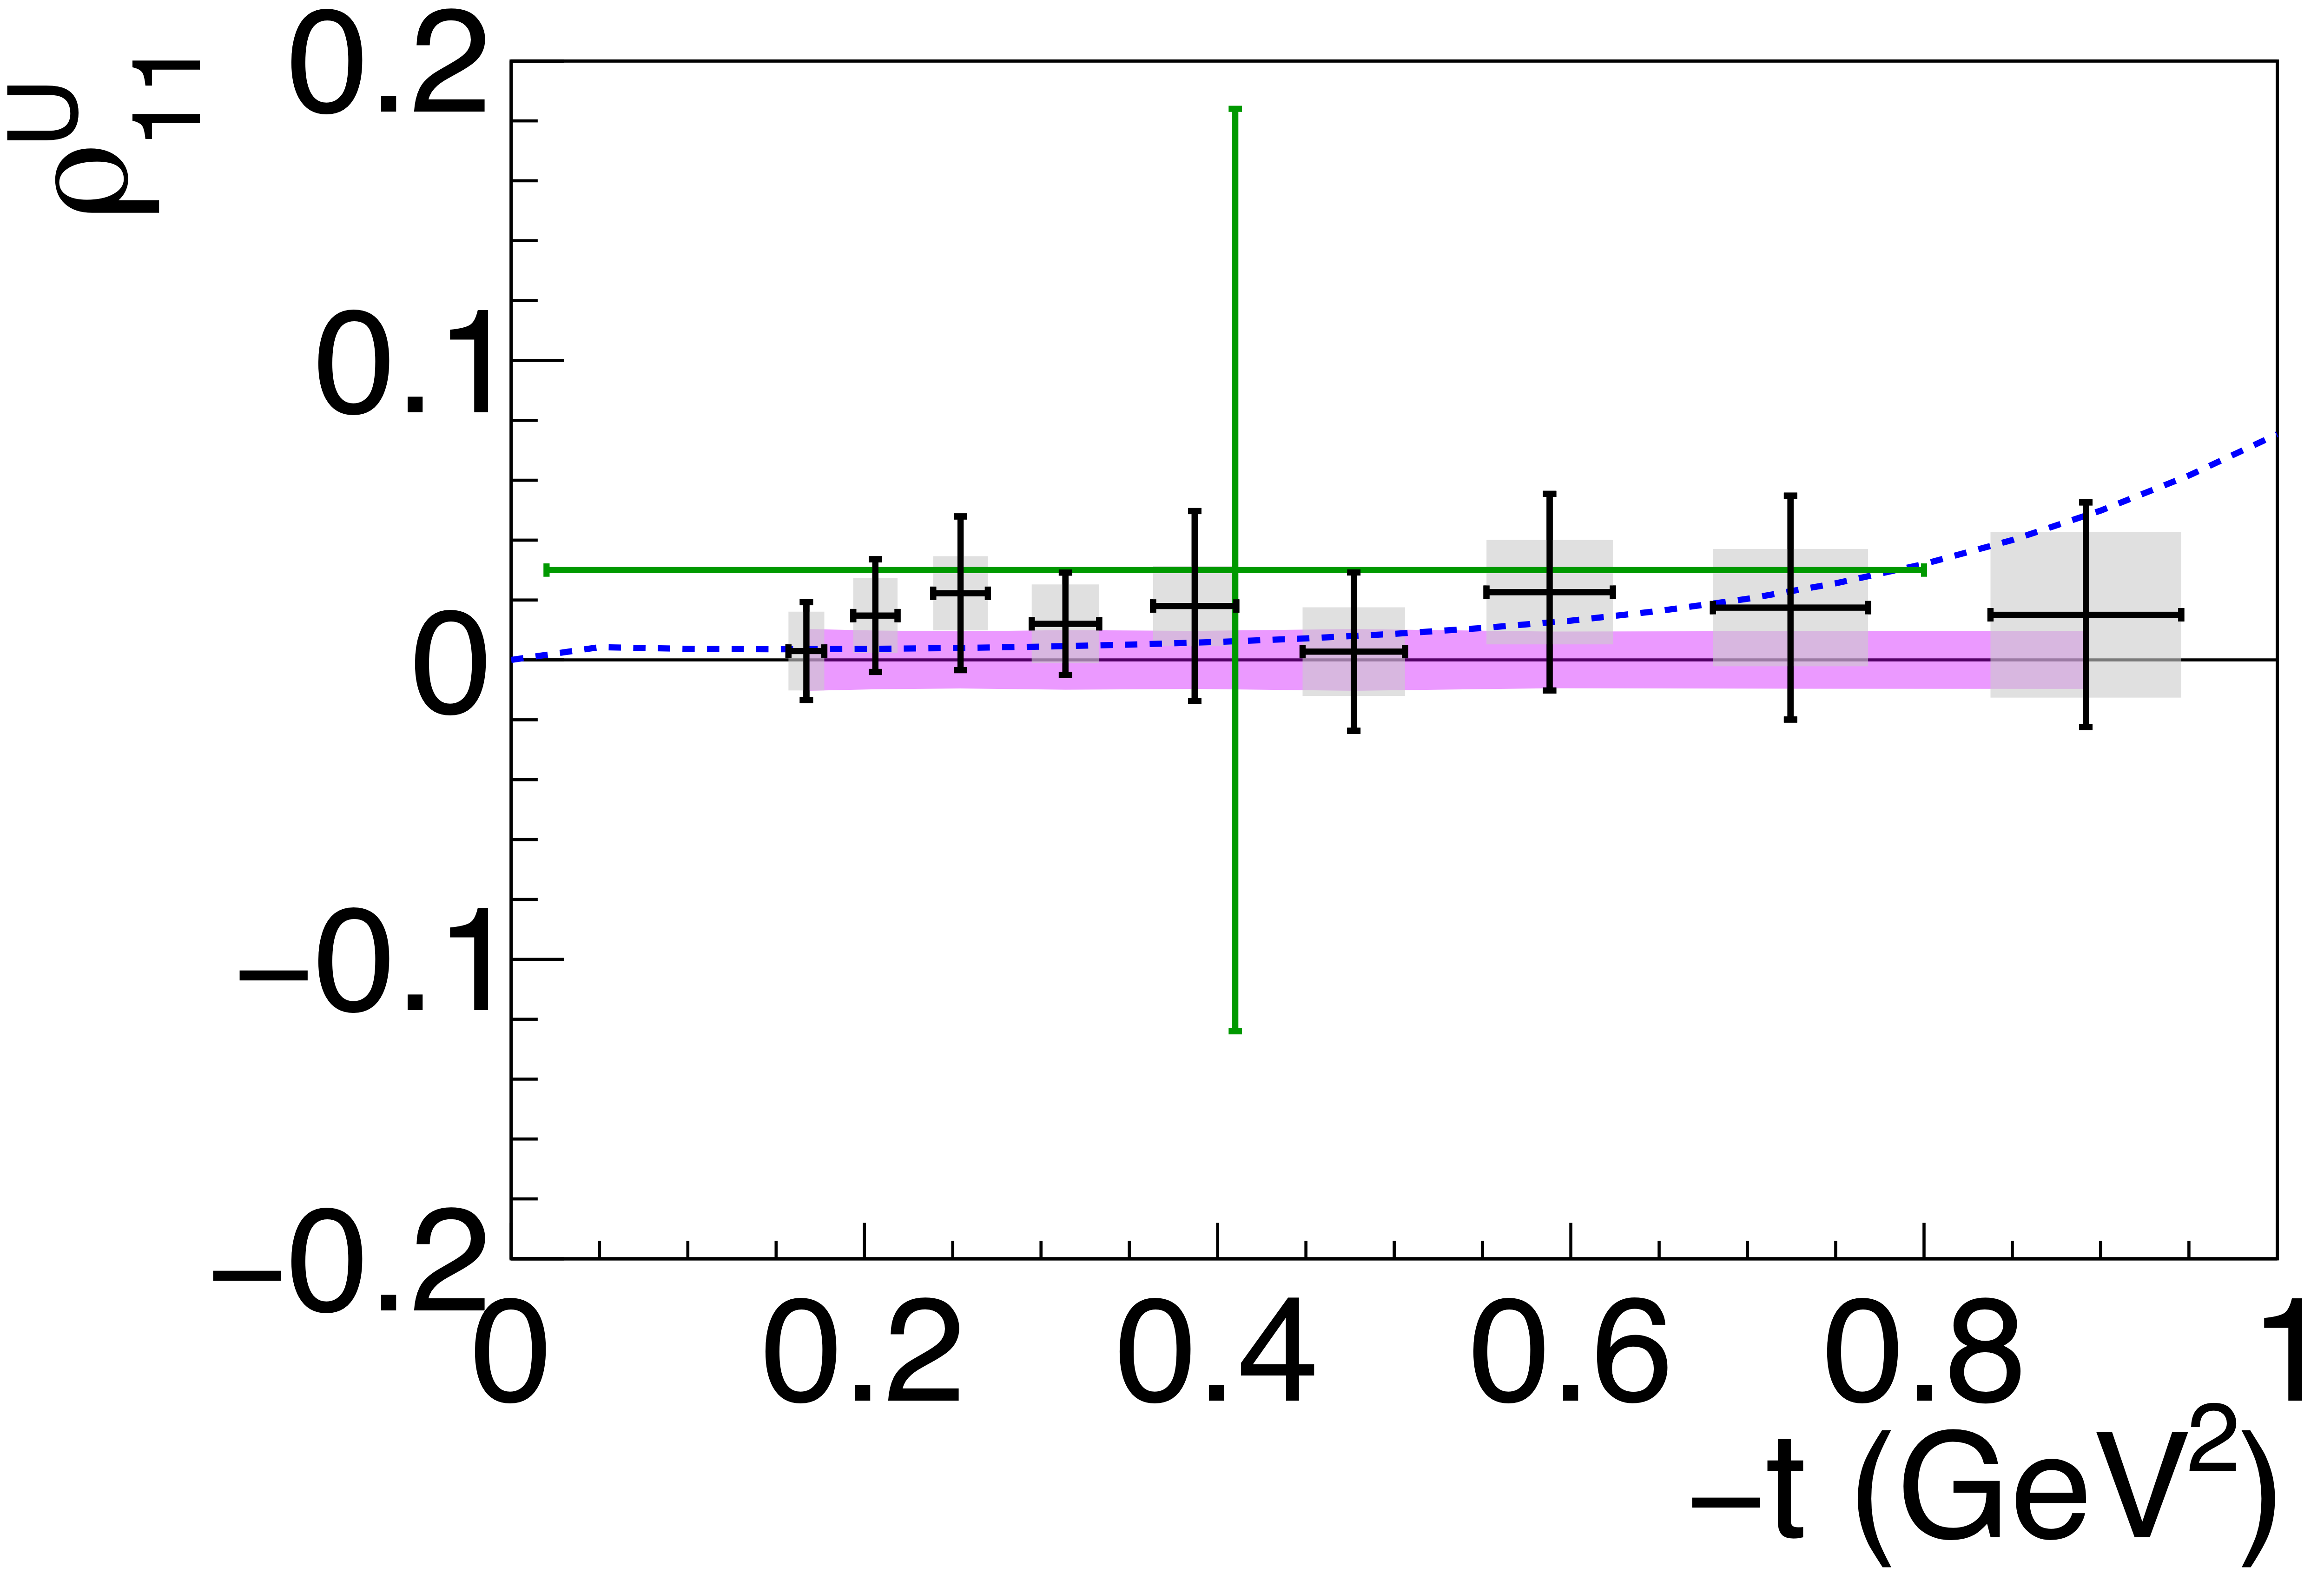
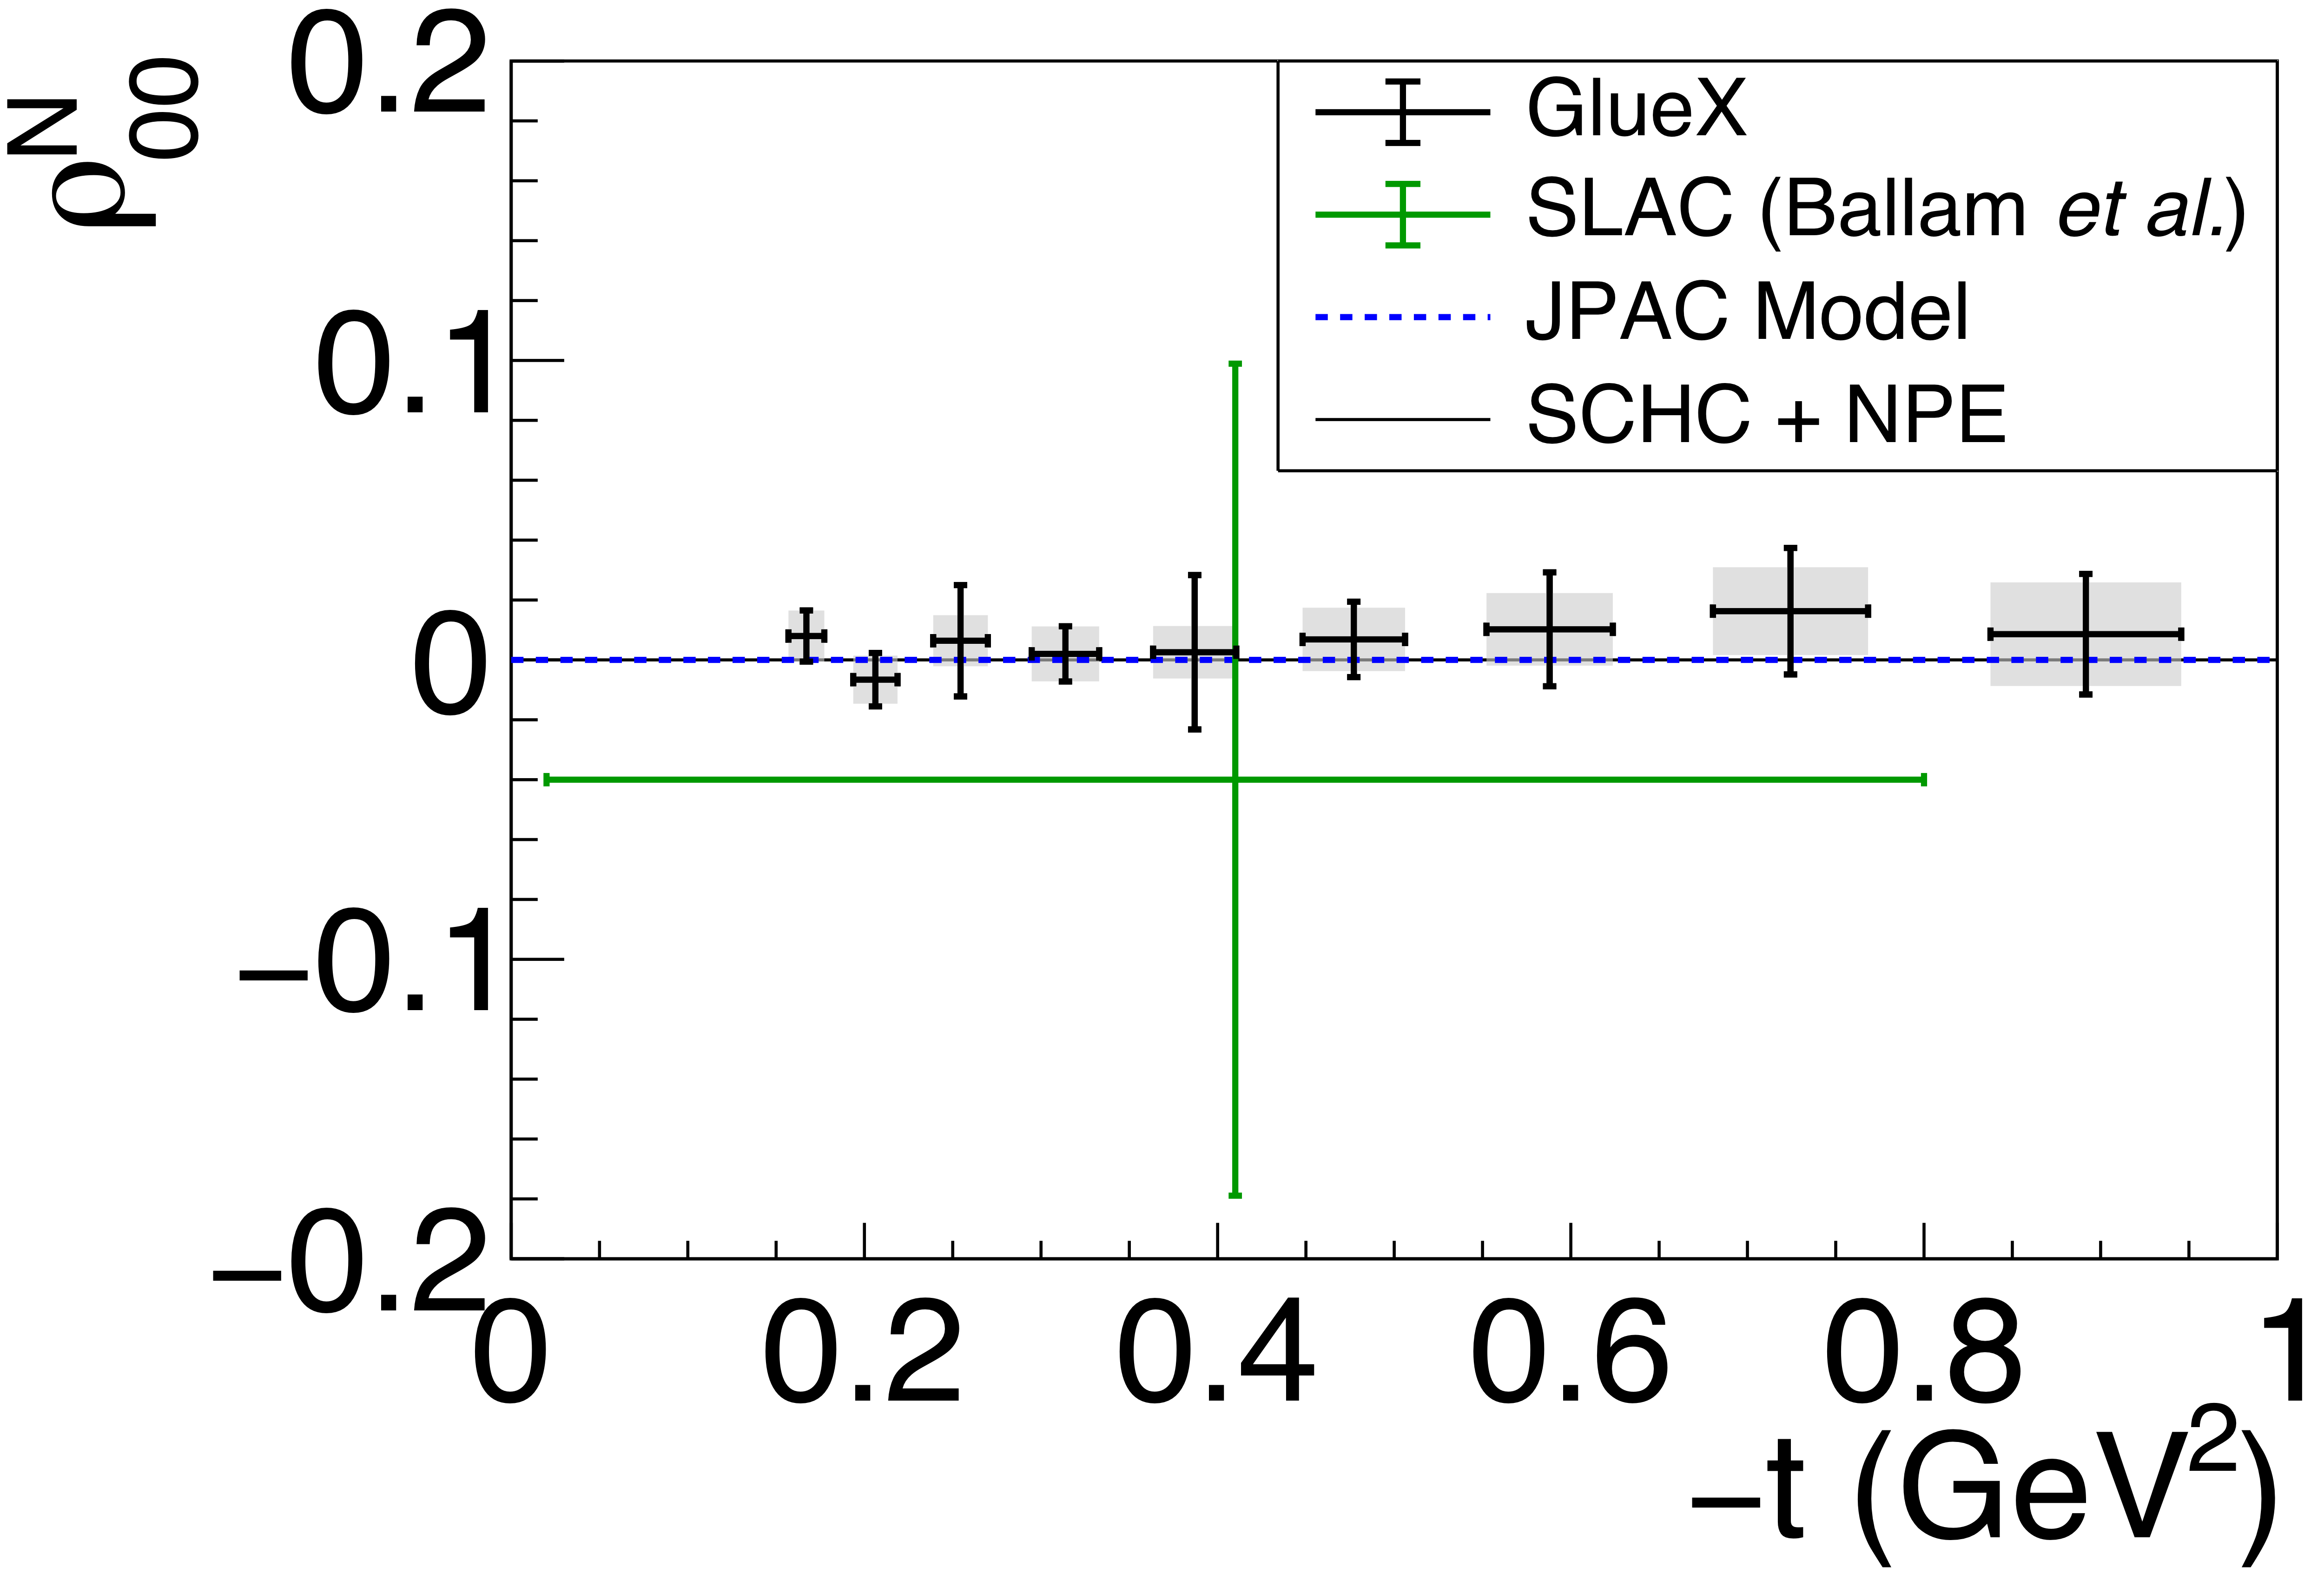
Figure 6a:
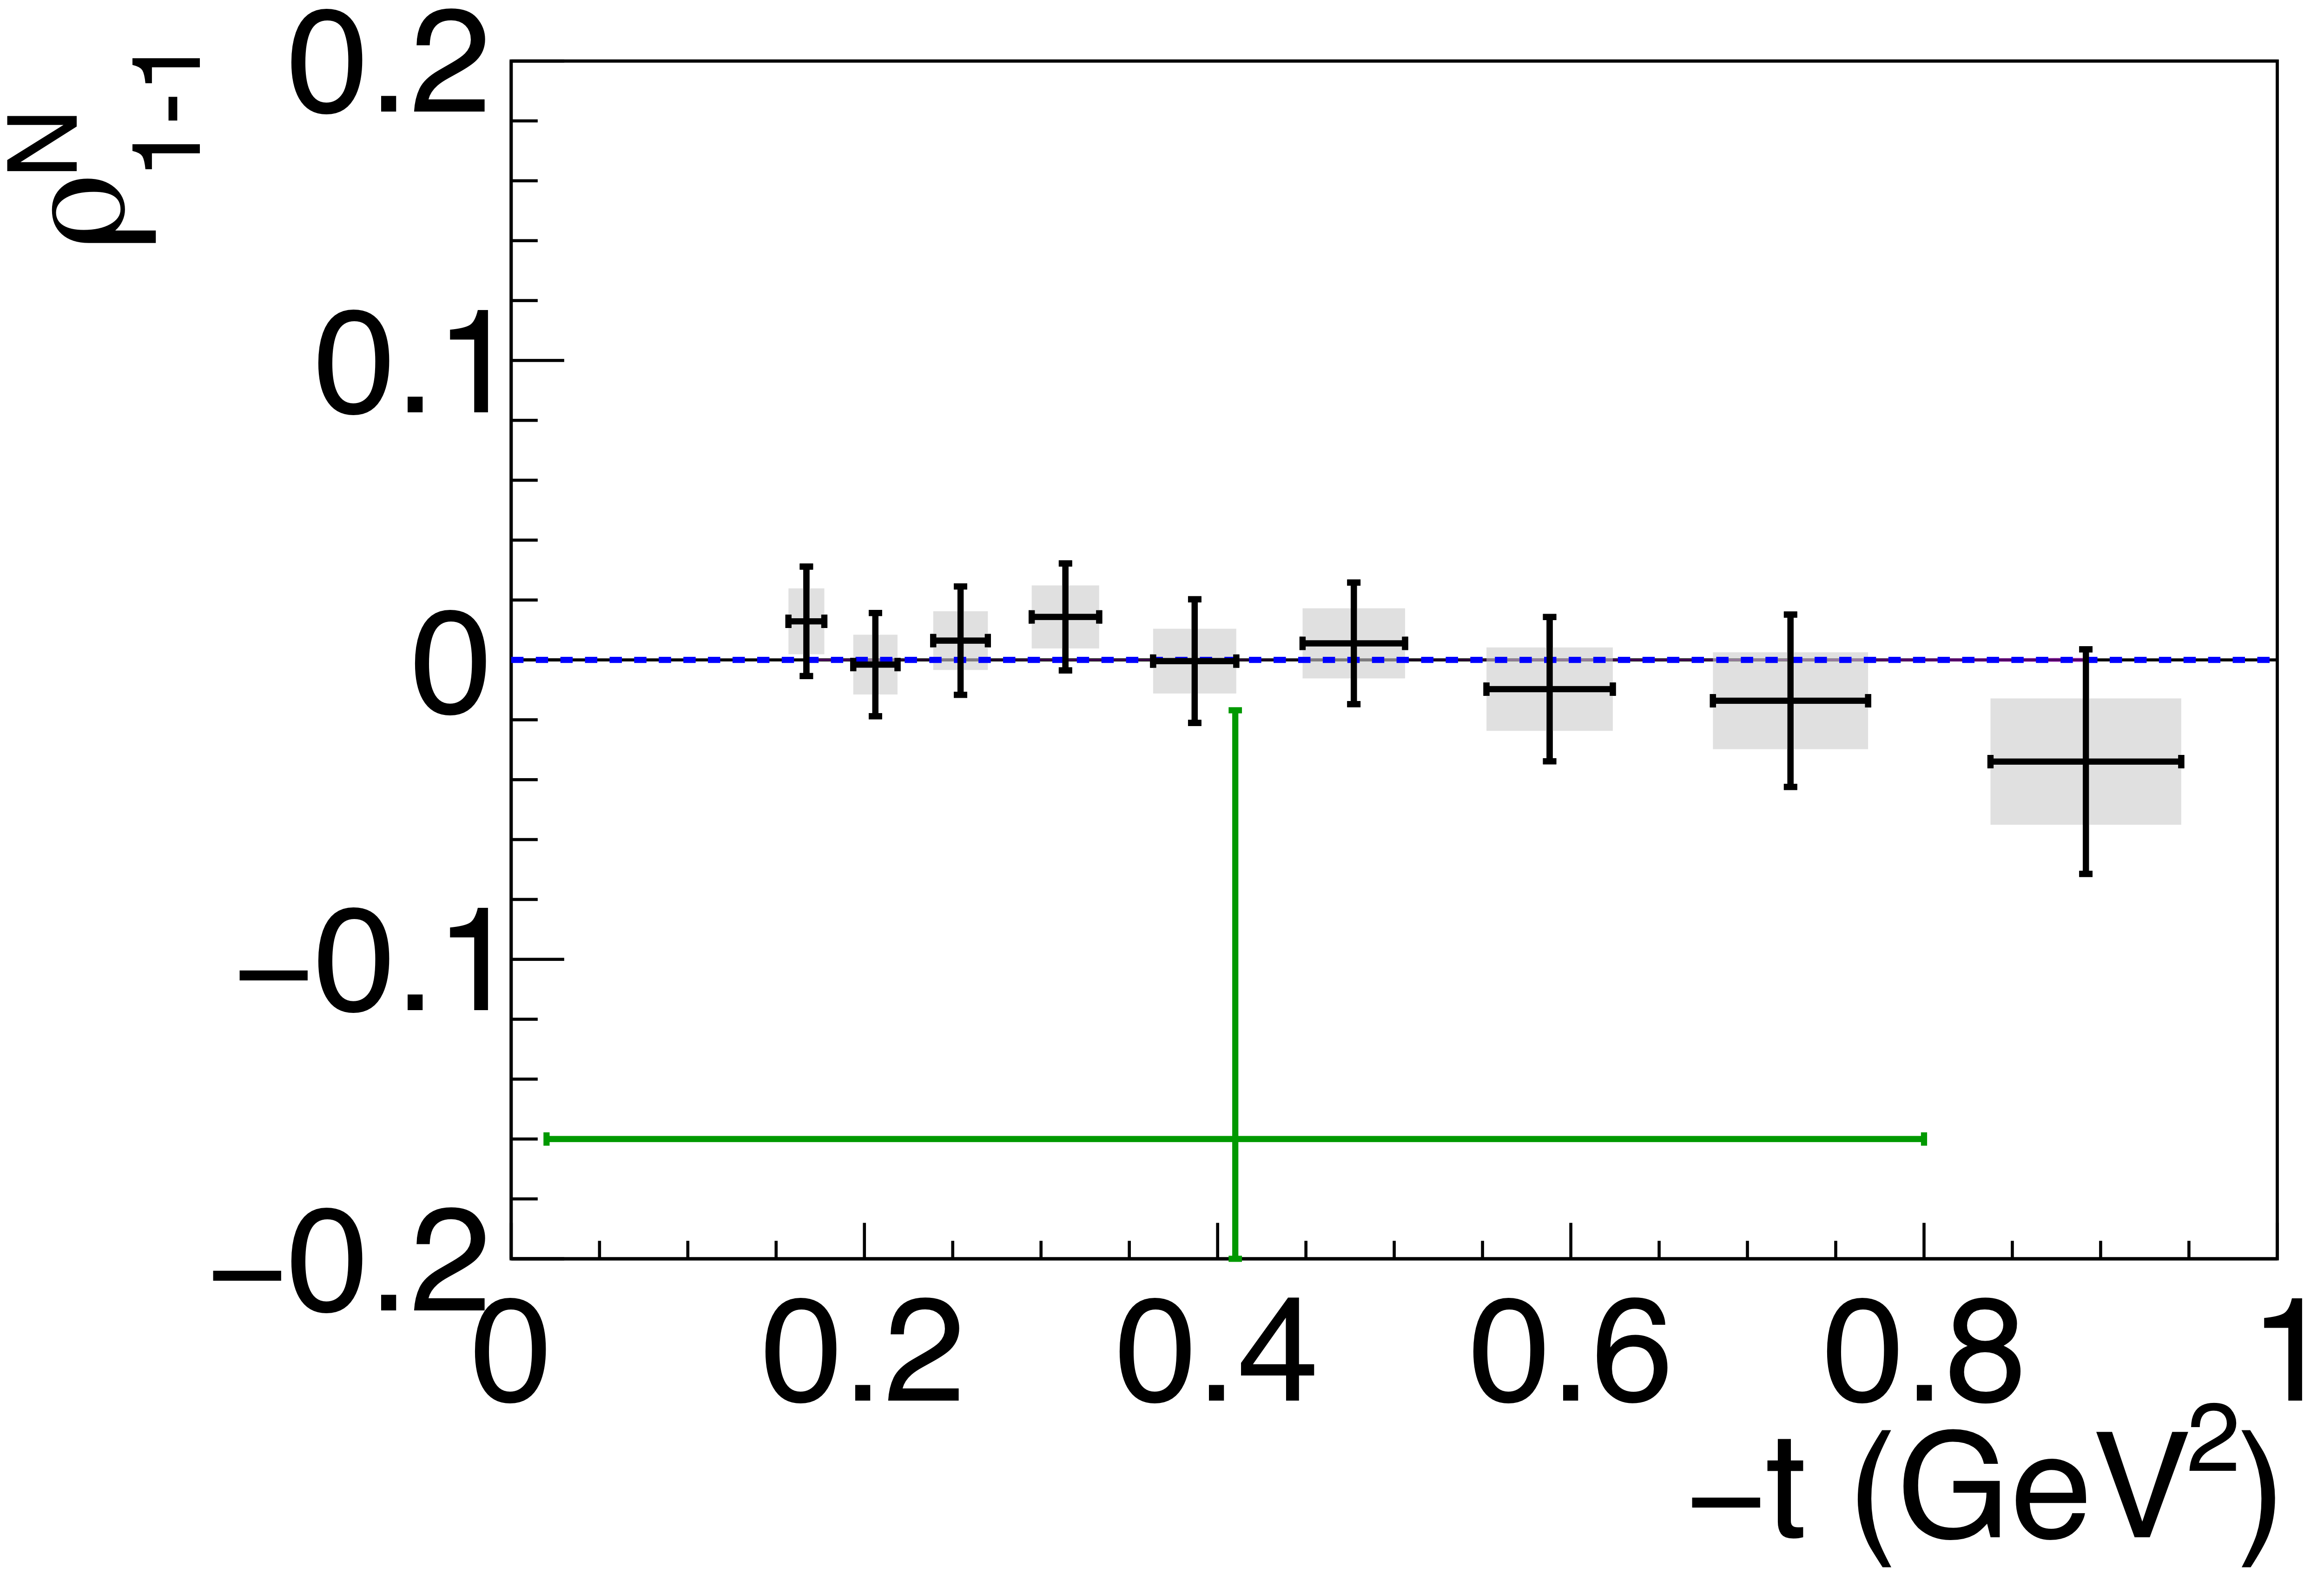
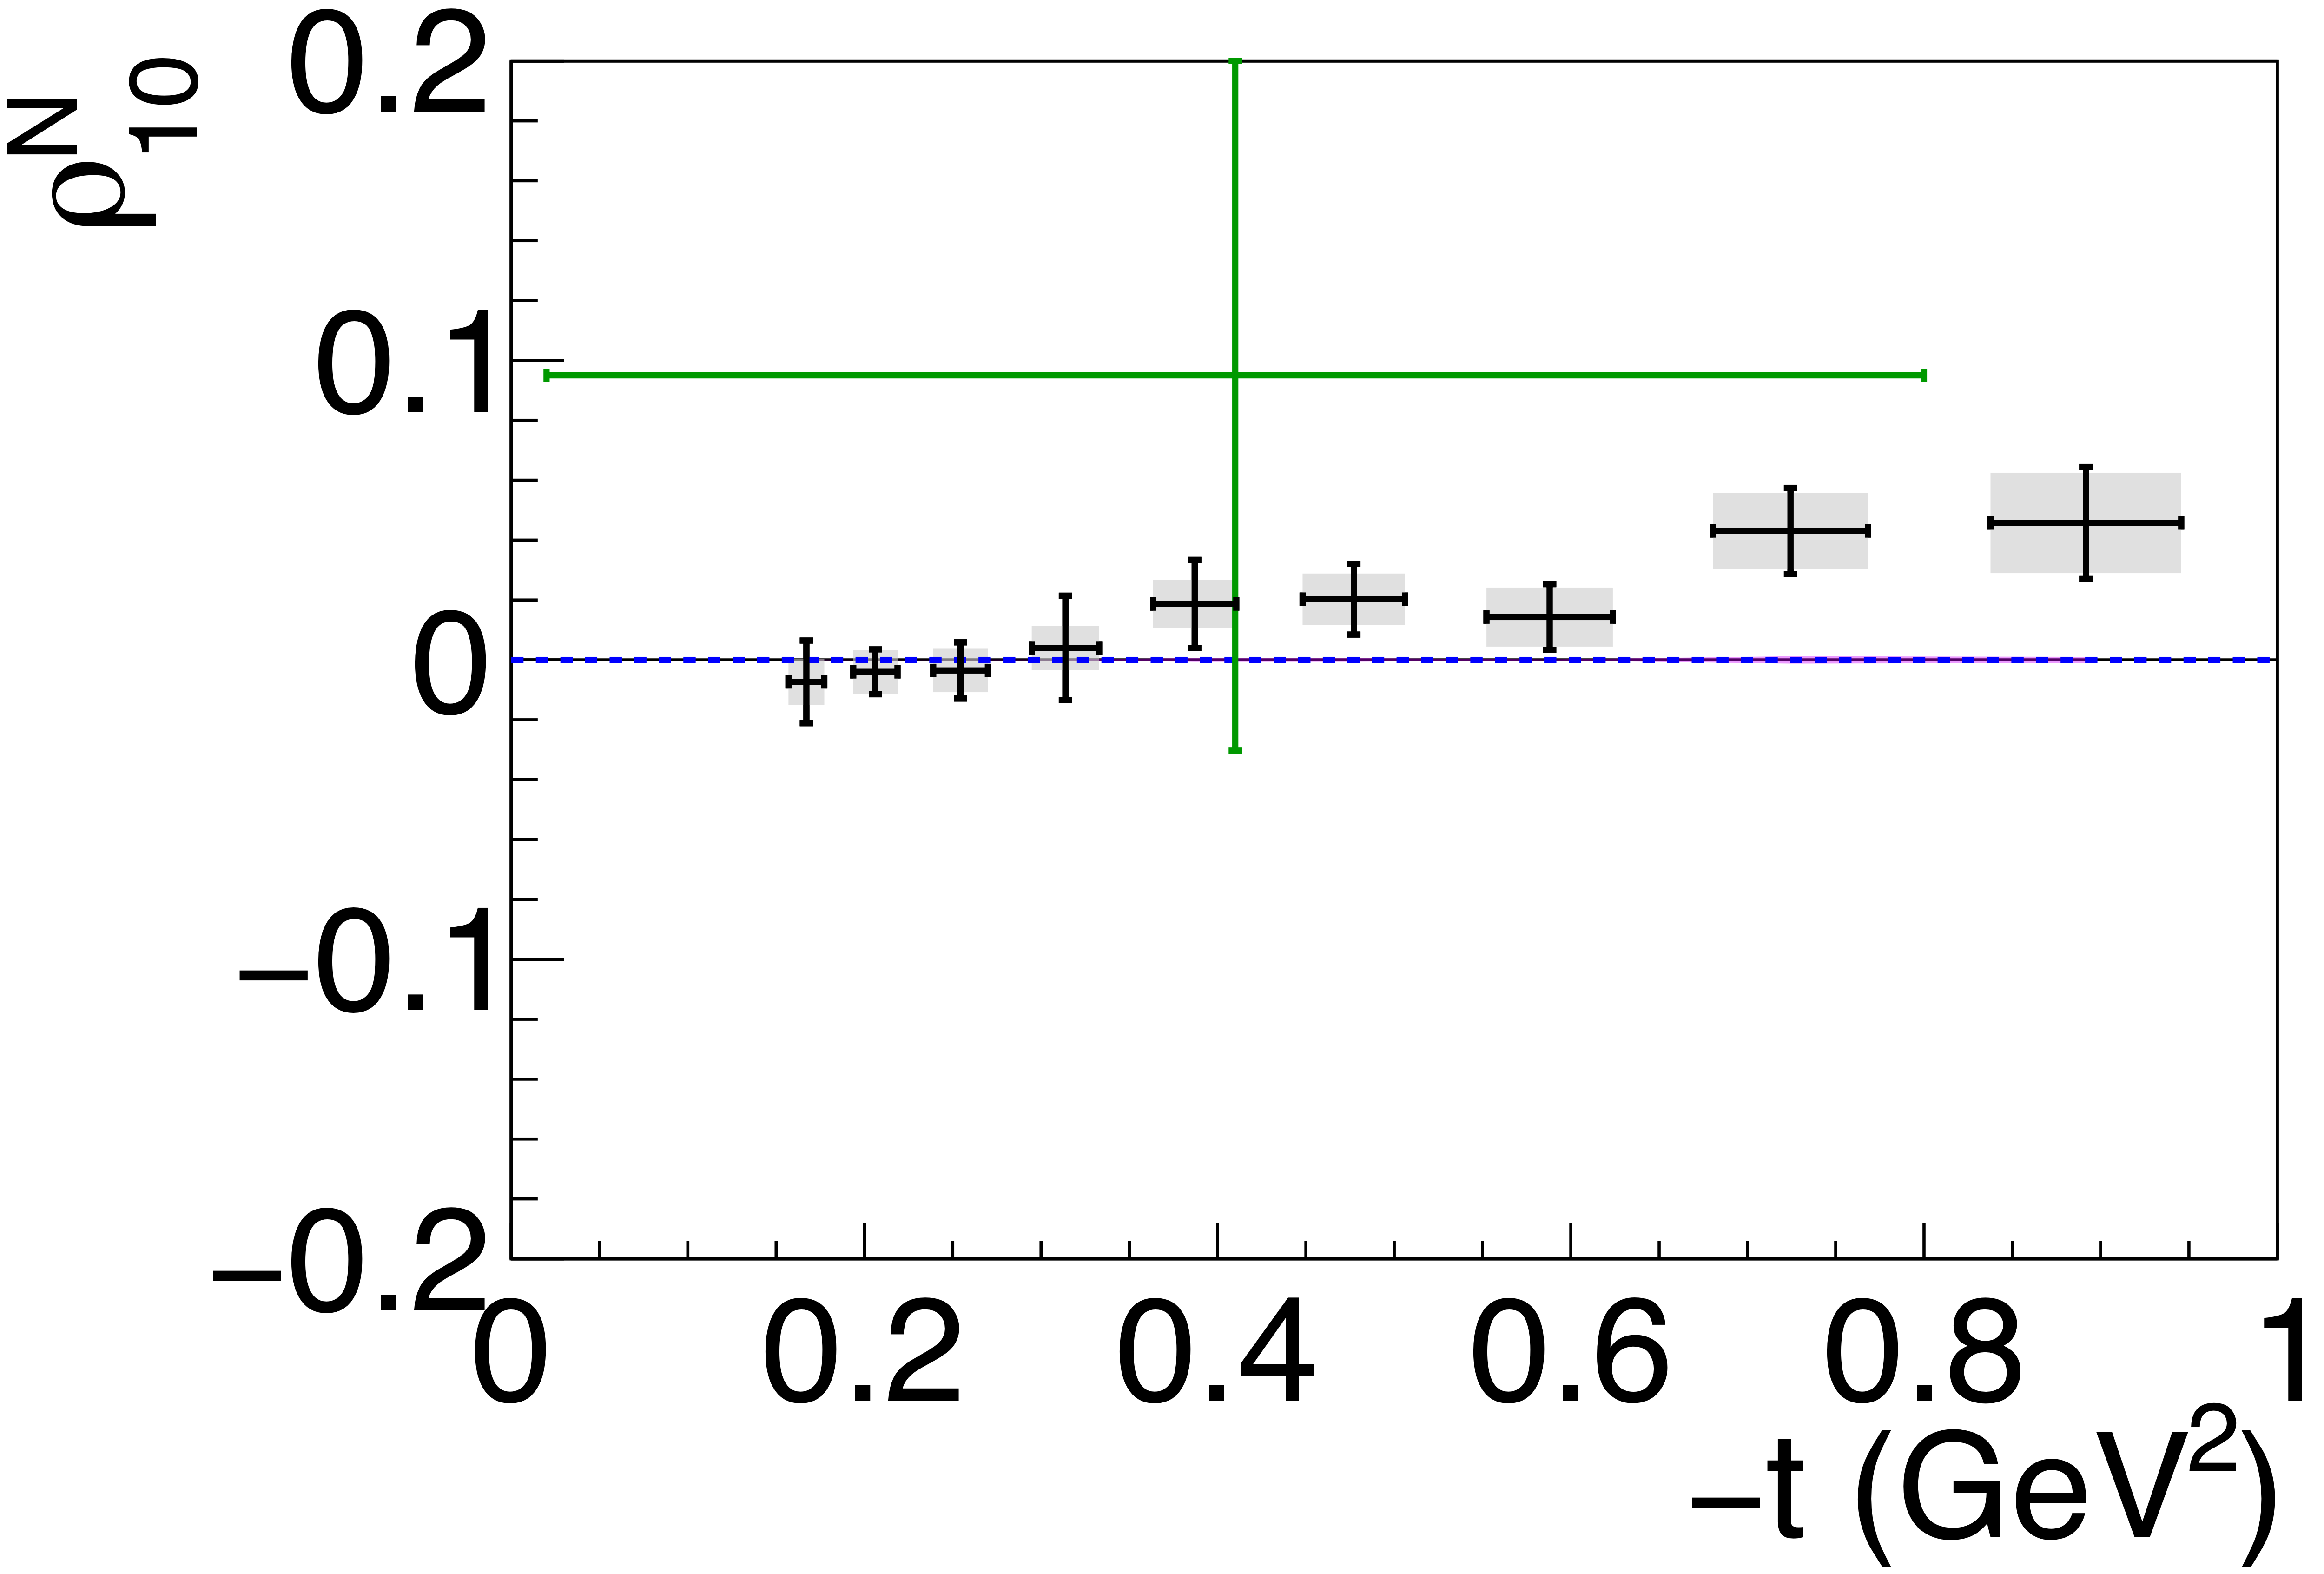
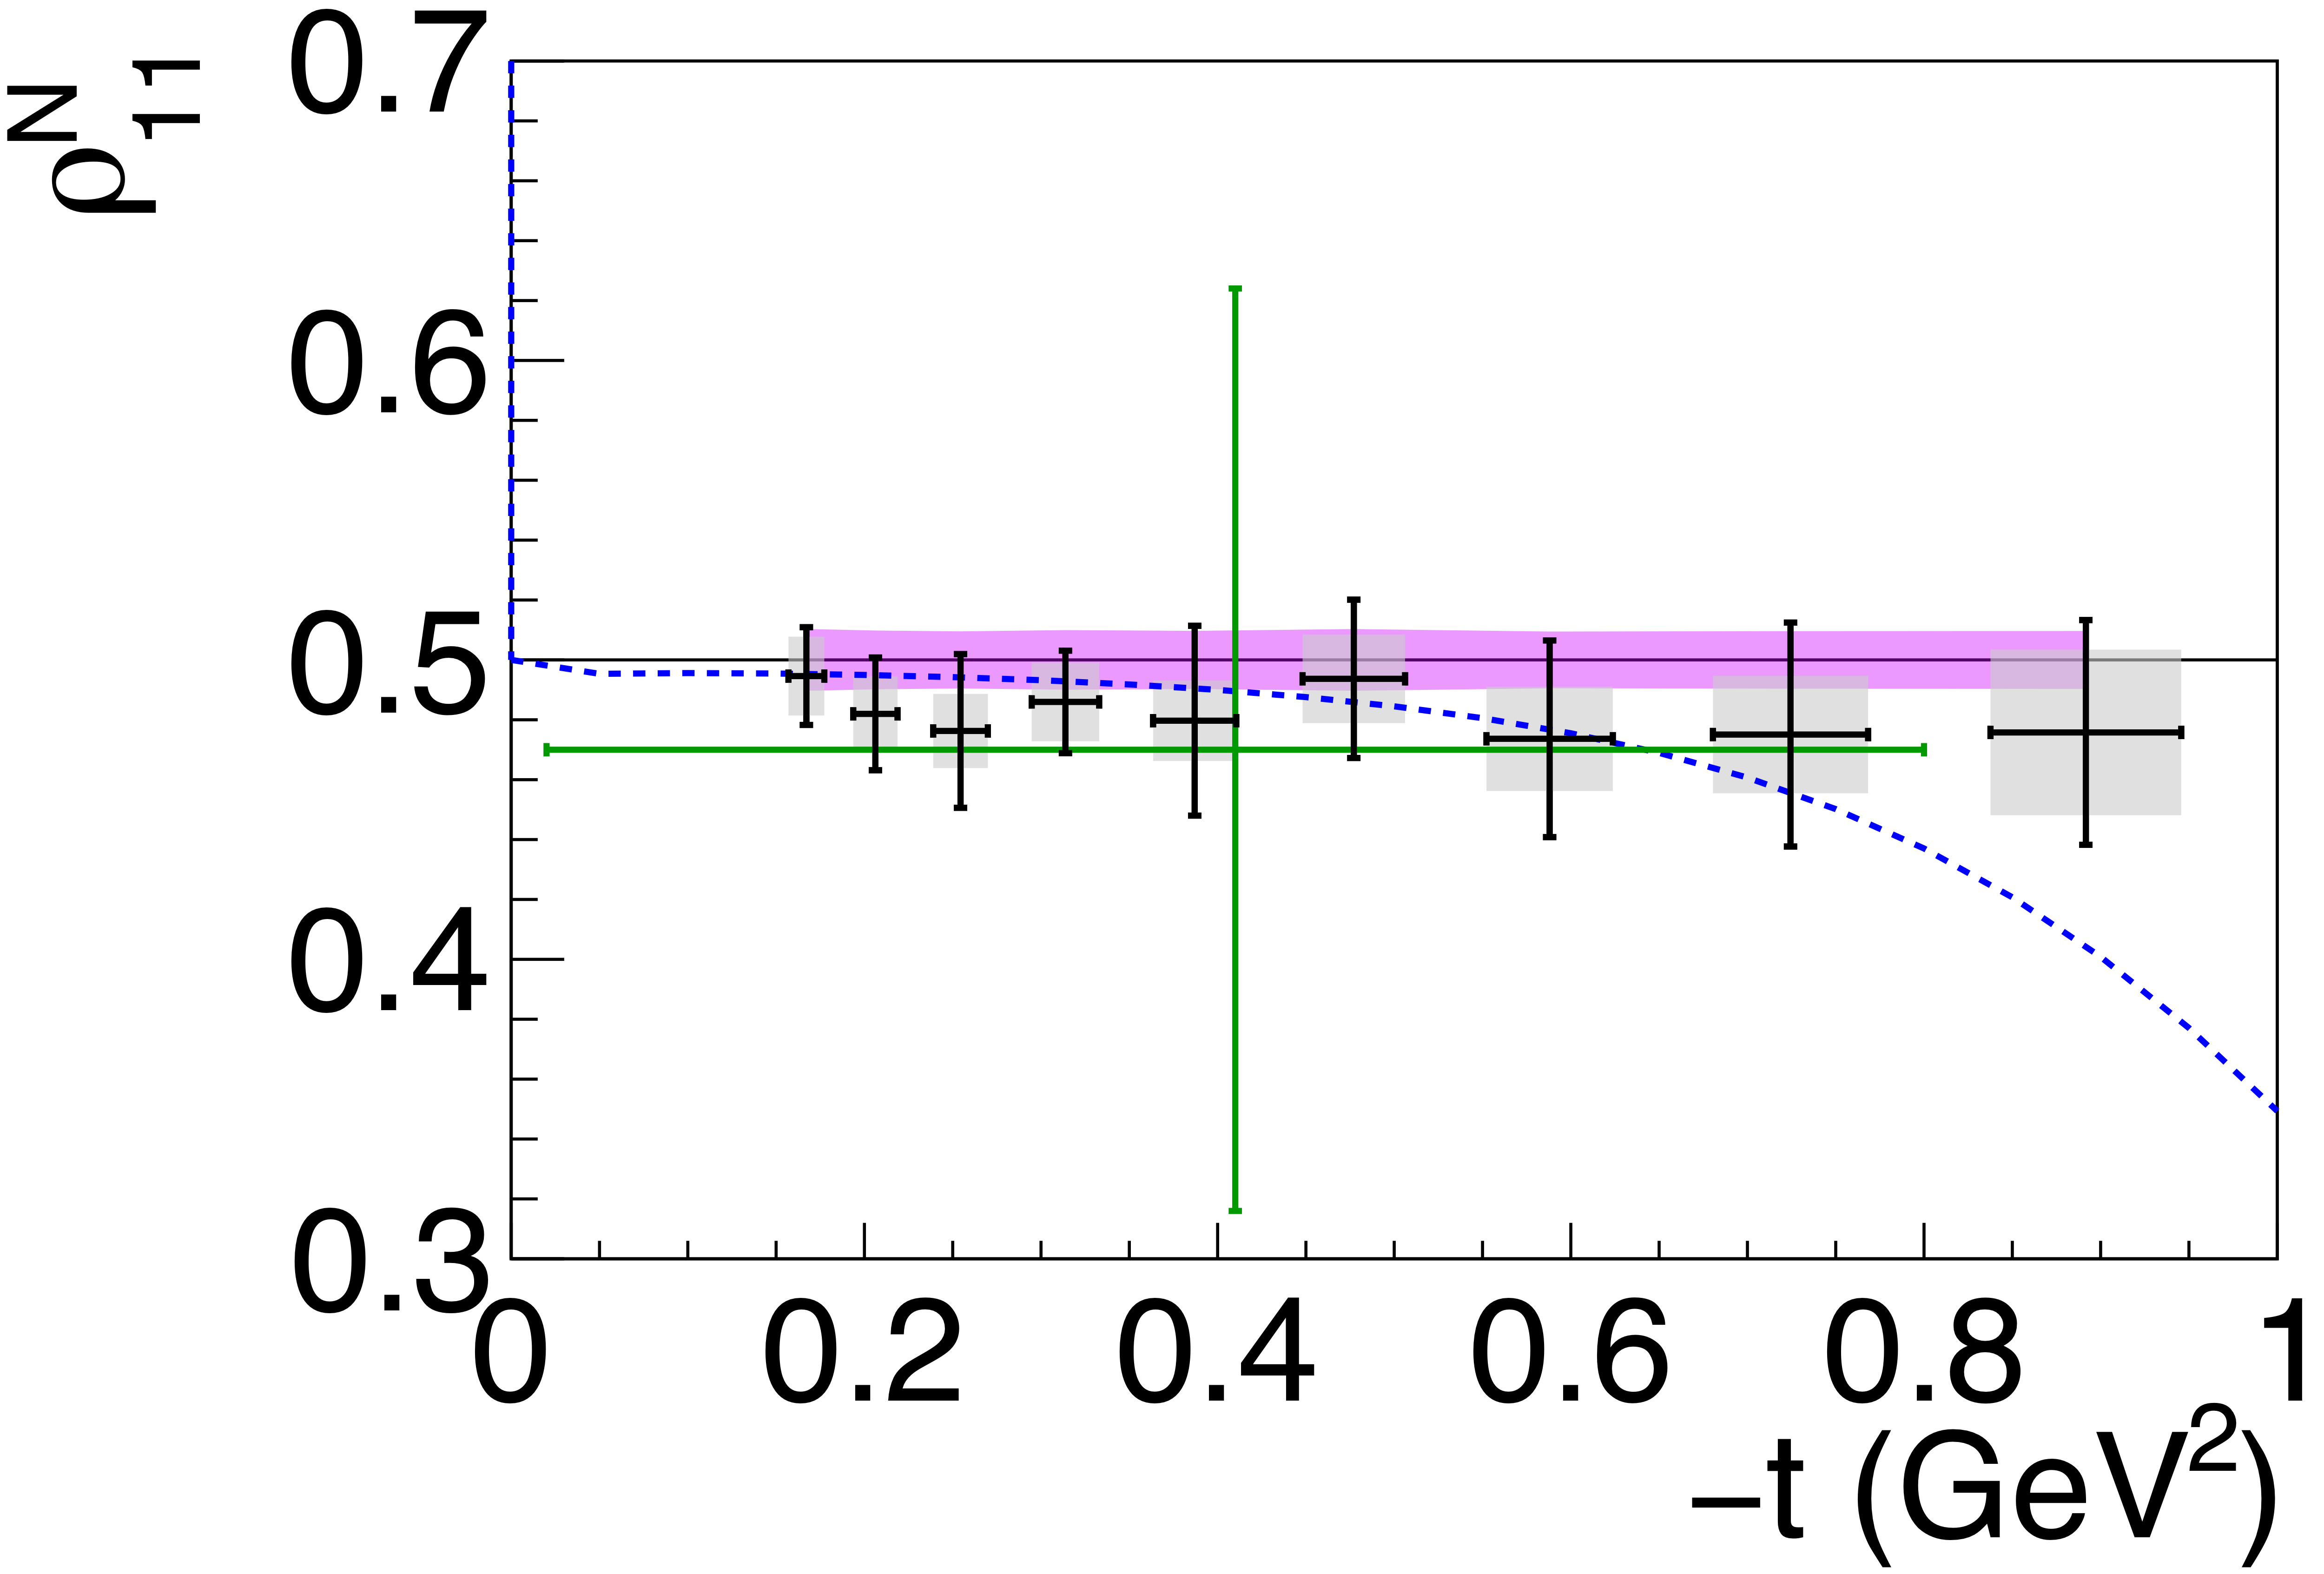
Spin-density matrix elements for $\phi(1020)$ mesons produced by a linearly polarized photon beam for (top row) unnatural- and (bottom row) natural-parity exchange. The symbols are the same as described in Fig. 5. |
Phys. Rev. C112 (2025) 2, 025203: downloads png pdf |
Figure 6b:
Spin-density matrix elements for $\phi(1020)$ mesons produced by a linearly polarized photon beam for (top row) unnatural- and (bottom row) natural-parity exchange. The symbols are the same as described in Fig. 5. |
Phys. Rev. C112 (2025) 2, 025203: downloads png pdf |
Figure 6c:
Spin-density matrix elements for $\phi(1020)$ mesons produced by a linearly polarized photon beam for (top row) unnatural- and (bottom row) natural-parity exchange. The symbols are the same as described in Fig. 5. |
Phys. Rev. C112 (2025) 2, 025203: downloads png pdf |
Figure 6d:
Spin-density matrix elements for $\phi(1020)$ mesons produced by a linearly polarized photon beam for (top row) unnatural- and (bottom row) natural-parity exchange. The symbols are the same as described in Fig. 5. |
Phys. Rev. C112 (2025) 2, 025203: downloads png pdf |
Figure 6e:
Spin-density matrix elements for $\phi(1020)$ mesons produced by a linearly polarized photon beam for (top row) unnatural- and (bottom row) natural-parity exchange. The symbols are the same as described in Fig. 5. |
Phys. Rev. C112 (2025) 2, 025203: downloads png pdf |
Figure 6f:
Spin-density matrix elements for $\phi(1020)$ mesons produced by a linearly polarized photon beam for (top row) unnatural- and (bottom row) natural-parity exchange. The symbols are the same as described in Fig. 5. |
Phys. Rev. C112 (2025) 2, 025203: downloads png pdf |
Figure 6g:
Spin-density matrix elements for $\phi(1020)$ mesons produced by a linearly polarized photon beam for (top row) unnatural- and (bottom row) natural-parity exchange. The symbols are the same as described in Fig. 5. |
Phys. Rev. C112 (2025) 2, 025203: downloads png pdf |
Figure 6h:
Spin-density matrix elements for $\phi(1020)$ mesons produced by a linearly polarized photon beam for (top row) unnatural- and (bottom row) natural-parity exchange. The symbols are the same as described in Fig. 5. |
Phys. Rev. C112 (2025) 2, 025203: downloads png pdf |
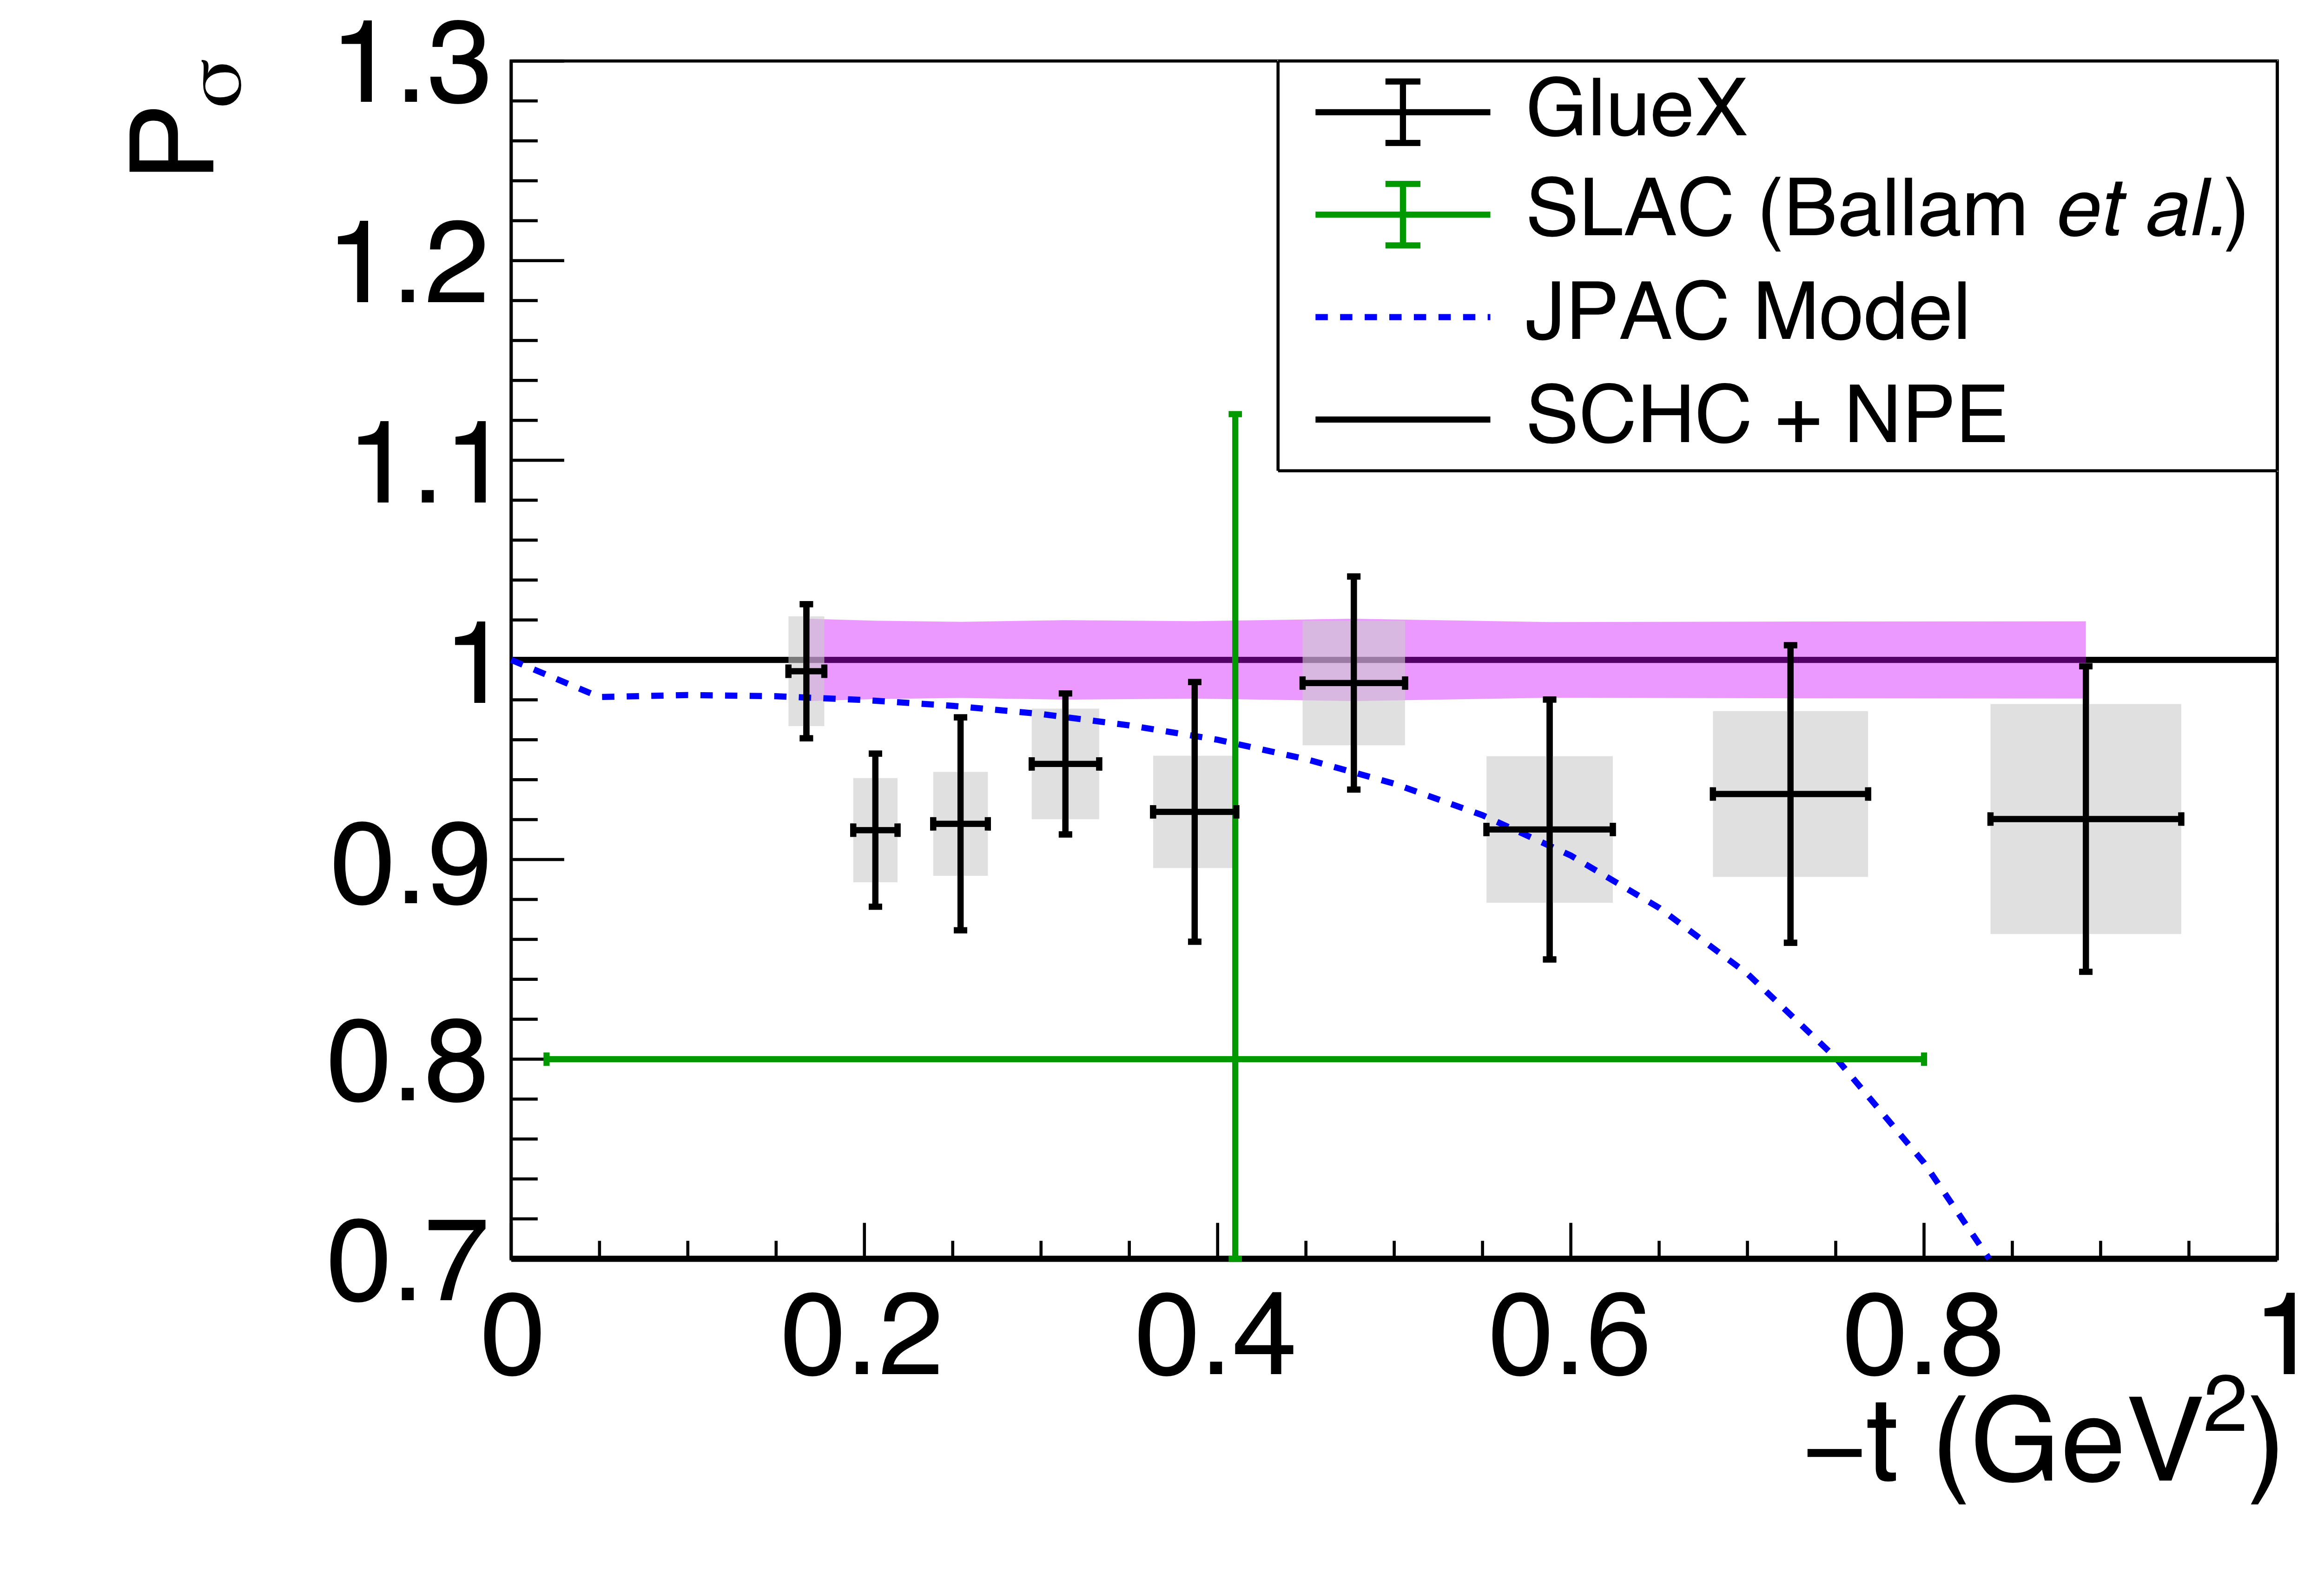
Figure 7a:
Parity asymmetry for photoproduced $\phi(1020)$. The symbols are the same as described in Fig. 5. |
Phys. Rev. C112 (2025) 2, 025203: downloads png pdf |
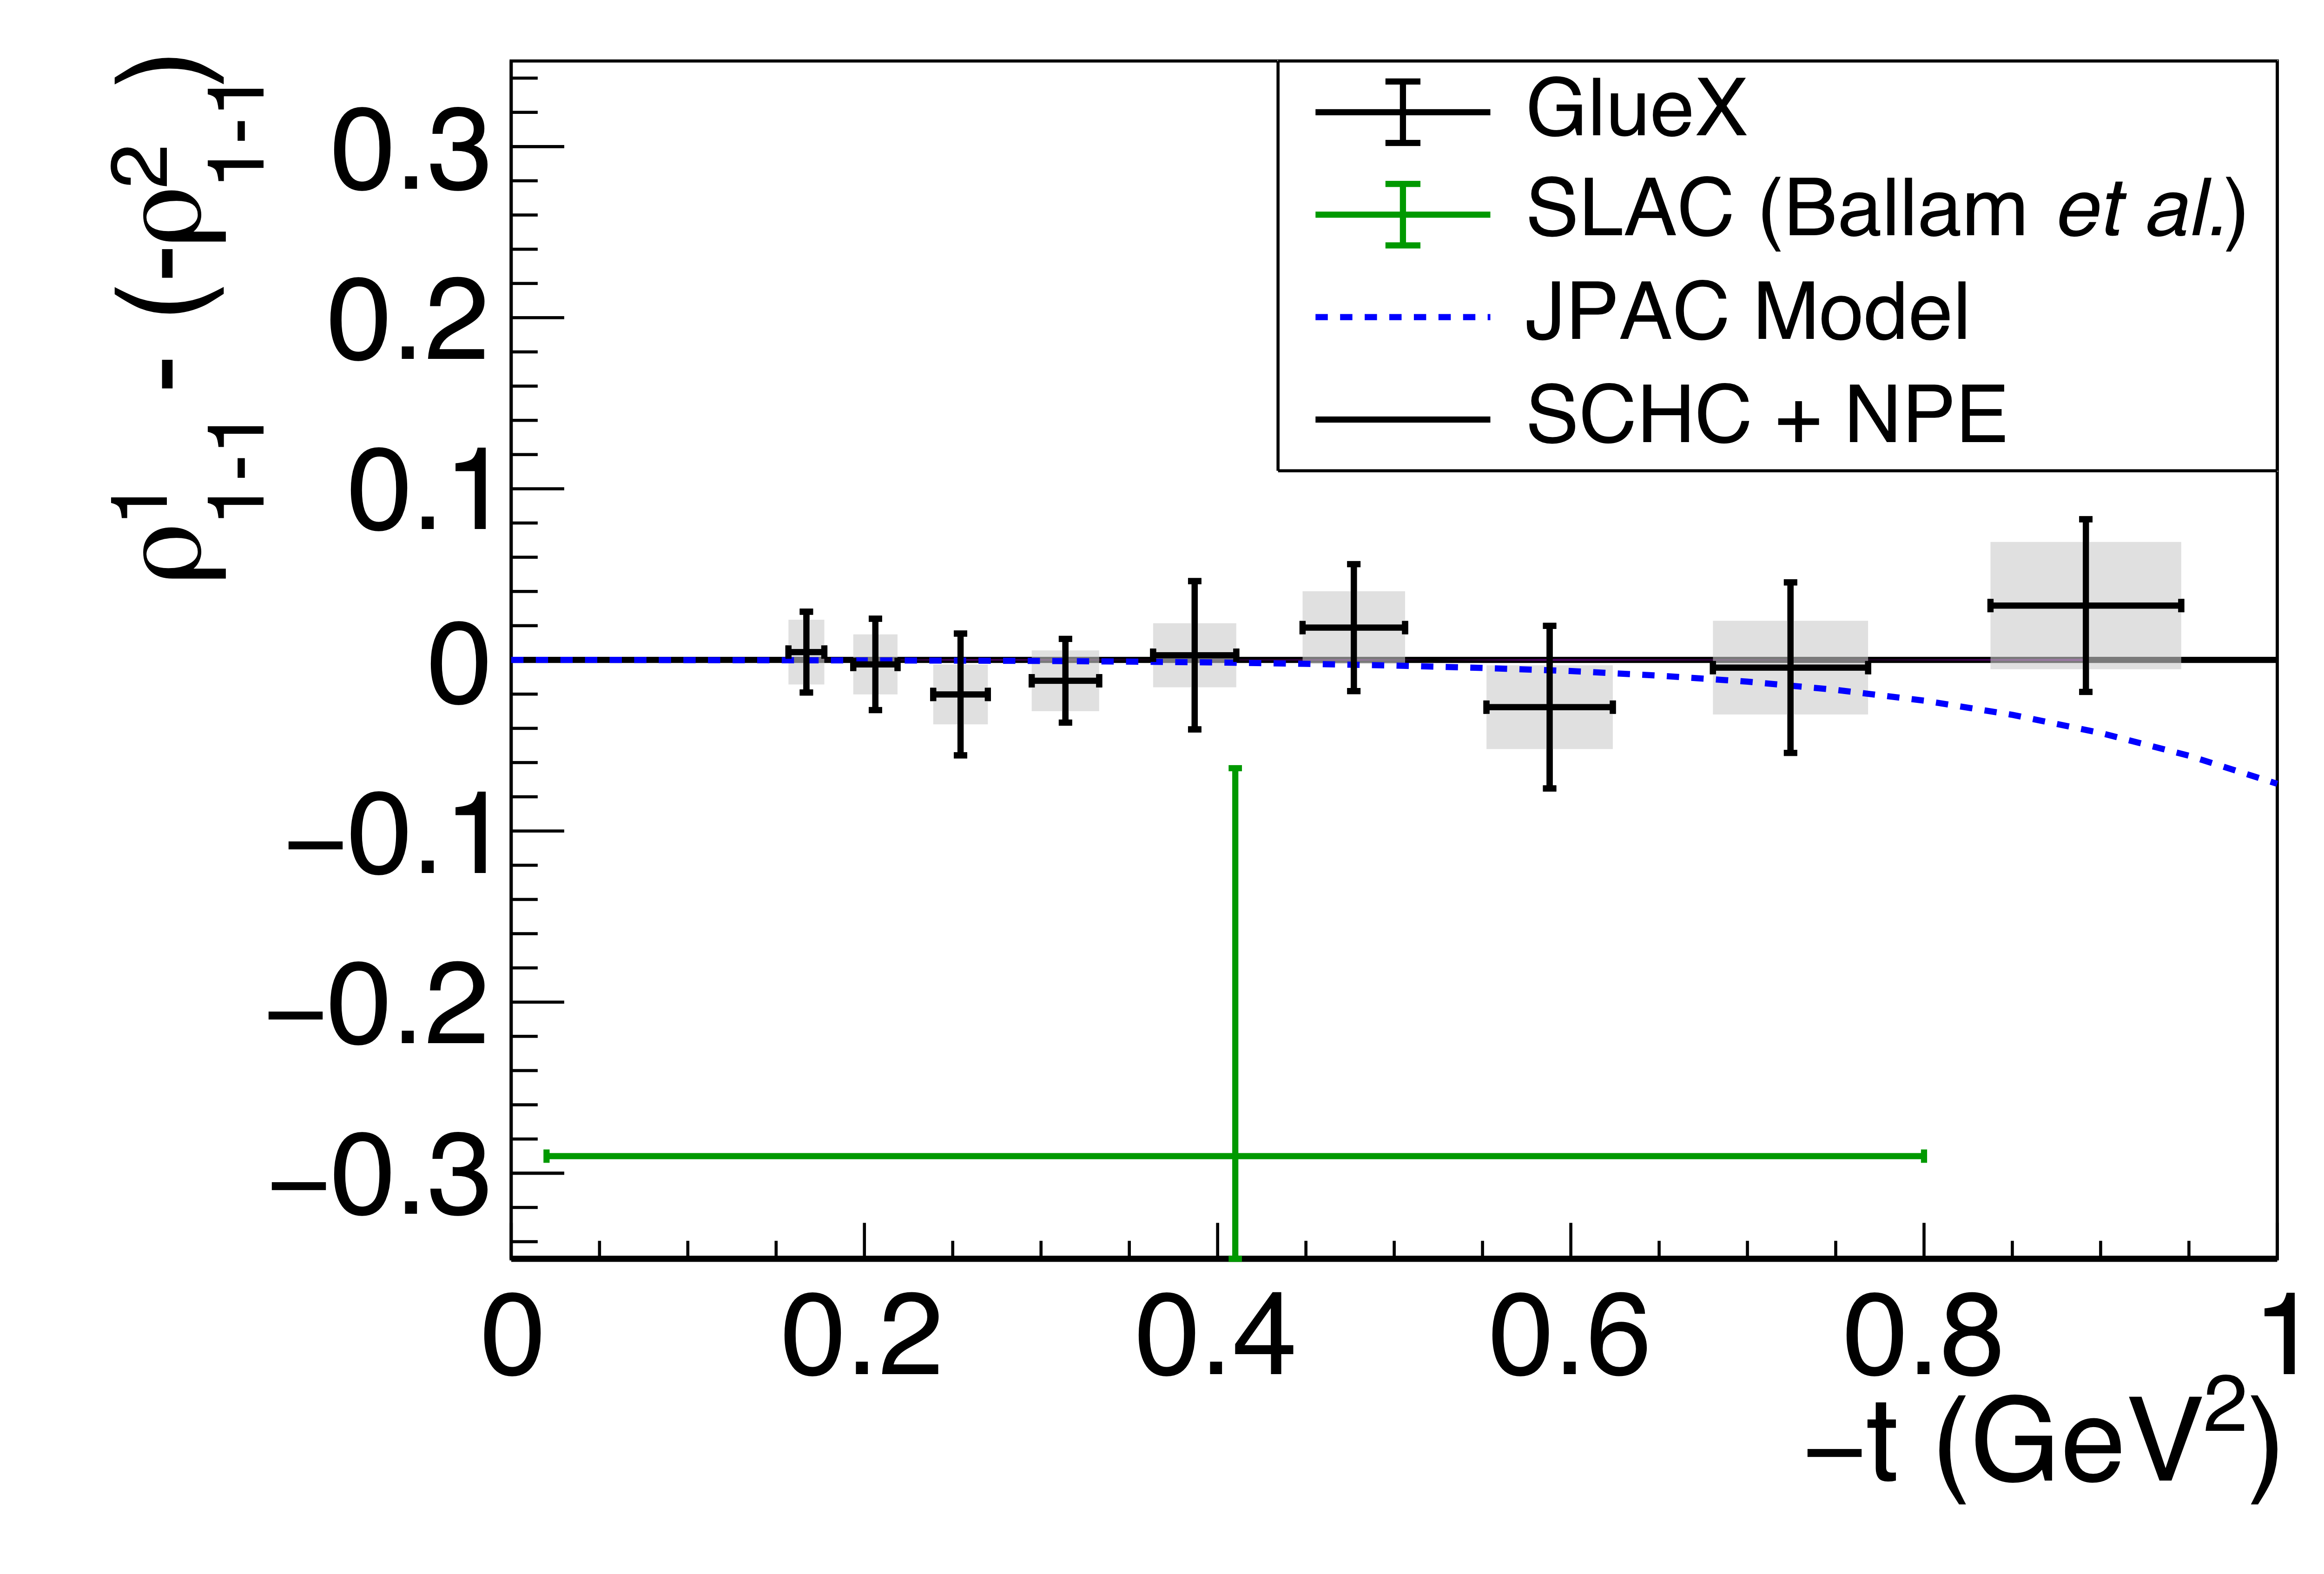
Figure 8a:
Spin-density matrix element differences, as discussed in the text. The symbols are the same as described in Fig. 5. |
Phys. Rev. C112 (2025) 2, 025203: downloads png pdf |
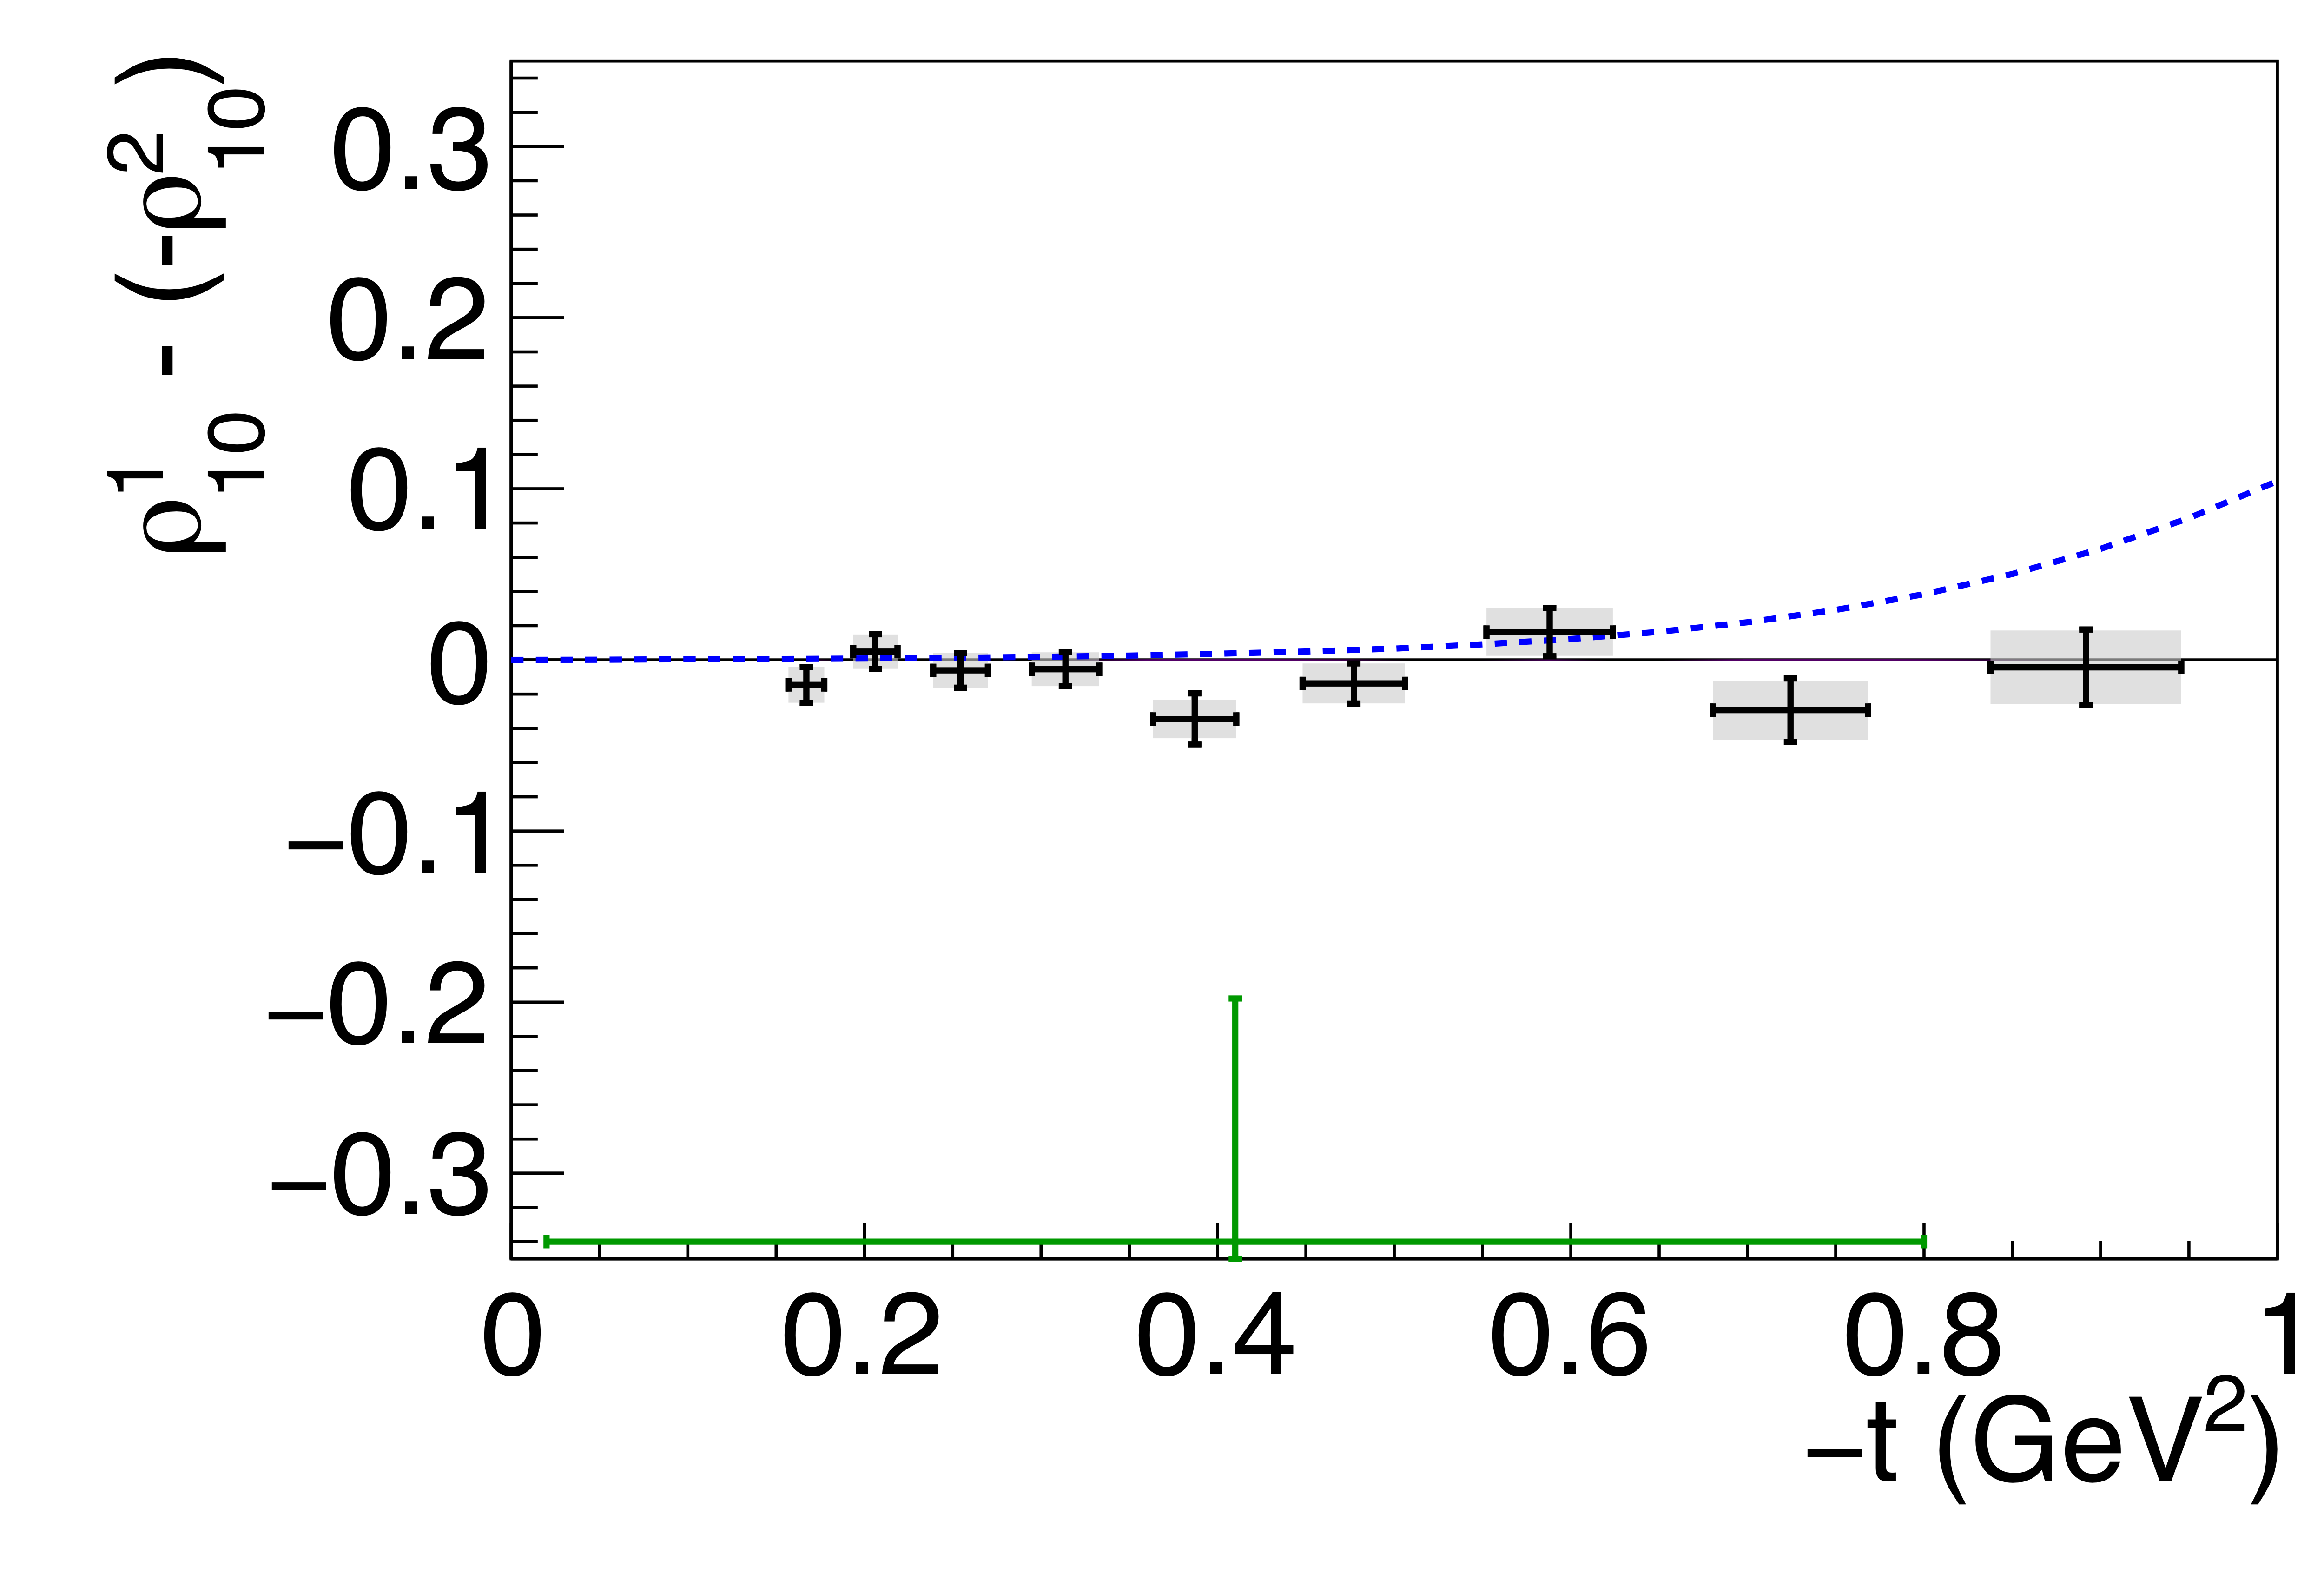
Figure 8b:
Spin-density matrix element differences, as discussed in the text. The symbols are the same as described in Fig. 5. |
Phys. Rev. C112 (2025) 2, 025203: downloads png pdf |
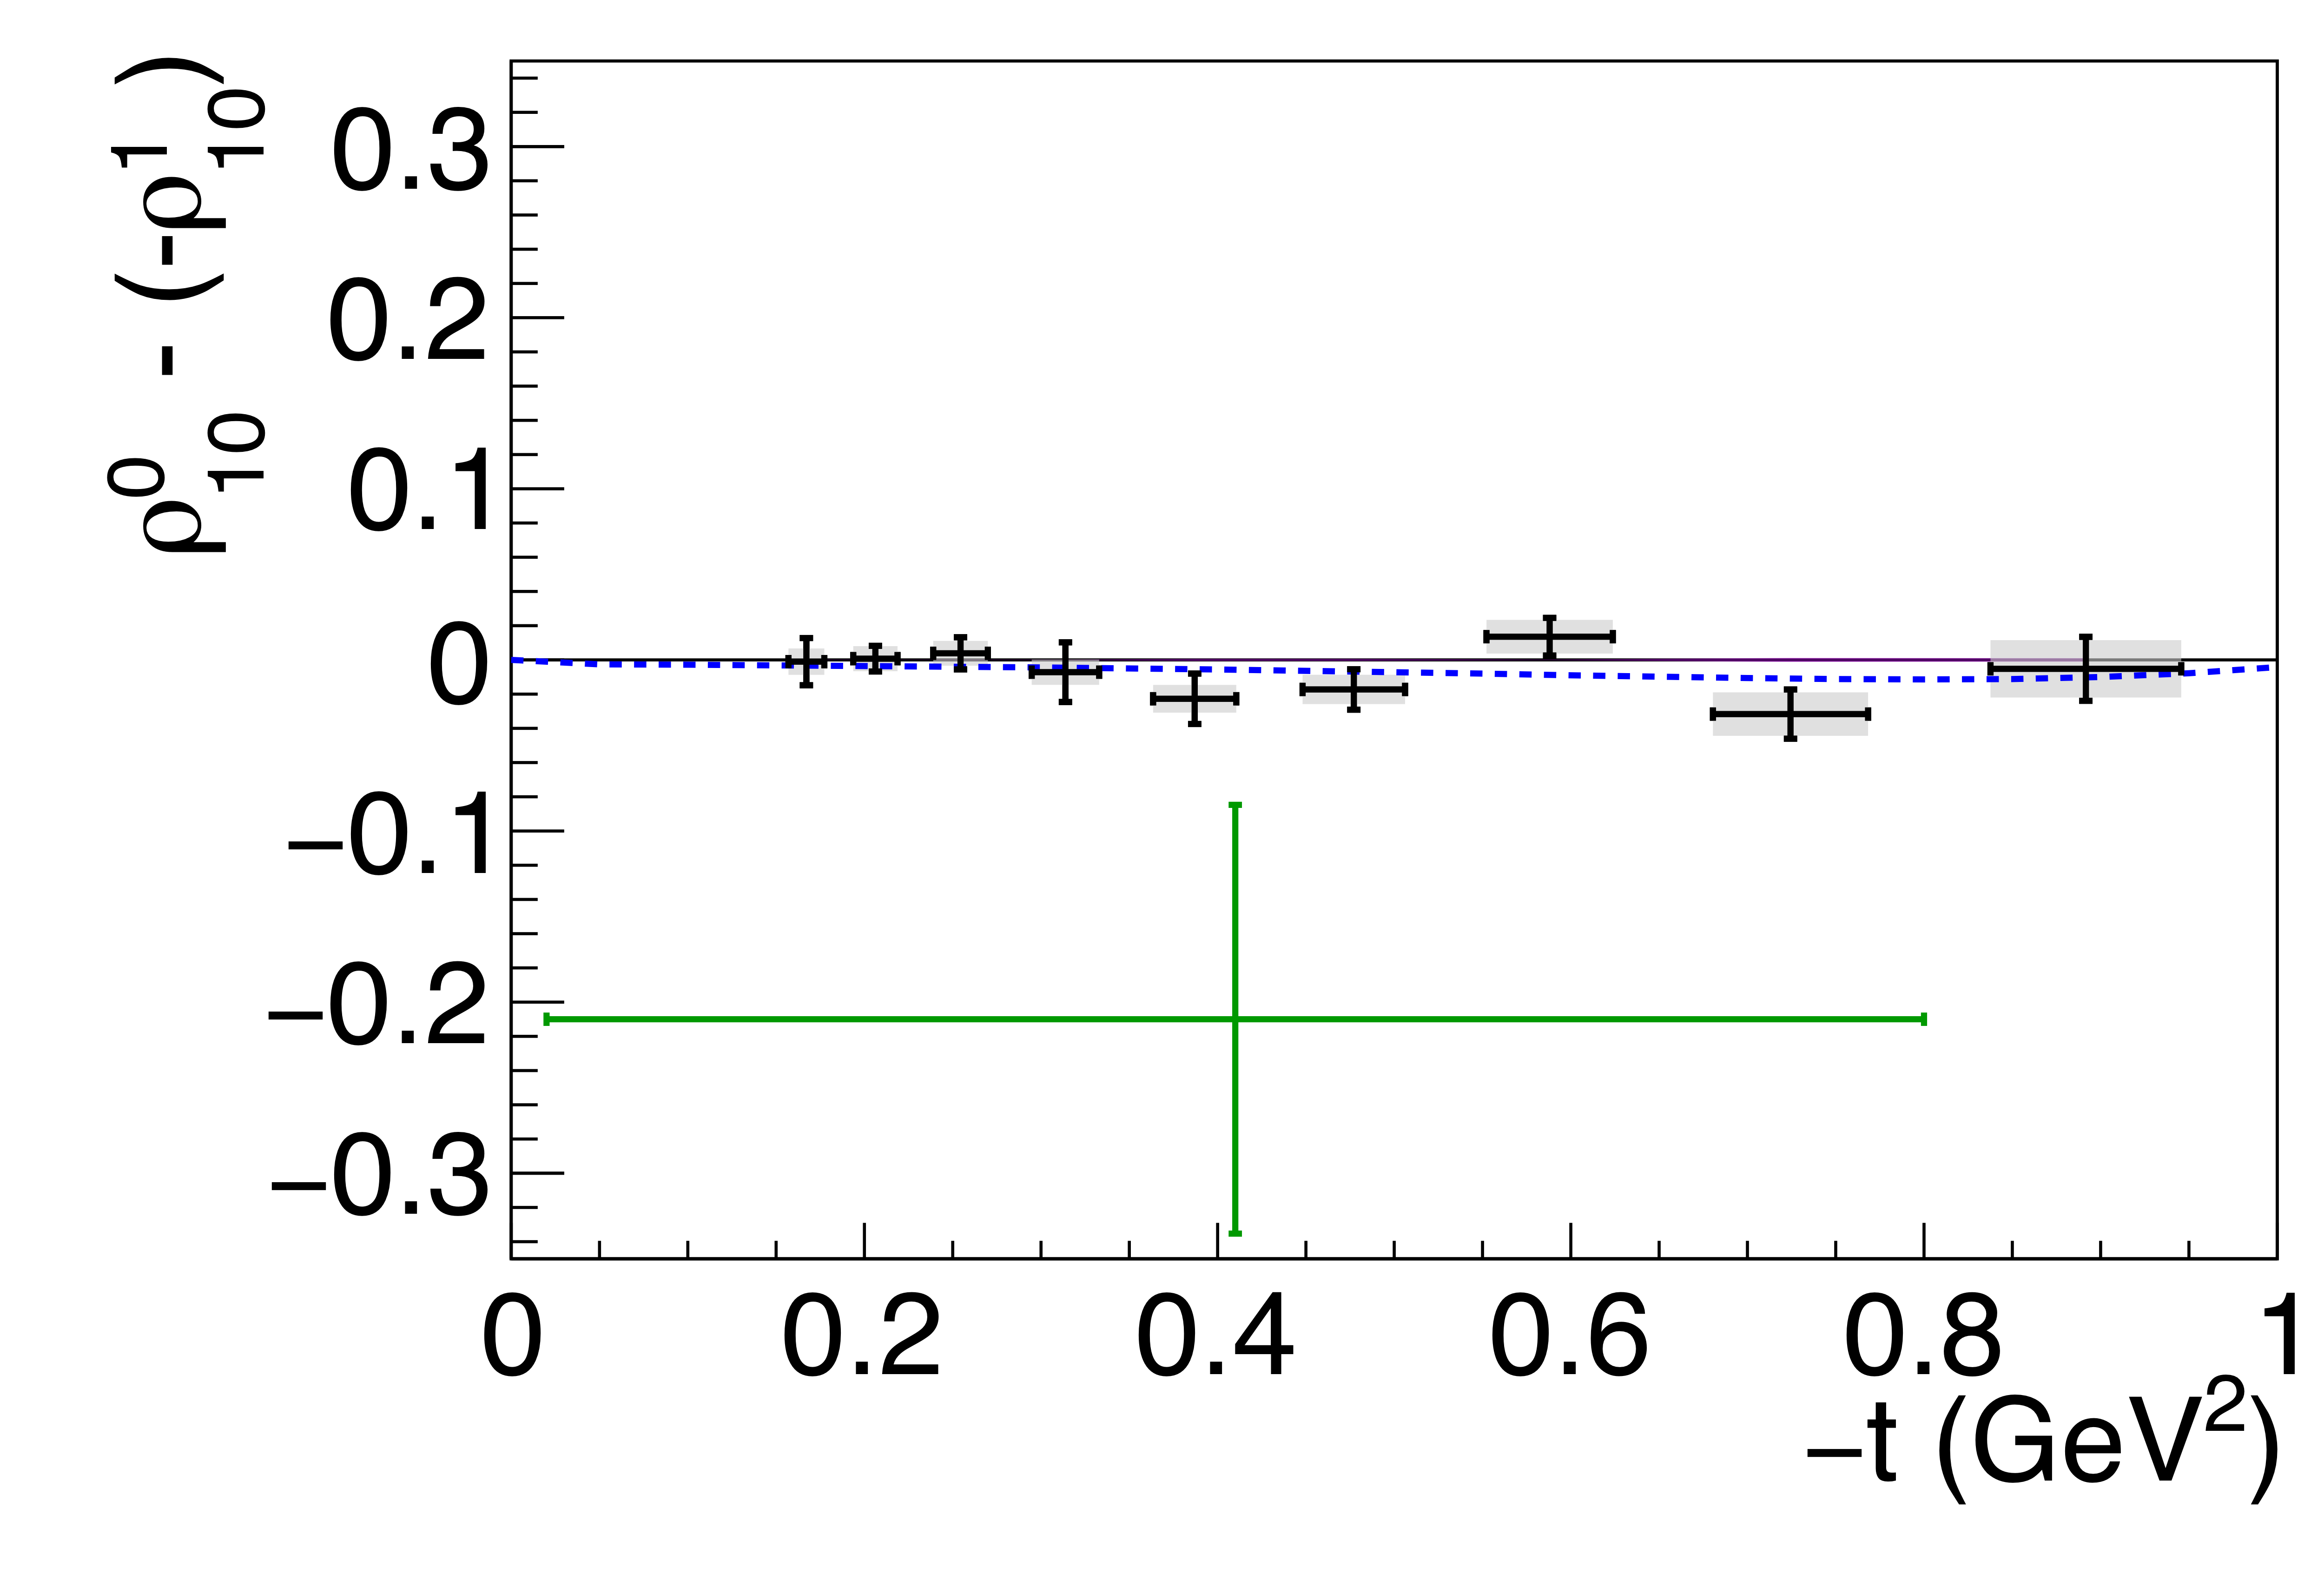
Figure 8c:
Spin-density matrix element differences, as discussed in the text. The symbols are the same as described in Fig. 5. |