Beam Asymmetry $\Sigma$ for the photoproduction of $\eta$ and $\eta'$ mesons at $E_\gamma=8.8$ GeV
Abstract:
We report on the measurement of the beam asymmetry $\Sigma$ for the reactions $\vec{\gamma}p\rightarrow p\eta$ and $\vec{\gamma}p \rightarrow p\eta^{\prime}$ from the GlueX experiment, using an 8.2-8.8 GeV linearly polarized tagged photon beam incident on a liquid hydrogen target in Hall D at Jefferson Lab. These measurements are made as a function of momentum transfer $-t$, with significantly higher statistical precision than our earlier $\eta$ measurements, and are the first measurements of $\eta^{\prime}$ in this energy range. We compare the results to theoretical predictions based on $t$-channel quasi-particle exchange. We also compare the ratio of $\Sigma_{\eta}$ to $\Sigma_{\eta^{\prime}}$ to these models, as this ratio is predicted to be sensitive to the amount of $s\bar{s}$ exchange in the production. We find that photoproduction of both $\eta$ and $\eta^{\prime}$ is dominated by natural parity exchange with little dependence on $-t$.Journal: Phys. Rev. C100, 052201(R) (2019)
arXiv: arXiv:1908.05563
HEPdata: link
PRC 100, 052201(R) (2019): downloads png pdf |
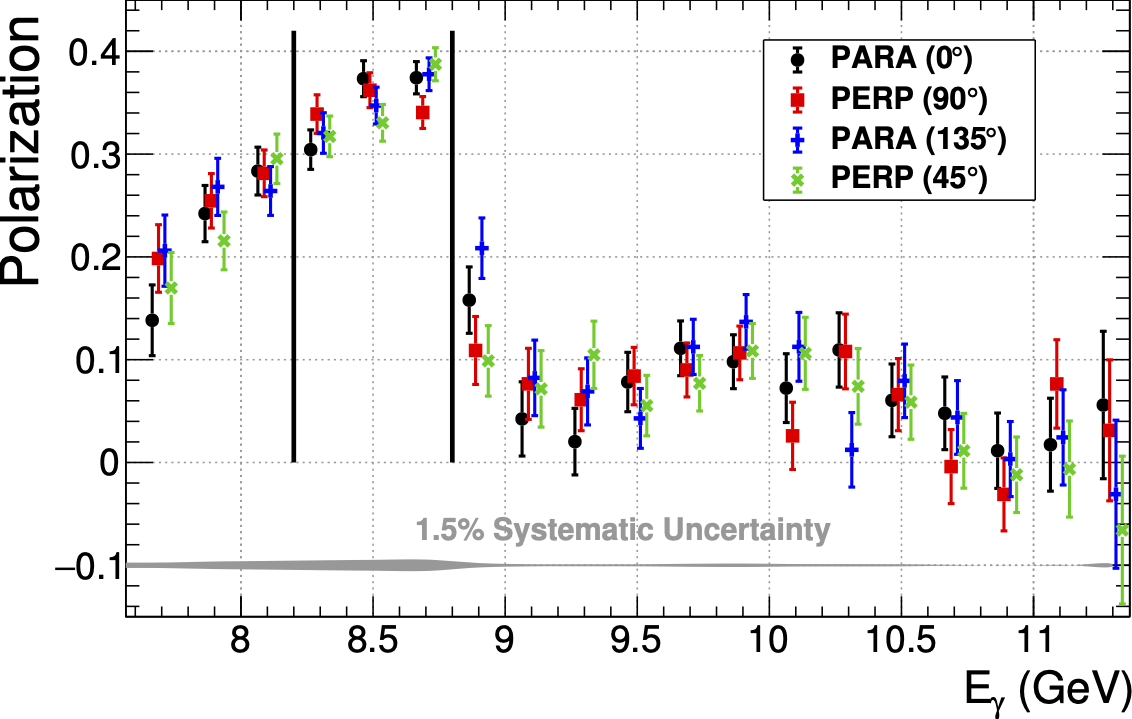
Figure 1:
The measured degree of linear polarization for the four diamond orientations is plotted as a function of the photon energy, offset from one another in energy for clarity. Events with energy between 8.2-8.8 GeV are selected, as demarcated by the vertical lines. |
PRC 100, 052201(R) (2019): downloads png pdf |
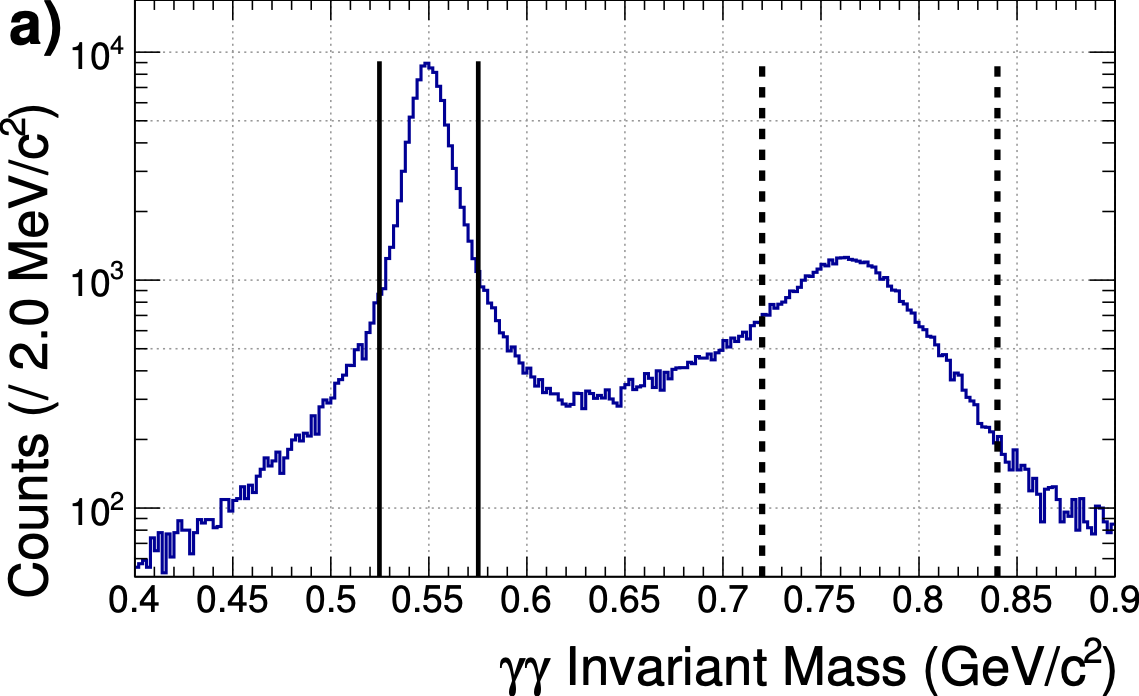
Figure 2a:
The $2\gamma$ (a) and $\pi^+\pi^-\eta$ (b) invariant mass distributions are graphed after all selection cuts are applied. The $\eta$ and $\eta^{\prime}$ peak region samples consist of the events between the solid vertical lines. The “side-band region” samples include events between the vertical dashed lines and are used to evaluate the background asymmetry. The dashed curve on (a) is a MC calculation of the reaction $\gamma p \rightarrow p\omega$ where the $\omega \rightarrow \pi^0\gamma$ and one of the resulting photons is not detected. |
PRC 100, 052201(R) (2019): downloads png pdf |
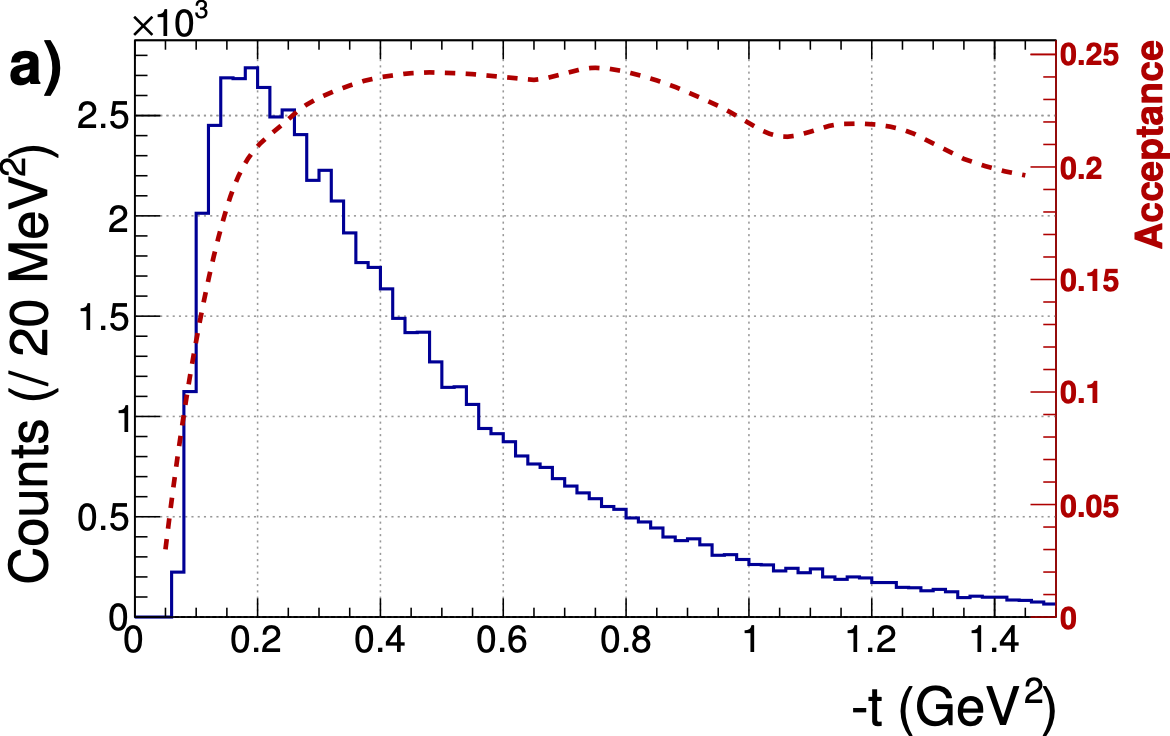
Figure 3a:
The yields of $\eta$ (a) and $\eta^{\prime}$ (b) events are plotted as a function of $-t$ after all selection cuts are applied. The acceptance functions for $\gamma p\rightarrow\eta p (p\gamma\gamma)$ and $\gamma p\rightarrow\eta^{\prime} p (p\pi^{+}\pi^{-}\gamma\gamma)$, shown as the dashed curves, are determined from Monte Carlo simulation using a Regge model. |
PRC 100, 052201(R) (2019): downloads png pdf |
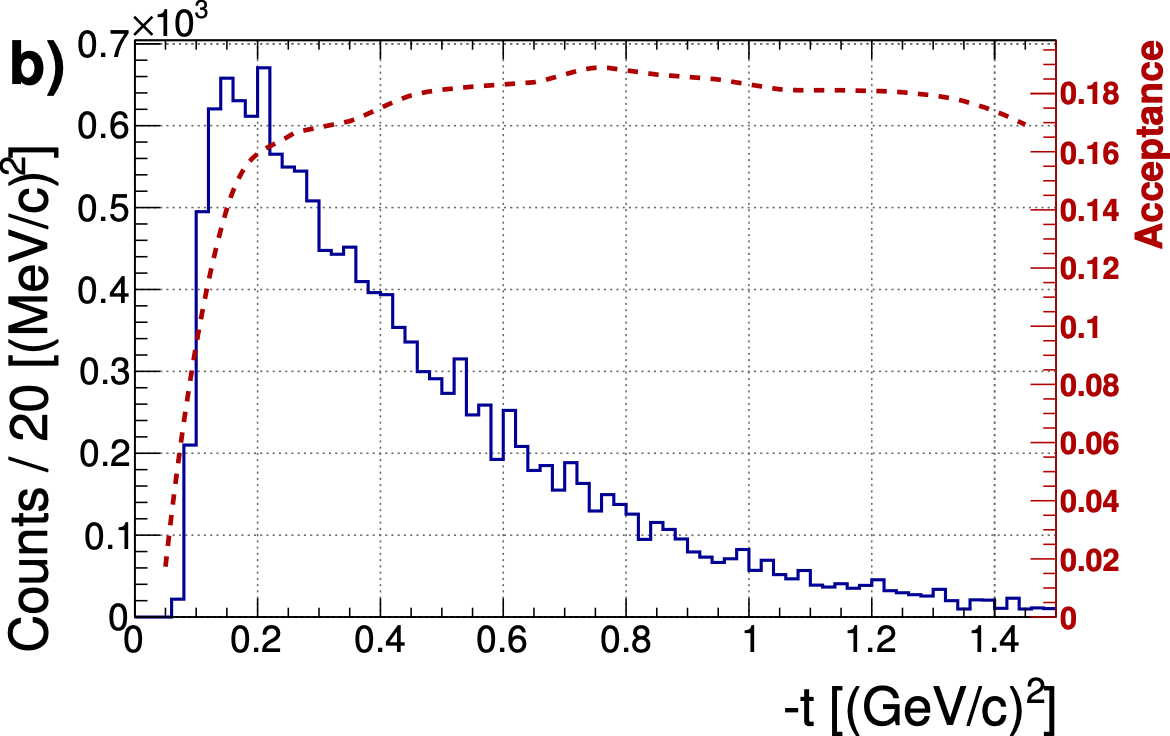
Figure 3b:
The yields of $\eta$ (a) and $\eta^{\prime}$ (b) events are plotted as a function of $-t$ after all selection cuts are applied. The acceptance functions for $\gamma p\rightarrow\eta p (p\gamma\gamma)$ and $\gamma p\rightarrow\eta' p (p\pi^{+}\pi^{-}\gamma\gamma)$, shown as the dashed curves, are determined from Monte Carlo simulation using a Regge model. |
PRC 100, 052201(R) (2019): downloads png pdf |
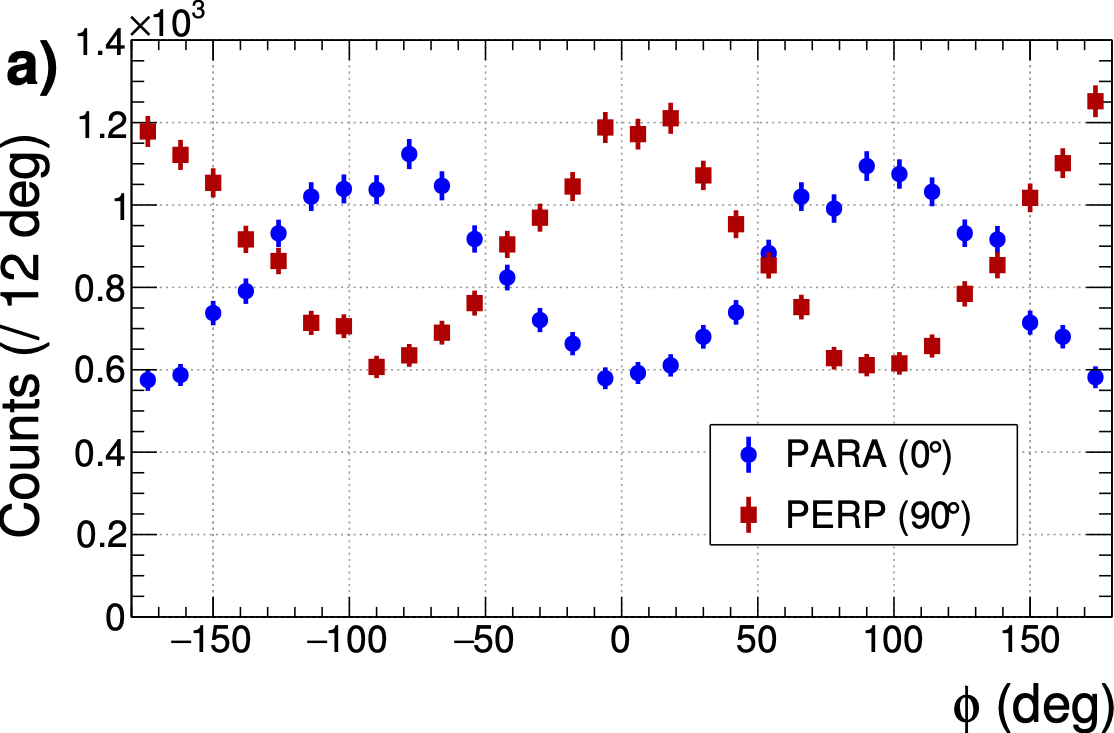
Figure 4a:
(a) The yields integrated over the full range of $-t$, $Y_{\perp}$ and $Y_{\parallel}$, are shown for the $\eta$ events using one set of orthogonally polarized data, and (b) the yield asymmetry is shown, fitted with a $\chi^2/\mathrm{ndf} = 25.59/28$. |
PRC 100, 052201(R) (2019): downloads png pdf |
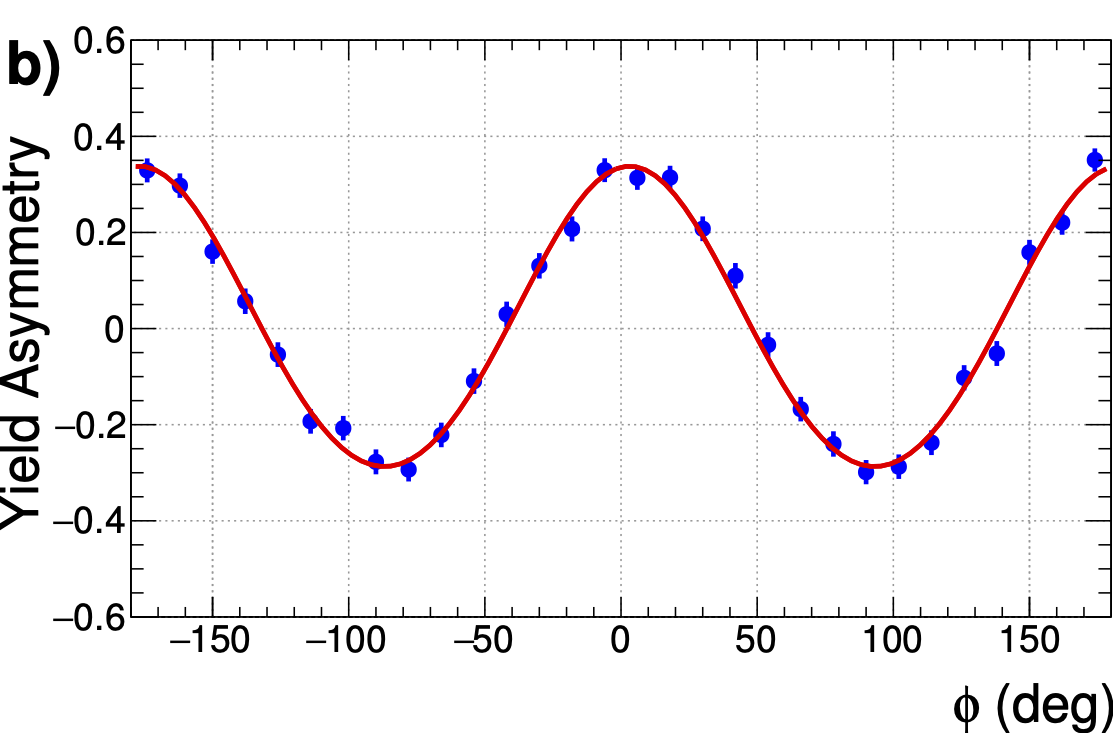
Figure 4b:
(a) The yields integrated over the full range of $-t$, $Y_{\perp}$ and $Y_{\parallel}$, are shown for the $\eta$ events using one set of orthogonally polarized data, and (b) the yield asymmetry is shown, fitted with a $\chi^2/\mathrm{ndf} = 25.59/28$. |
PRC 100, 052201(R) (2019): downloads png pdf |
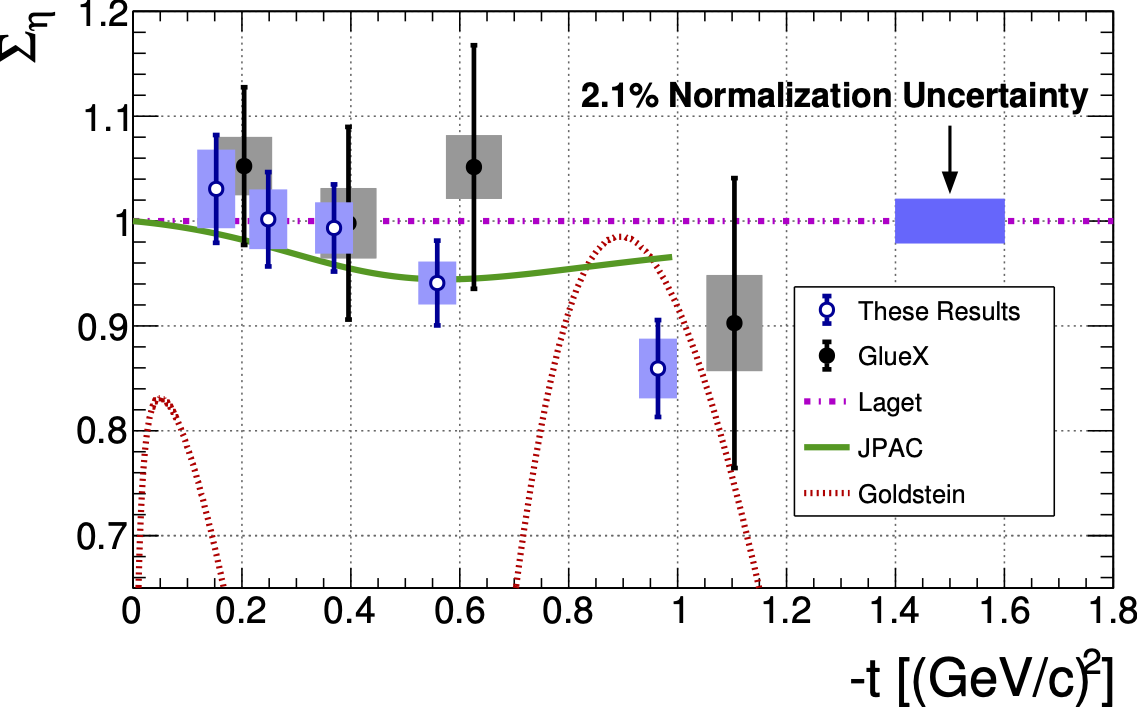
Figure 5:
The photon beam asymmetry $\Sigma_\eta$ is shown as a function of $-t$ for $\gamma p \rightarrow p\eta$. The vertical error bars represent the total errors and the horizontal error bars along with predictions for several Regge theory calculations. Previous GlueX (2017) results [13] are shown along with predictions for several Regge theory calculations, Laget [25,26], JPAC [3], EtaMAID [27], and Goldsein [28]. The 2.1$\%$ relative uncertainty is due largely to the polarization measurement. |
PRC 100, 052201(R) (2019): downloads png pdf |
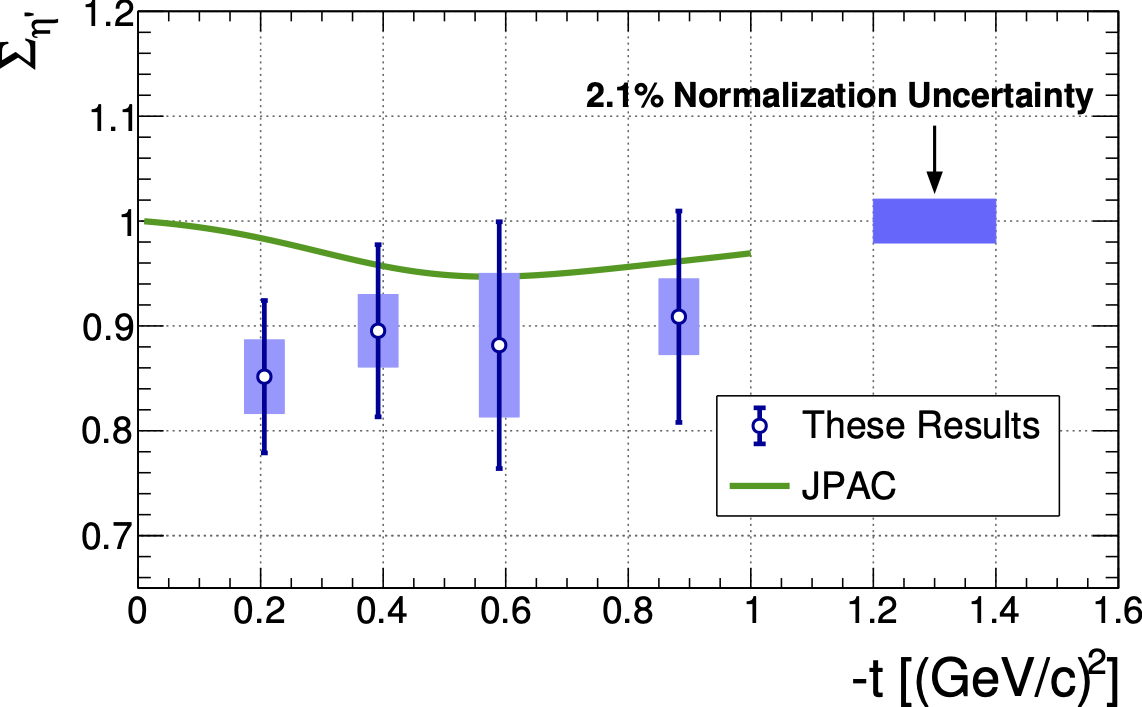
Figure 6:
The photon beam asymmetry $\Sigma_{\eta\prime}$ is shown for ${\vec{\gamma}p \rightarrow p\eta^\prime}$. The vertical error bars represent the total errors and the horizontal error bars represent the RMS widths of the $-t$ distributions in each bin. The Regge theory calculation from JPAC [3] is shown. |
PRC 100, 052201(R) (2019): downloads png pdf |
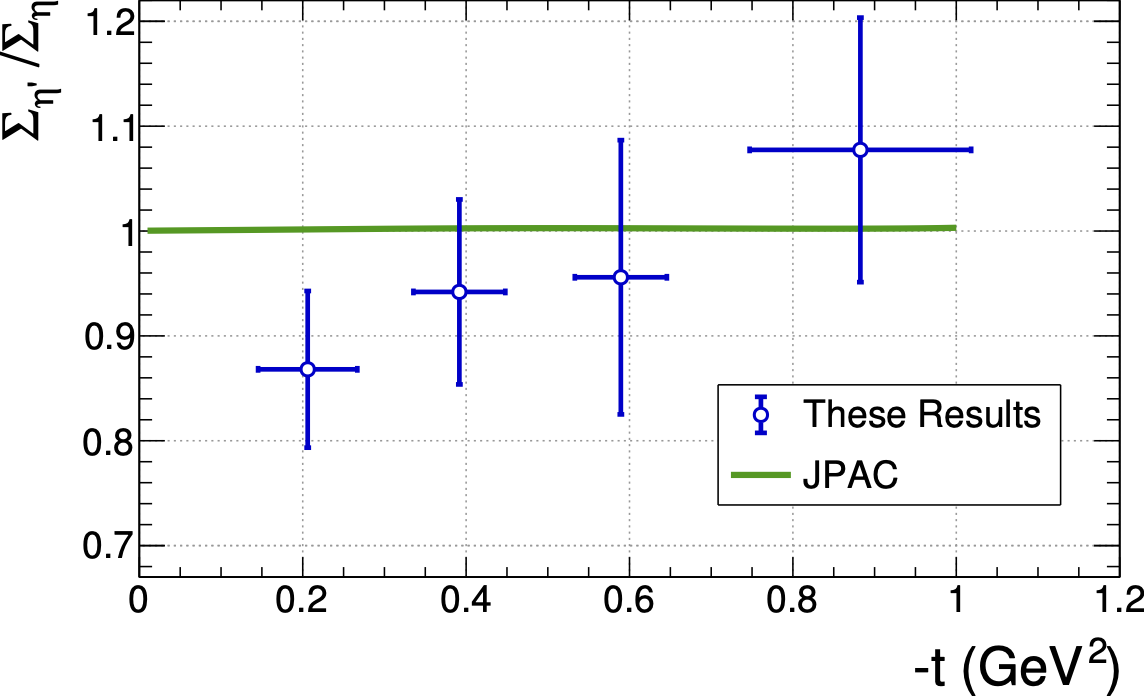
Figure 7:
The photon beam asymmetry ratio $\Sigma_{\eta^\prime}/\Sigma_\eta$ is plotted. The vertical error bars represent total errors. The horizontal error bars represent the RMS widths of the $-t$ distributions in each bin. The Regge theory calculation from JPAC [13] is shown. |